. 2021 Jan 29;10(2):266.
doi: 10.3390/cells10020266.

The Temporal Order of DNA Replication Shaped by Mammalian DNA Methyltransferases

Affiliations

The Temporal Order of DNA Replication Shaped by Mammalian DNA Methyltransferases

Shin-Ichiro Takebayashi et al. Cells. .

Abstract

Multiple epigenetic pathways underlie the temporal order of DNA replication (replication timing) in the contexts of development and disease. DNA methylation by DNA methyltransferases (Dnmts) and downstream chromatin reorganization and transcriptional changes are thought to impact DNA replication, yet this remains to be comprehensively tested. Using cell-based and genome-wide approaches to measure replication timing, we identified a number of genomic regions undergoing subtle but reproducible replication timing changes in various Dnmt-mutant mouse embryonic stem (ES) cell lines that included a cell line with a drug-inducible Dnmt3a2 expression system. Replication timing within pericentromeric heterochromatin (PH) was shown to be correlated with redistribution of H3K27me3 induced by DNA hypomethylation: Later replicating PH coincided with H3K27me3-enriched regions. In contrast, this relationship with H3K27me3 was not evident within chromosomal arm regions undergoing either early-to-late (EtoL) or late-to-early (LtoE) switching of replication timing upon loss of the Dnmts. Interestingly, Dnmt-sensitive transcriptional up- and downregulation frequently coincided with earlier and later shifts in replication timing of the chromosomal arm regions, respectively. Our study revealed the previously unrecognized complex and diverse effects of the Dnmts loss on the mammalian DNA replication landscape.

Keywords: DNA methyltransferases; DNA replication; replication timing.


Conflict of interest statement

The authors declare no conflict of interest.

Figures
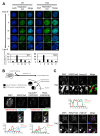
Figure 1
Figure 1
H3K27me3 foci formed in mouse embryonic stem cells with severely hypomethylated DNA coincide with later replication of pericentromeric heterochromatin. (A) Spatial regulation of DNA replication sites in Dnmt1−/−Dnmt3a−/−Dnmt3b−/− triple-knockout (TKO) mouse embryonic stem (ES) cell nuclei during S phase. Asynchronously growing cells were labeled with EdU (green) for 10 min to visualize sites of DNA synthesis in the nucleus. Five representative images of the distribution patterns of DNA replication foci during S phase over time (I–V) are shown [40,41]. Nuclear DNA was stained with DAPI (blue). The percentage of cells displaying each focus pattern was scored (n > 200). (B) The top panel shows the experimental strategy used to determine the temporal order of replication within pericentromeric heterochromatin (PH) regions of TKO ES cells where abnormal H3K27me3 foci were formed. Unsynchronized cells were first labeled with DIG-dUTP, cultured for 1 h, and then fixed for PCNA/H3K27me3 immunostaining. Both DIG-dUTP-positive and PCNA-positive PH were selected to measure colocalization with H3K27me3 foci. During the 1 h culture period, cells proceeded to subsequent stages of S phase, which allowed us to spatially distinguish already replicated sites (DIG-dUTP-labeled) from currently replicating sites (PCNA-labeled) within PH regions (middle panel). H3K27me3 foci colocalized only with PCNA-positive, later replicating PH, producing the yellow color in the merged image (bottom right). The charts in the bottom panel show the immunofluorescence signal intensities for each label (A.U., arbitrary units) plotted along the white line shown in the magnified immunofluorescence images of the PH regions. H3K27me3 and DIG-dUTP exhibited a mutually exclusive distribution in DAPI-dense heterochromatin regions. However, H3K27me3 distribution coincided with that of PCNA. Asterisks in the images indicate the direction of line scanning. (C) Perturbed Aurora B recruitment and loss of histone H3 phosphorylation at H3K27me foci were observed in the interphase nuclei of the TKO ES cells (top panel). Arrows in the magnified views indicate the H3K27me3-enriched PH regions where Aurora B signals were depleted. The chart (middle panel) shows the intensities of each immunofluorescence signal as in (B). Asterisks in the images indicate the direction of line scanning. Immunofluorescence detection of phosphorylated histone H3 at Ser10 (H3S10P) together with H3K27me3 on mitotic chromosomes is also shown (bottom panel). Intense H3S10P signals were not detected in the H3K27me3-enriched PH of TKO ES cells. Arrows in the magnified views indicate the H3K27me3-enriched PH of a mitotic chromosome where H3S10P signals were depleted, while the arrowheads indicate the non-H3K27me3-enriched PH where the accumulation of H3S10P normally occurs. Cell images were collected at multiple stage positions using a deconvolution fluorescence microscope (see details in Materials and Methods) and images at one focal plane are shown. Scale bars, 10 µm.
Figure 2
Figure 2
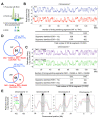
Genome-wide replication timing analysis identified a subset of chromosomal regions sensitive to Dnmt loss. (A) Flowchart of genome-wide replication timing analysis. BrdU-substituted DNA from early and late S phase cells was differentially labeled and sequenced by next generation sequencing. (B) Replication timing profiles of control wild-type and TKO ES cells for chromosome 7. The sequence read count ratio for the early and late cells (Log2 early/late) for each 5-kb genomic bin was plotted against the chromosomal position (top panel). The LOESS-smoothed plots for the average of two biological replicate experiments are shown. The significant EtoL and LtoE switching segments in the TKO ES cells are indicated in the table (bottom panel). Replication timing data were averaged into 200-kb windows and statistical significance was calculated between the control wild-type and TKO ES cells, as described in the Methods. (C) Replication timing profiles for chromosome 7 of the Dnmt3a−/−Dnmt3b−/− double-knockout ES cells with and without Dnmt3a2 induction (DKO + RU486 vs. DKO − RU486; top panel). The significant early-to-late (EtoL) and late-to-early (LtoE) switching segments upon Dnmt3a2 induction in the DKO ES cells are indicated in the table (bottom panel). (D) The overlap between genomic segments that underwent replication timing switching is shown as a Venn diagram (using the FDR = 1% data from Figure 2B,C). (E) Expanded plots of representative regions that underwent replication timing switches in Dnmt-mutant ES cells.
Figure 3
Figure 3
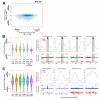
Genome-wide comparison of replication timing changes and H3K27me3 redistribution in TKO cells. (A) Redistribution of the H3K27me3 mark relative to changes in replication timing. Replication timing changes after Dnmt loss (TKO ESC log2 ratio − WT ESC log2 ratio) were plotted against the changes in H3K27me3 enrichment (TKO ESC − WT ESC) identified by ChIP-seq [48]. Replication timing data averaged over 200-kb segments and enrichment of H3K27me3 in each corresponding segment (12,732 segments in total) were used to calculate differences between WT and TKO. (B) Box plots showing the changes in H3K27me3 enrichment in EtoL and LtoE switching regions after Dnmt loss (for segments with an FDR = 1% and 5% from Figure 2C) compared with non-switching early (EtoE) or late (LtoL) regions. The number of 200-kb segments analyzed is indicated below each plot. IGV genome browser tracks illustrating the distribution of H3K27me3 within representative replication timing switching regions (from Figure 2E) are shown to the right. The scale for H3K27me3 enrichment is shown in the upper right corner. (C) Box plots showing the replication timing changes in genomic regions scoring in the top 1%, 5%, and 10% in terms of H3K27me3 gain and loss. The number of 200-kb segments analyzed is indicated below each plot. The replication timing profiles for representative regions undergoing redistribution of the H3K27me3 mark after Dnmt loss are shown to the right.
Figure 4
Figure 4
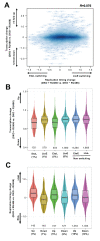
Replication timing changes upon DNA hypomethylation are associated with transcriptional changes. (A) Replication timing changes (DKO + RU486 log2 ratio − DKO − RU486 log2 ratio) were plotted against the transcriptional changes (log2(DKO + RU486/DKO − RU486)). (B) Box plots showing the transcriptional changes in EtoL and LtoE switching regions upon Dnmt3a2 induction (segments with an FDR = 1% and 5% from Figure 2C) compared with the non-switching early (EtoE) or late (LtoL) regions. The number of genes analyzed is indicated below each plot. The y-axis is the fold change (not log-transformed). (C) Box plots showing the replication timing changes in genomic regions of genes scoring in the top 1%, 5%, and 10% in terms of up- and downregulation. The number of genomic regions analyzed is indicated below each plot.

References

    1. Berezney R., Dubey D.D., Huberman J.A. Heterogeneity of eukaryotic replicons, replicon clusters, and replication foci. Chromosoma. 2000;108:471–484. doi: 10.1007/s004120050399. - DOI - PubMed
    1. Pope B.D., Gilbert D.M. The replication domain model: Regulating replicon firing in the context of large-scale chromosome architecture. J. Mol. Biol. 2013;425:4690–4695. doi: 10.1016/j.jmb.2013.04.014. - DOI - PMC - PubMed
    1. Takebayashi S.-I., Ogata M., Okumura K. Anatomy of mammalian replication domains. Genes. 2017;8:110. doi: 10.3390/genes8040110. - DOI - PMC - PubMed
    1. Hiratani I., Ryba T., Itoh M., Yokochi T., Schwaiger M., Chang C.-W., Lyou Y., Townes T.M., Schübeler D., Gilbert D.M. Global reorganization of replication domains during embryonic stem cell differentiation. PLoS Biol. 2008;6:e245. doi: 10.1371/journal.pbio.0060245. - DOI - PMC - PubMed
    1. Hiratani I., Ryba T., Itoh M., Rathjen J., Kulik M., Papp B., Fussner E., Bazett-Jones D.P., Plath K., Dalton S., et al. Genome-wide dynamics of replication timing revealed by in vitro models of mouse embryogenesis. Genome Res. 2009;20:155–169. doi: 10.1101/gr.099796.109. - DOI - PMC - PubMed

Publication types