. 2021 Jan 29;22(3):1345.
doi: 10.3390/ijms22031345.

BBS Proteins Affect Ciliogenesis and Are Essential for Hedgehog Signaling, but Not for Formation of iPSC-Derived RPE-65 Expressing RPE-Like Cells

Affiliations

BBS Proteins Affect Ciliogenesis and Are Essential for Hedgehog Signaling, but Not for Formation of iPSC-Derived RPE-65 Expressing RPE-Like Cells

Caroline Amalie Brunbjerg Hey et al. Int J Mol Sci. .

Abstract

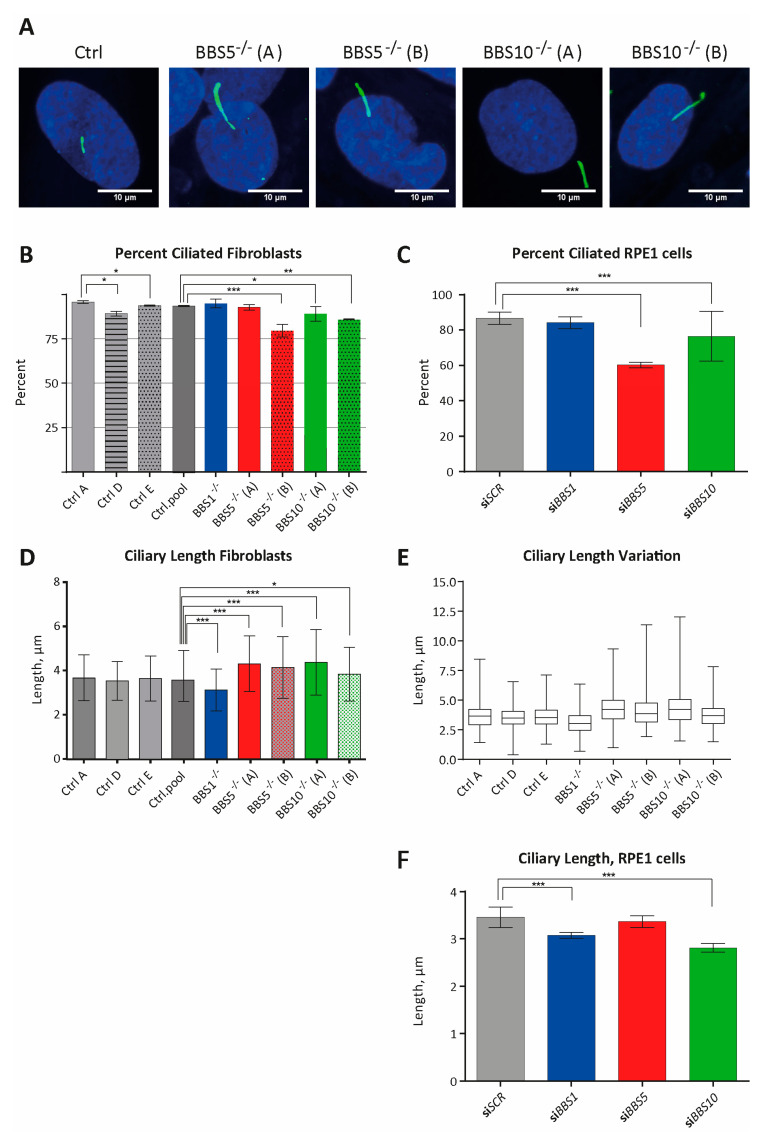
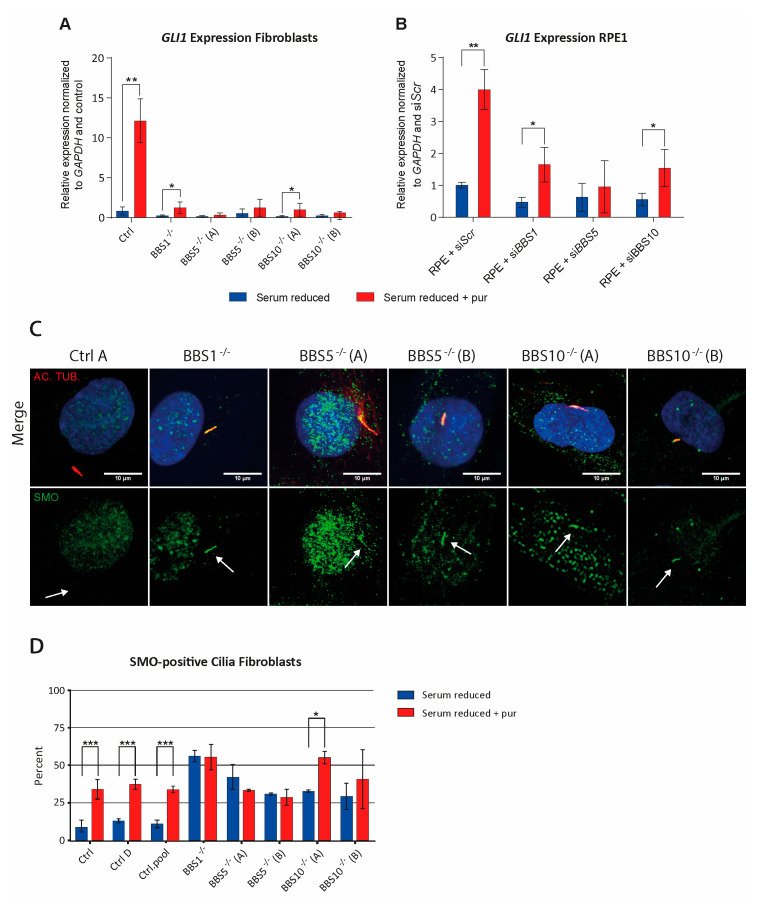
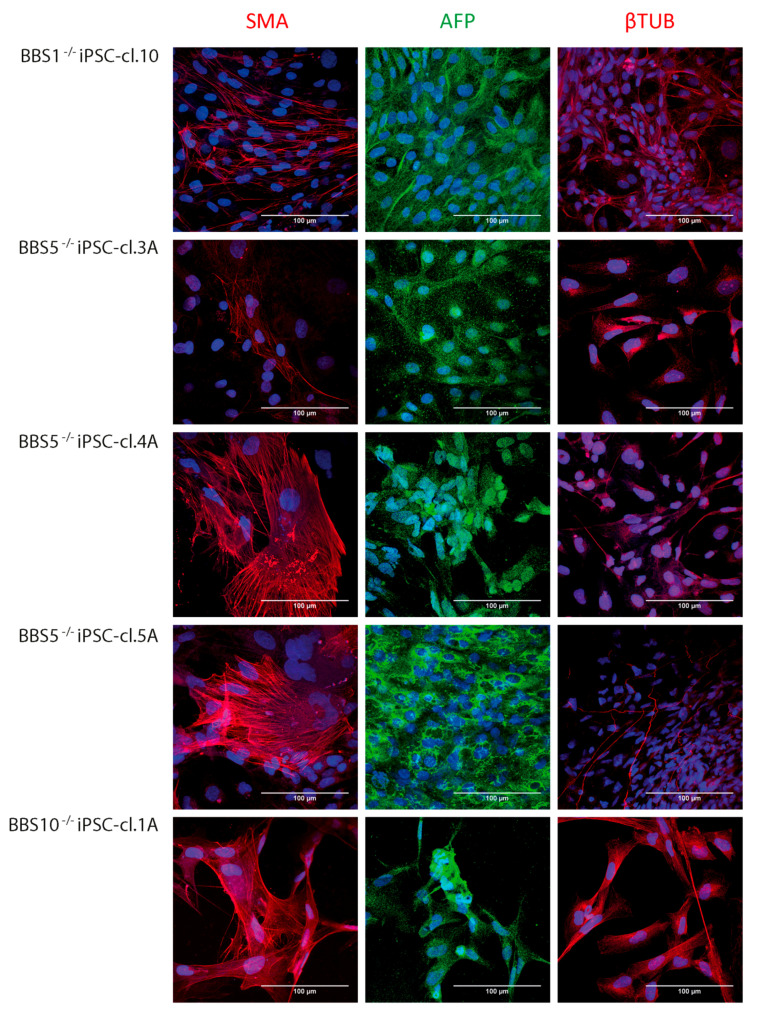
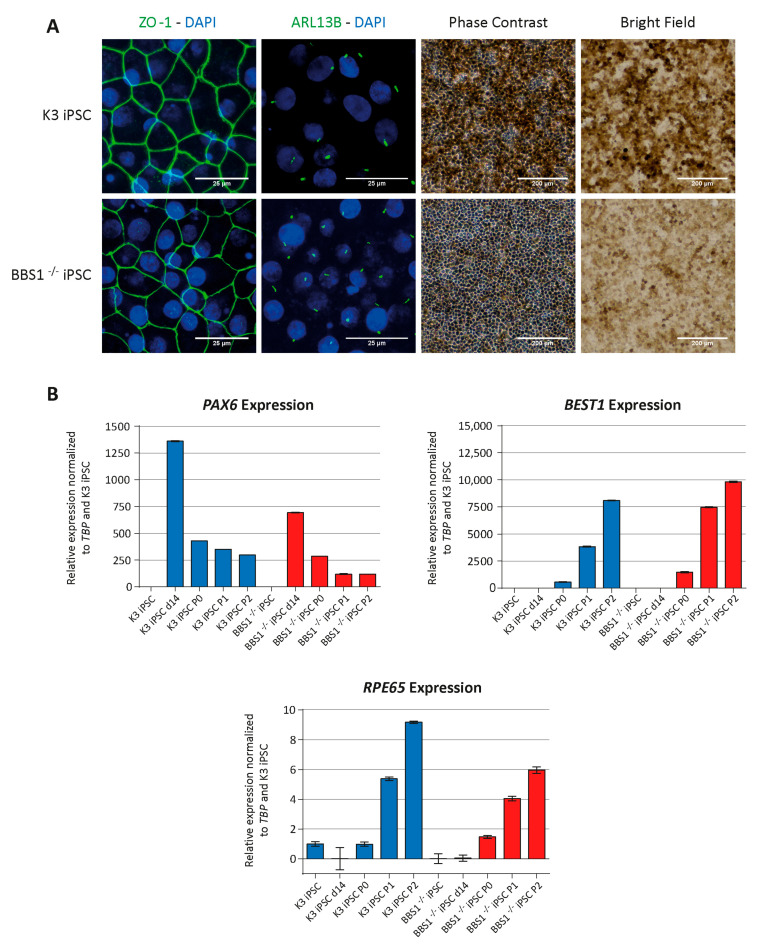
Bardet-Biedl syndrome (BBS) is a ciliopathy characterized by retinal dystrophy, renal cysts, obesity and polydactyly. BBS genes have been implicated in ciliogenesis, hedgehog signaling and retinal pigment epithelium maturation. BBS1 and BBS5 are members of the BBSome, implicated in cilia transport of proteins, and BBS10 is a member of the chaperonin-complex, mediating BBSome assembly. In this study, involvement of BBS1, BBS5 and BBS10 in ciliogenesis and hedgehog signaling were investigated in BBS-defective patient fibroblasts as well as in RPE-hTERT cells following siRNA-mediated knockdown of the BBS genes. Furthermore, the ability of BBS1-defective induced pluripotent stem-cells (iPSCs) to differentiate into RPE cells was assessed. We report that cells lacking functional BBS5 or BBS10 have a reduced number of primary cilia, whereas cells lacking functional BBS1 display shorter primary cilia compared to wild-type cells. Hedgehog signaling was substantially impaired and Smoothened, a component of hedgehog signaling, was trapped inside the cilia of the BBS-defective cells, even in the absence of Smoothened agonist. Preliminary results demonstrated the ability of BBS1-defective iPSC to differentiate into RPE-65 expressing RPE-like cells. The BBS1-/--defective RPE-like cells were less pigmented, compared to RPE-like cells differentiated from control iPSCs, indicating an impact of BBS1 on RPE maturation.

Keywords: BBS; RPE; RPE65; SMO; WNT; ciliogenesis; hedgehog-signaling; induced pluripotent stem cell.


Conflict of interest statement

The authors declare no conflict of interest.

Figures

Figure 1
Figure 1
Investigation of the primary cilium in fibroblast obtained from patients with bardet biedl syndrome (BBS) and in the hTERT-immortalized retinal pigment epithelial cell-line, (RPE-1) transfected with small interfering RNA (siRNA) against the BBS genes. (A) IFM analysis of primary cilia. Primary cilia were labeled with anti-ARL13B antibody (green). Nuclei were visualized with DAPI staining (blue). Controls (Ctrl, here CtrlD) are also shown. Scale bars 10 µM. (B) Percentage of patient fibroblasts with cilia. Compared to percentage of ciliated cells in a pool of control fibroblasts (Ctrl.pool = CtrL.A + Ctrl.D + Ctrl.E; 92.60%, n = 798 cells), the percentage of ciliated cells was significantly lower in BBS5−/−(B) (79.54%, n = 308 cells, *** p =5.13 × 10⁻¹⁰), BBS10−/−(A) (89.16%, n = 369 cells, * p = 0.0494) and BBS10−/−(B) (85.78%, n = 225 cells, ** p = 0.0015) fibroblasts. No significant differences were observed for BBS1−/− (94.98%, n = 239, p = 0.202) and BBS5−/−(A) (92.77%, n = 249, p = 0.9301) compared to the pool of control fibroblasts. There was a significant difference in percentage of ciliated cells between the three controls (Ctrl). The percentage was significantly lower in Ctrl.D (89.18%, n = 305 cells) compared with Ctrl.A (95.72%, n = 234 cells; Ctrl.D/Ctrl.A: * p = 0.0054) and Ctrl.E (93.82%, n = 259 cells; Ctrl.D/Ctrl.E: * p = 0.037). No significant difference was observed between CtrlA and CtrlE (CtrlA/CtrlE: p = 0.34). (C) Percentage of siBBS RNA-treated RPE1 cells with cilia. The cilia were labeled with anti ARL13B antibody and nuclei were visualized with DAPI staining. For siRNA efficacy, see Supplementary Figure S1. Compared to percentage of ciliated cells in siSCR transfected RPE1 cells (86.81%, n = 379 cells), the percentage of ciliated cells were significantly decreased in RPE1 cells transfected with siBBS5 (60.20%, n = 294 cells, *** p = 2.2802 × 10⁻¹⁵) and siBBS10 (76.40%, n = 322 cells, *** p = 0.000347). No significant differences compared to siSCR transfected cells were obtained for siBBS1 (84.49%, n = 361 cells, p = 0.36789). (D) Quantification of primary cilia length in patient fibroblasts. No significant difference was obtained by comparing the three control fibroblasts lines (Ctrl.A, n = 224 cells; Ctrl.D, n = 270 cells; Ctrl.E n = 243 cells. Ctrl.A/Ctrl.D: p = 0.0918; Ctrl.A/Ctrl.E: p = 0.675; Ctrl.D/Ctrl.E: p = 0.207). A pool of all the controls (n = 737 cells) was used for comparison with the five BBS patient fibroblasts lines. Compared to the controls, BBS1−/− (n = 222, p = 3.77 × 10⁻¹¹) had significantly shorter cilia, whereas BBS5−/−(A) (n = 228, *** p = 1.83 × 10⁻¹³), BBS5−/−(B) (n = 242, *** p = 8.77 × 10⁻⁸), BBS10−/−(A) (n = 333, *** p = 2.00×10⁻¹⁶) and BBS10−/−(B) (n = 202, * p = 0.0165) all had significantly longer cilia. (E) Cilia length variation visualized as a boxplot of (C) showing the length variation for all cell-lines. Compared to control cell-lines, BBS5−/−(A), BBS5−/−(B) and BBS10−/−(A) had broader length distributions. (F) Quantification of primary cilia length in siBBS-treated RPE1 cells. The cilia length was significant shorter in RPE1 cells treated with siBBS1 (n = 361, *** p = 2.29 × 10⁻⁸), and siBBS10 (n = 322, *** p = 3.54 × 10⁻¹⁹) compared to siSCR-treated control RPE cells, whereas no significant difference was observed between siBBS5- (n = 294, p = 0.21) and siSCR-treated cells (n = 329). SiBBS transfection led to a substantial reduction in expression of the BBS genes (Supplementary Figure S1). In (B,C), the number of cells (n) investigated consist of pooled data from three separate experiments and significance was determined using the χ2-test. In (D,F), the number of cilia (n) measured consist of pooled data from three separate experiments. p-values and significance were determined using Student’s t-test, two-tailed. Significance levels p < 0.05, * p < 0.05, and *** p < 0.0005 were used. Error bars represent the standard deviation.
Figure 2
Figure 2
Investigation of Hedgehog (Hh) signaling in control and BBS-defective cells. (A) Investigation of Hh signaling fibroblast. Expression profile of GLI1 mRNA was normalized to the amount of endogenous GADPH mRNA. Pur-induced expression of GLI1 was significantly increased in control cells compared to patient fibroblasts (BBS1−/−: * p = 0.015711, BBS5A−/−: * p = 0.012758, BBS5B−/−: * p = 0.014811, BBS10A−/−: * p = 0.014944, BBS10B−/−: * p = 0.013701). Compared to unstimulated cells, a significant increase in GLI1 expression as an effect of pur stimulation was observed in the control (Ctrl), BBS1−/− and BBS10A−/− fibroblasts (Ctrl: ** p = 0.001787, BBS1−/−: * p = 0.047977, BBS10A−/− = * p = 0.039275) but not in the other cell types (BBS5A−/−: p = 0.148291, BBS5B−/−: p = 0.232452, BBS10B−/−: p = 0.098018). (B) Investigation of Hh signaling in siRNA transfected RPE1 cells. Expression profile of GLI1 was normalized to the amount of endogenous GADPH. Cells transfected with siSCR showed a significant increase in GLI1 expression after pur stimulation (siSCR * p = 0.038869). The increase in siBBS1 and siBBS10 transfected cells was smaller, but still significant, compared to unstimulated cells (siBBS1: * p = 0.020942, siBBS10: * p = 0.046011). No significant effect was observed in siBBS5 transfected cells (siBBS5: p = 0.323142). SiRNA transfection led to a substantial reduction in expression of the BBS genes (Supplementary Figure S1). (C) Ciliary localization of SMO in fibroblast lines. The cells were labeled with anti-AC-TUB (cilia marker, red) and anti-SMO antibody (green). Nuclei were visualized with DAPI staining (blue). Scale bars 10 µM. Arrows indicate ciliary localization. In contrast to control fibroblasts, SMO was observed in a large number of cilia in all the BBS patient fibroblasts. In the control cells, SMO was only observed in a large number of cilia after pur stimulation (Supplementary Figure S2). (D) Quantification of cilia with SMO. The fibroblasts were grown under serum-reduced conditions (0.05% FCS) for 48 h in the presence or absence of 5 µM pur for the final 24 h, as indicated. SMO was present in a large number of the cilia in all BBS patient fibroblasts, both in the presence and the absence of pur. Significantly more SMO was present in the BBS fibroblast cells compared to a pool of control cells (Ctrl.pool: Ctrl.A + Ctrl.D, n = 315) in the absence of pur (BBS1−/−: *** p = 1.28 × 10⁻¹², n = 156, BBS5A−/−: *** p = 2.76 × 10⁻⁸, n = 145, BBS5B−/−: *** p = 6.95 × 10⁻⁵, n = 136, BBS10A−/−: *** p = 2.26 × 10⁻⁵, n = 134, and BBS10B−/−: *** p = 0.00014, n = 141). The control cells had a significant increase in ciliary SMO localization after pur stimulation (*** p = 4.58 × 10⁻⁹, n = 349/426). All BBS fibroblasts showed a significantly higher basal level of ciliary SMO that only increased significantly in BBS10A after pur stimulation (BBS1−/−: p = 0.960, n = 222, BBS5A−/−: p = 0.371, n = 228, BBS5B−/−: p = 0.802, n = 242, BBS10A−/−: * p = 0.045, n = 333, BBS10B−/−: p = 0.219, n = 202). All included data were pooled from three independent experiments (n = 3). In (A,B), Student’s t-test, one-tailed, with p < 0.05 significance level was performed. In (D), the χ2-test was performed with significance levels * p < 0.05, and *** p < 0.0005. Error bars represent the standard deviation.
Figure 3
Figure 3
Immuno-fluorescence microscopy (IFM) analysis of BBS-induced pluripotent stem cells (iPSCs) after spontaneous differentiation towards the three germ layers. IFM performed after three weeks of spontaneous differentiation. The cells were labelled with anti-α-smooth muscle actin (SMA; mesoderm marker), anti-α-fetoprotein (AFP; endodermal marker) and anti-βIII-tubulin (βTUB; ectoderm marker). All the 5 different iPSC clones (BBS1−/− iPSC-cl.10, BBS5−/− iPSC-cl.3A, BBS5−/− iPSC-cl.4A, BBS5−/− iPSC-cl.5A and BBS10−/− iPSC-cl.l1A) generated from BBS fibroblast were able to spontaneously differentiate into cells of all three germ layers (scalebar 100 µm).
Figure 4
Figure 4
Differentiation of BBS1-iPSC into RPE-like cells. Control K3 iPSC and BBS1−/− iPCS were analyzed for RPE phenotype, after differentiation for 110 days (end of P2). (A) IFM after incubation with antibodies against ZO-1 (tight junction marker) and ARL13B (Cilia marker). Nuclei were visualized with 4′,6-diamidino-2-phenylindole (DAPI) staining (Panels 1 and 2), scale bar 25 µM. Phase contrast pictures (Panel 3), scale bar 200 µM. Bright-field images (Panel 4), scale bar 200 µM. Both control K3 iPSC and BBS1−/− iPCS were able to form tight junctions (Panel 1) and primary cilia (Panel 2). The cells had obtained the characteristic cobblestone morphology of RPE cells (Panel 3). Both cell-lines became pigmented (Panel 4). (B) Gene Expression. mRNA was isolated at different time points during the differentiation process and quantitative Polymerase Chain Reaction (qPCR) was performed. mRNA was isolated at day 0 (iPSC clone), day 14 after initiation of differentiation (d14) and at the end of the three passages, P0, P1 and P2. Expression profile of PAX6 (retinal precursor marker), BEST1 (mature RPE marker) and RPE65 (mature RPE marker) was normalized to the expression of the endogenous TBP gene encoding the TATA-box binding protein. Data derived from one experiment (technical triplicates); no statistics performed.

References

    1. Weihbrecht K., Goar W.A., Pak T., Garrison J.E., DeLuca A.P., Stone E.M., Scheertz T.E., Sheffield V.C. Keeping an Eye on Bardet-Biedl Syndrome: A Comprehensive Review of the Role of Bardet-Biedl Syndrome Genes in the Eye. Med. Res. Arch. 2017;5:9. doi: 10.18103/mra.v5i9.1526. - DOI - PMC - PubMed
    1. Hjortshøj T.D., Grønskov K., Philip A.R., Nishimura D.Y., Riise R., Sheffield V.C., Rosenberg T., Brøndum-Nielsen K. Bardet-Biedl syndrome in Denmark-report of 13 novel sequence variations in six genes. Hum. Mutat. 2010;31:429–436. doi: 10.1002/humu.21204. - DOI - PubMed
    1. Forsythe E., Beales P.L. Bardet-Biedl syndrome. Eur. J. Hum. Genet. 2013;21:8–13. doi: 10.1038/ejhg.2012.115. - DOI - PMC - PubMed
    1. Heon E., Kim G., Qin S., Garrison J.E., Tavares E., Vincent A., Nuangchamnong N., Scott C.A., Slusarski D.C., Sheffield V.C. Mutations in C8ORF37 cause Bardet Biedl syndrome (BBS21) Hum. Mol. Genet. 2016;25:2283–2294. doi: 10.1093/hmg/ddw096. - DOI - PMC - PubMed
    1. Schaefer E., Stoetzel C., Scheidecker S., Geoffroy V., Prasad M.K., Redin C., Missotte I., Lacombe D., Mandel J.L., Muller J., et al. Identification of a novel mutation confirms the implication of IFT172 (BBS20) in Bardet–Biedl syndrome. J. Hum. Genet. 2016;61:447–450. doi: 10.1038/jhg.2015.162. - DOI - PubMed

MeSH terms

LinkOut - more resources