. 2021 Jan 30;22(3):1378.
doi: 10.3390/ijms22031378.

Impairment of Spike-Timing-Dependent Plasticity at Schaffer Collateral-CA1 Synapses in Adult APP/PS1 Mice Depends on Proximity of Aβ Plaques

Affiliations

Impairment of Spike-Timing-Dependent Plasticity at Schaffer Collateral-CA1 Synapses in Adult APP/PS1 Mice Depends on Proximity of Aβ Plaques

Machhindra Garad et al. Int J Mol Sci. .

Abstract

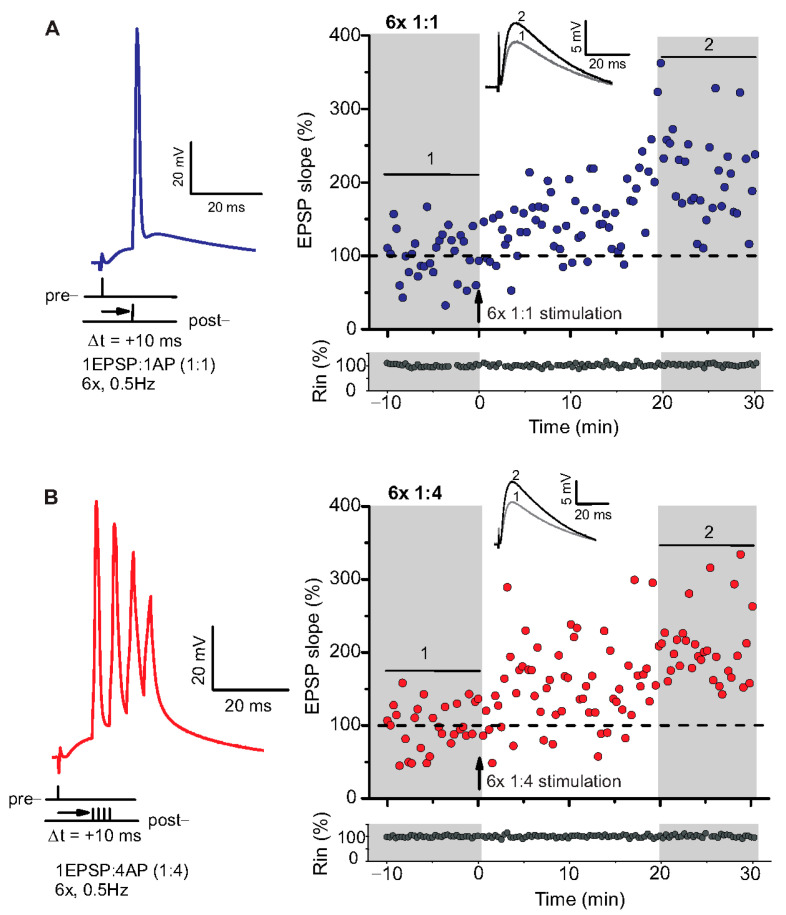
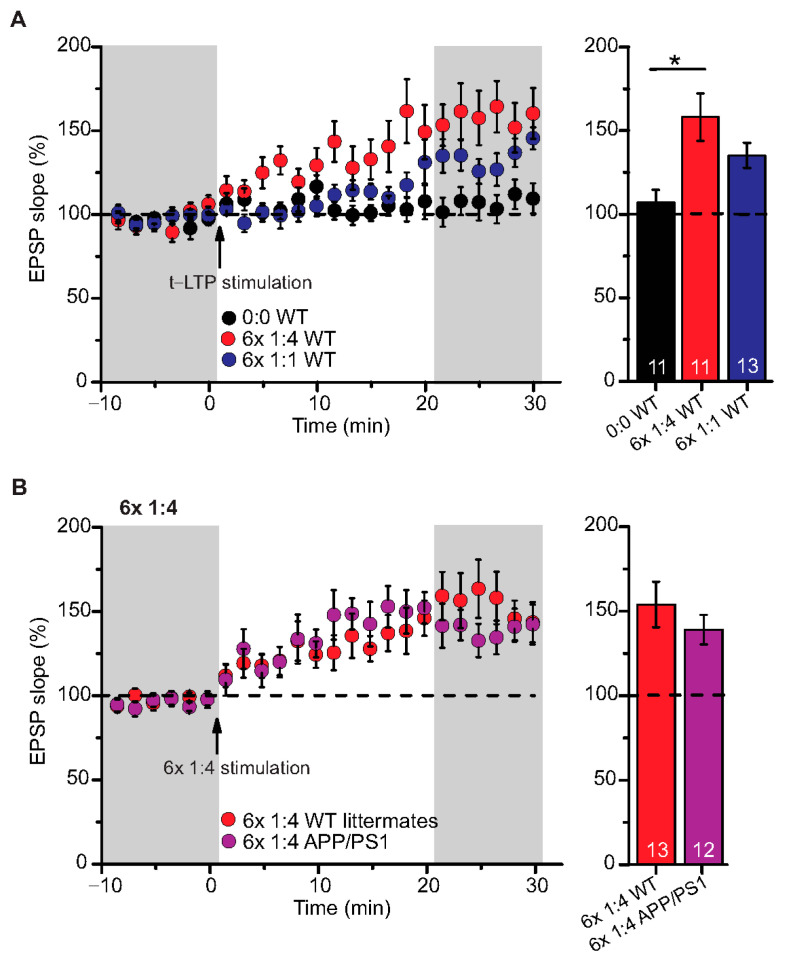
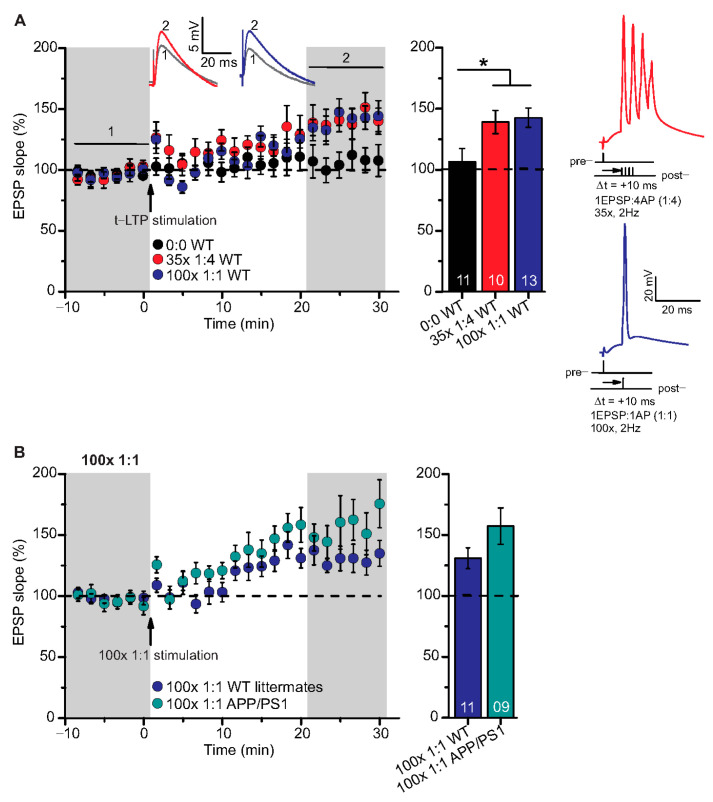
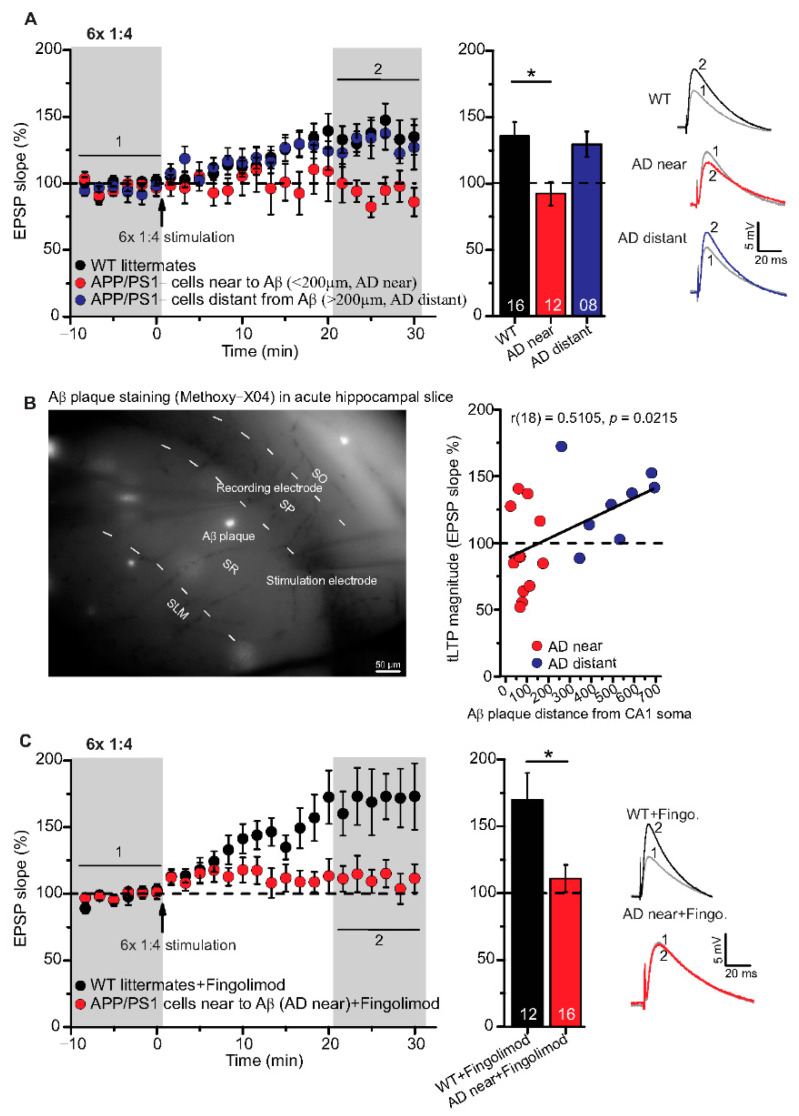
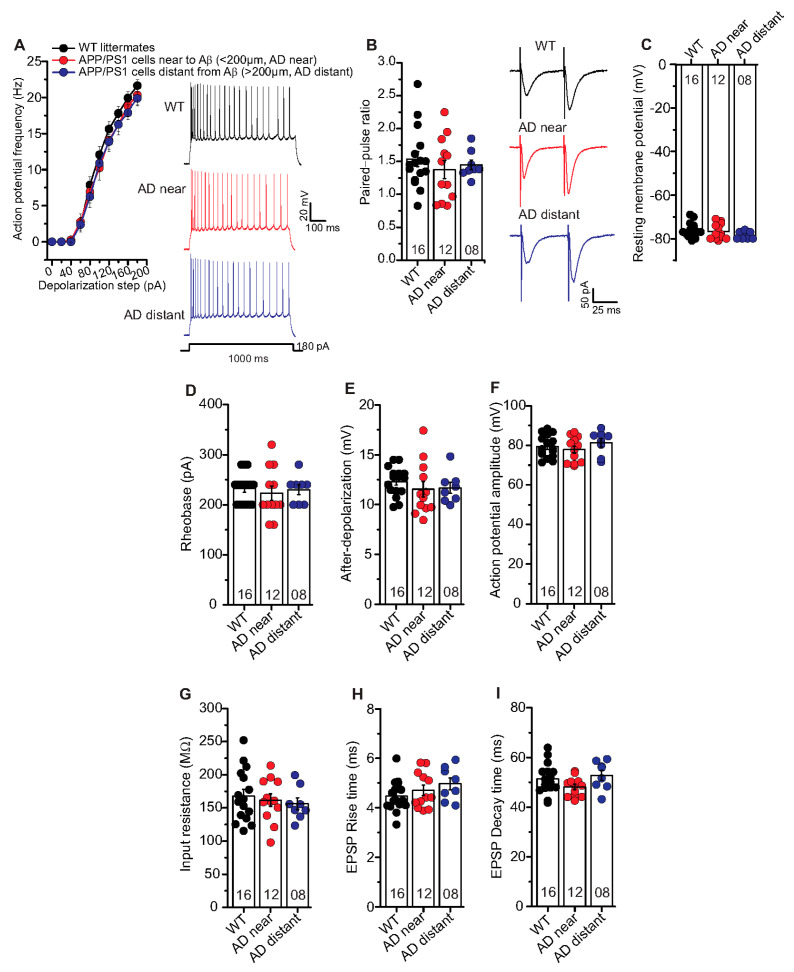
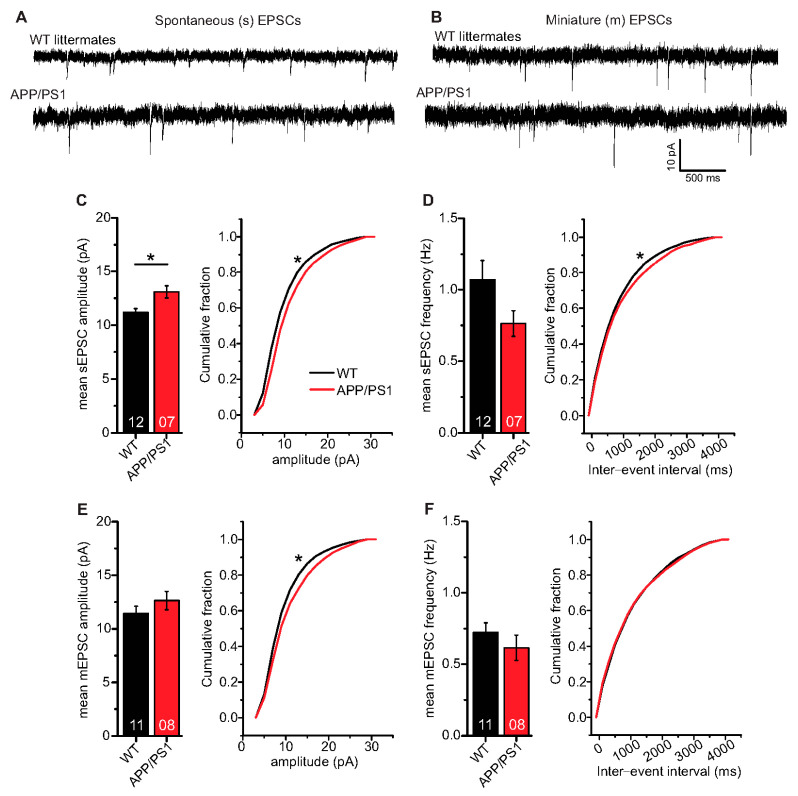
Alzheimer's disease (AD) is a multifaceted neurodegenerative disorder characterized by progressive and irreversible cognitive decline, with no disease-modifying therapy until today. Spike timing-dependent plasticity (STDP) is a Hebbian form of synaptic plasticity, and a strong candidate to underlie learning and memory at the single neuron level. Although several studies reported impaired long-term potentiation (LTP) in the hippocampus in AD mouse models, the impact of amyloid-β (Aβ) pathology on STDP in the hippocampus is not known. Using whole cell patch clamp recordings in CA1 pyramidal neurons of acute transversal hippocampal slices, we investigated timing-dependent (t-) LTP induced by STDP paradigms at Schaffer collateral (SC)-CA1 synapses in slices of 6-month-old adult APP/PS1 AD model mice. Our results show that t-LTP can be induced even in fully developed adult mice with different and even low repeat STDP paradigms. Further, adult APP/PS1 mice displayed intact t-LTP induced by 1 presynaptic EPSP paired with 4 postsynaptic APs (6× 1:4) or 1 presynaptic EPSP paired with 1 postsynaptic AP (100× 1:1) STDP paradigms when the position of Aβ plaques relative to recorded CA1 neurons in the slice were not considered. However, when Aβ plaques were live stained with the fluorescent dye methoxy-X04, we observed that in CA1 neurons with their somata <200 µm away from the border of the nearest Aβ plaque, t-LTP induced by 6× 1:4 stimulation was significantly impaired, while t-LTP was unaltered in CA1 neurons >200 µm away from plaques. Treatment of APP/PS1 mice with the anti-inflammatory drug fingolimod that we previously showed to alleviate synaptic deficits in this AD mouse model did not rescue the impaired t-LTP. Our data reveal that overexpression of APP and PS1 mutations in AD model mice disrupts t-LTP in an Aβ plaque distance-dependent manner, but cannot be improved by fingolimod (FTY720) that has been shown to rescue conventional LTP in CA1 of APP/PS1 mice.

Keywords: Alzheimer; FTY720; Schaffer collateral-CA1 synapses; adult animals; amyloid beta plaques; fingolimod; timing-dependent LTP.


Conflict of interest statement

The authors declare no conflict of interest.

Figures

Figure 1
Figure 1
Spike timing-dependent LTP (t-LTP) can be induced with distinct low repeat spike timing-dependent plasticity (STDP) paradigms in 6-month-old adult mice. Whole cell patch clamp recordings (in current clamp) of timing-dependent LTP at SC-CA1 synapses of hippocampal slices from wild type mice. (A) One presynaptic EPSP paired with 1 postsynaptic action potential (AP, 6× 1:1, left inset) STDP paradigm used to induce canonical t-LTP. Typical recording from an individual cell for 6× 1:1 stimulation (indicated by arrow) induced t-LTP at SC-CA1 synapses. (B) One presynaptic EPSP paired with 4 postsynaptic APs (6× 1:4 protocol, left inset) STDP paradigm used to induce burst t-LTP. Typical recording from an individual cell for 6× 1:4 stimulation (indicated by arrow) induced t-LTP at the hippocampal SC-CA1 synapses. Insets: average EPSP before (1) and after t-LTP induction (2). Scale bars are shown in the respective insets.
Figure 2
Figure 2
Intact t-LTP in adult APP/PS1 mice induced by 6× 1:4 STDP paradigm. Whole cell patch clamp recording of t-LTP in acute hippocampal slices from 6-month-old wild type and APP/PS1 mice using the STDP paradigms described in Figure 1. Left: Mean time-course of EPSP slopes with either of the two different STDP paradigms (indicated by arrows). Right: Averaged change in EPSP slopes 21–30 min following t-LTP induction normalized to control before t-LTP induction. (A) WT mice expressed significant t-LTP induced by 6 × 1:4 stimulation (red circles, n = 11/N = 8; p = 0.003), while the 6× 1:1 stimulation induced synaptic change did not yield statistically significant t-LTP (blue circles, n = 13/N = 10; p = 0.104) compared to unpaired control (black circles, n = 11/N = 10). (B) Hippocampal SC-CA1 synapses in APP/PS1 animals showed unaltered t-LTP (purple circles, n = 12/N = 6; p = 0.354), induced by 6× 1:4 stimulation, compared to WT littermate mice (red circles, n = 13/N = 7). Data shown as mean ± SEM. Digits in the bars represent the number of recorded neurons per condition. *: p < 0.05, multiple comparisons were performed with ANOVA followed by post hoc Dunnett’s test (A) and non-parametric data were compared with Mann–Whitney U-test (B).
Figure 3
Figure 3
High repeat STDP stimulation paradigm induced t-LTP in adult wild type and APP/PS1 mice. Whole cell patch clamp recordings of t-LTP as described in Figure 2. Left: mean time course for EPSP slopes with either of the two different STDP paradigms (indicated by arrows). Right: Averaged changes in EPSP slopes 21–30 min following t-LTP induction normalized to control before t-LTP induction. (A) Insets: average EPSP before (1) and after t-LTP induction (2). 35× 1:4 (red circles, n = 10/N = 10; p = 0.04) and 100× 1:1 stimulation (blue circles, n = 13/N = 12; p = 0.02) induced significant t-LTP in WT mice in comparison to unpaired control (0:0; black circles, n = 11/N = 7). Insets: 35× 1:4 (red color) and 100× 1:1 (blue color) STDP paradigms at 2 Hz. (B) 100× 1:1 stimulation induced comparable t-LTP in APP/PS1 mice (cyan circles, n = 9/N = 5; p = 0.126) and WT littermates (blue circles, n = 11/N = 5). Scale bars are shown in the respective insets. Data shown as mean ± SEM. Digits in the bars indicate the number of recorded neurons per condition. *: p < 0.05, multiple comparisons were performed with ANOVA followed by post hoc Dunnett’s test (A) and parametric data were compared with two-tailed Student’s t-test (B).
Figure 4
Figure 4
Impairment of t-LTP in adult APP/PS1 mice depends on proximity of recorded CA1 neuron to Aβ plaques. Whole cell patch clamp recording of t-LTP in acute hippocampal slices as described in Figure 2. Left: Mean time-course of EPSP slopes for 6× 1:4 paradigm (indicated by arrow). Right: Averaged change in EPSP slopes 21–30 min following t-LTP induction normalized to control before t-LTP induction. (A) APP/PS1 mice showed impaired t-LTP in CA1 neurons near to Aβ plaques (<200 µm, AD near, red circles, n = 12/N = 9; vs. WT: p = 0.009), while in CA1 neurons distant from Aβ plaques (>200 µm, AD distant, blue circles, n = 8/N = 4; vs WT: p = 0.92), t-LTP magnitude was comparable to WT littermate mice (black circles, n = 16/N = 9). (B) Methoxy-X04 staining of Aβ plaques in acute hippocampal slices. APP/PS1 mice showed moderate positive correlation between CA1 cell soma distance from Aβ plaque and t-LTP magnitude (Pearson correlation coefficient r(18) = 0.5105; p = 0.02). (C) No rescue of impaired t-LTP in APP/PS1 mouse CA1 neurons near to plaques after chronic fingolimod (FTY720) treatment (red circles, n = 16/N = 7; p = 0.01), compared to fingolimod treated WT littermates (black circles, n = 12/N = 7). Data are shown as mean ± SEM. Insets: average EPSP before (1) and after t-LTP induction (2). Digits in the bars indicate the number of recorded neurons per condition. *: p < 0.05, multiple comparisons were performed with ANOVA followed by post hoc Tukey’s test (A), while non-parametric data were compared with Mann–Whitney U-test (C). Aβ: amyloid-beta, SO: stratum (S) oriens, SP: S. pyramidale, SR: S. radiatum, SLM: S. lacunosum moleculare.
Figure 5
Figure 5
Unaltered basal electrical and synaptic properties of CA1 pyramidal neurons in the vicinity of Aβ plaques in APP/PS1 mice. Whole cell patch clamp recordings (current clamp except for paired-pulse facilitation recorded in voltage clamp) from CA1 neurons in acute hippocampal slices near to Aβ plaques in APP/PS1 mice (<200 µm, AD near, red circles), CA1 cells distant from Aβ plaques in APP/PS1 mice (>200 µm, AD distant, blue circles), and CA1 neurons from WT littermates (black circles). (A) The AD near and AD distant groups showed similar intrinsic excitability compared to age-matched WT littermate mice (ANOVA; p = 0.07). Insets: action potentials (APs) firing in CA1 neurons in response to 180 pA (for 1000 ms) somatic current injection from WT, AD near and AD distant groups. (B) Paired-pulse ratio (PPR) at SC-CA1 synapses in AD near and AD distant group was similar to PPR in WT littermates (p = 0.62). Insets: PPR at inter-stimulus interval of 50 ms in CA1 pyramidal cells from WT, AD near and AD distant groups. Hippocampal CA1 neurons from AD near, AD distant group showed similar resting membrane potentials ((C); p = 0.26), rheobases ((D); p = 0.81), AP amplitudes ((E); p = 0.45), after-depolarizations ((F); p = 0.55), input resistances ((G); p = 0.73), EPSP rise times ((H); p = 0.23), and EPSP decay times ((I); p = 0.14) compared to WT littermates. Digits in the bars represent the number of recorded neurons per condition, at least from three different animals per group. Data displayed as mean ± SEM. Multiple comparisons were performed with ANOVA.
Figure 6
Figure 6
Spontaneous and miniature excitatory synaptic transmission in CA1 neurons of 6-month-old adult APP/PS1 mice. Whole cell patch clamp recordings (voltage clamp) of synaptic currents from CA1 neurons in acute hippocampal slices. APP/PS1 mice specified by red symbols, WT littermate mice represented by black symbols. (A,B) spontaneous (s) and miniature (m) EPSCs in acute hippocampal slices from WT littermate and APP/PS1 mice, respectively. (C) APP/PS1 mice showed significantly higher mean sEPSC amplitudes (p = 0.008). Moreover, APP/PS1 mice showed significantly different cumulative sEPSC amplitude distribution (p < 0.0001). (D) CA1 neurons from APP/PS1 animals displayed comparable mean sEPSC frequencies as WT littermate animals (p = 0.11). However, APP/PS1 and WT mice expressed significantly different distribution of sEPSC inter-event intervals (IEIs; p = 0.005). (E) CA1 neurons from both WT littermate and APP/PS1 mice showed similar mean mEPSC amplitudes (p = 0.28), but significantly different cumulative mEPSC amplitude distributions (p < 0.0001). (F) CA1 neurons from APP/PS1 animals displayed similar mean mEPSC frequencies (p = 0.25) and mEPSC IEI distribution as WT littermates (p = 0.52). Digits in the bars show the number of recorded neurons per condition, at least from three different animals per group. Data shown as mean ± SEM. *: p < 0.05, statistical analyses were performed with two-tailed Student’s t-test (parametric data) and Mann–Whitney U-test (non-parametric data). Cumulative frequency distributions were analyzed with Kolmogorov–Smirnov test.

Similar articles

Cited by

References

    1. Alzheimer’s Association Report, 2020 Alzheimer’s disease facts and figures. Alzheimer Dement. 2020;16:391–460. doi: 10.1002/alz.12068. - DOI - PubMed
    1. Furcila D., DeFelipe J., Alonso-Nanclares L. A Study of Amyloid-β and Phosphotau in Plaques and Neurons in the Hippocampus of Alzheimer’s Disease Patients. J. Alzheimer Dis. 2018;64:417–435. doi: 10.3233/JAD-180173. - DOI - PMC - PubMed
    1. Goedert M., Wischik C.M., Crowther R.A., Walker J.E., Klug A. Cloning and sequencing of the cDNA encoding a core protein of the paired helical filament of Alzheimer disease: Identification as the microtubule-associated protein tau. Proc. Natl. Acad. Sci. USA. 1988;85:4051–4055. doi: 10.1073/pnas.85.11.4051. - DOI - PMC - PubMed
    1. Grundke-Iqbal I., Iqbal K., Tung Y.C. Abnormal phosphorylation of the microtubule-associated protein τ (tau) in Alzheimer cytoskeletal pathology. Proc. Natl. Acad. Sci. USA. 1986;83:44913–44917. doi: 10.1073/pnas.83.13.4913. - DOI - PMC - PubMed
    1. Querfurth H.W., Laferla F.M. Mechanisms of Disease: Alzheimer’s Disease. N. Engl. J. Med. 2010;362:329–373. doi: 10.1056/NEJMra0909142. - DOI - PubMed

MeSH terms