. 2021 Jan 30;10(3):490.
doi: 10.3390/jcm10030490.

Nerve Fibers in the Tumor Microenvironment Are Co-Localized with Lymphoid Aggregates in Pancreatic Cancer

Affiliations

Nerve Fibers in the Tumor Microenvironment Are Co-Localized with Lymphoid Aggregates in Pancreatic Cancer

Lara R Heij et al. J Clin Med. .

Abstract

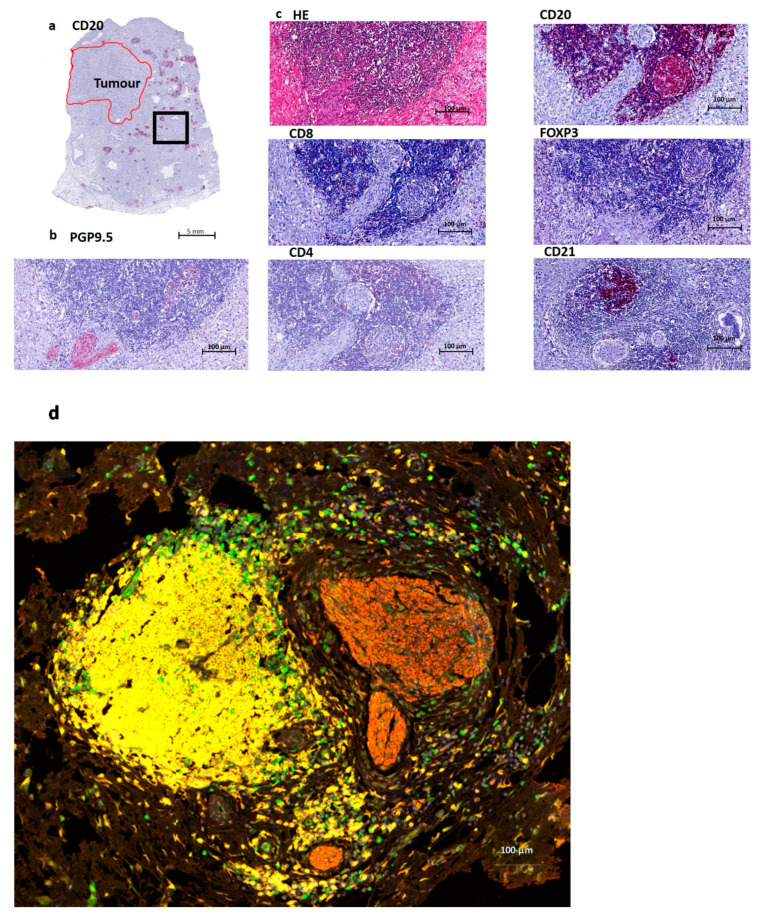
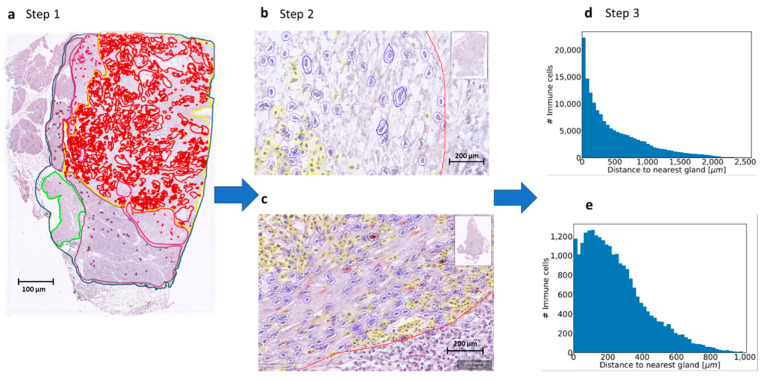
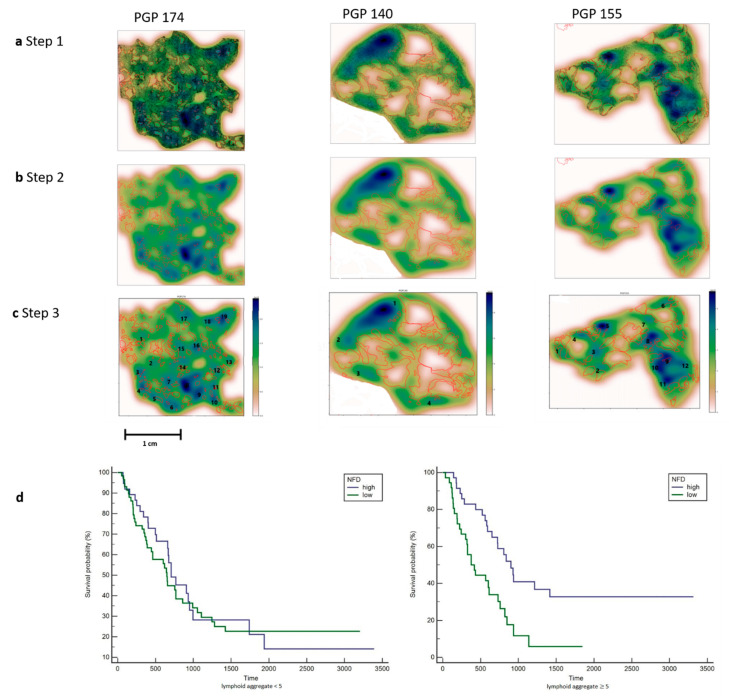
B cells and tertiary lymphoid structures (TLS) are reported to be important in survival in cancer. Pancreatic Cancer (PDAC) is one of the most lethal cancer types, and currently, it is the seventh leading cause of cancer-related death worldwide. A better understanding of tumor biology is pivotal to improve clinical outcome. The desmoplastic stroma is a complex system in which crosstalk takes place between cancer-associated fibroblasts, immune cells and cancer cells. Indirect and direct cellular interactions within the tumor microenvironment (TME) drive key processes such as tumor progression, metastasis formation and treatment resistance. In order to understand the aggressiveness of PDAC and its resistance to therapeutics, the TME needs to be further unraveled. There are some limited data about the influence of nerve fibers on cancer progression. Here we show that small nerve fibers are located at lymphoid aggregates in PDAC. This unravels future pathways and has potential to improve clinical outcome by a rational development of new therapeutic strategies.

Keywords: machine learning; nerve fiber density; pancreatic cancer; spatial arrangements; tertiary lymphoid structures; tumor microenvironment.


Conflict of interest statement

X.T. was funded by China Scholarship Council (CSC Grant No:201806210074). All other authors have nothing to disclose.”

Figures

Figure 1
Figure 1
Overview of a tertiary lymphoid structure (TLS) in Pancreatic Cancer. (a). Overview of a CD20 staining (B cells) in a Pancreatic Ductal Adenocarcinoma (PDAC) patient. The red annotated area indicates the tumor region, and the black box indicates the area of magnification for Figure 1b–d. (b). Nerve fiber staining PGP9.5, which is a pan-neuronal marker. This image shows the presence of nerve fibers at the edge of a lymphoid aggregate. (c). Routine HE staining containing B cells (CD20), T cells (here mostly CD8 and CD4) and follicular dendritic cells (CD21). Treg cells (FOXP3) are mostly absent, just as CD4 in this image. CD8 shows a few positive cells at the border of this structure. (d) Multiplex imaging: T cells (FOXP3 green), B cells (CD20 yellow), Nerves (PGP9.5 red) and nucleus (DAPI blue).
Figure 2
Figure 2
Process using machine learning to determine immune cell spatiality. (a). Step 1. Defining the Region of Interest (ROI) (yellow line). Every scanned slide was annotated in: total tissue (dark blue), normal pancreas (purple), atrophic pancreas (pink), normal duodenum (green) and tumor (red). For the machine learning classifier, a Region of Interest (ROI) was also annotated (yellow). In this area, only the cell detection classifier was used to detect the stromal cells in fibroblasts and immune cells. (b,c). Step 2. The cell classifier was trained by the pathologist to recognize fibroblasts (blue annotations) and immune cells (yellow annotations). The tumor glands were all annotated manually gland by gland and are shown in red annotation. (d,e). Step 3. Measurement of distance of immune cell to tumor gland. From each slide, a plot was made with the number of immune cells (y-axis) and the distance to the nearest tumor gland (x-axis). These plots were used to measure the mean distance from the immune cell to the tumor gland in micrometers. Some slides showed immune cells at a greater distance from the tumor and some slides showed immune cells nearby the tumor. With this technique, we could identify immune cell aggregates, so groups of immune cells were located close to each other.
Figure 3
Figure 3
Counting the number of lymphoid aggregates in patients with Pancreatic Cancer. (a). Step 1. All immune cells are plotted using the x and y coordinates. Tumor glands are annotated in red. Three patients are shown with a different distribution pattern of the immune cells. PGP 174 is immune-cell-rich and shows aggregates at the edge and in between the tumor glands. PGP 140 only shows a few immune cell aggregates at the edge of the tumor. PGP 155 shows a few immune cell aggregates mainly located at the edge of the tumor. (b). Step 2. A heat map was created by using a 2D Kernel Density. The color blue was used because of the already red annotations for tumor glands. Dark blue areas show a high density of immune cells. (c). Step 3. The heat map clusters with a dark blue and light blue color were interpreted as lymphoid aggregates and counted manually. Each number corresponds with a lymphoid aggregate, images with many lymphoid aggregates (PGP 174) and only few lymphoid aggregates (PGP140) are shown. (d). Left: Kaplan–Meier plot for patients with less than 5 lymphoid aggregates show no significance in survival. Right: Kaplan–Meier plot for patients with 5 or more Lymphoid Aggregates and a high NFD show a significantly better survival.

References

    1. Bray F., Ferlay J., Soerjomataram I., Siegel R.L., Torre L.A., Jemal A. Global cancer statistics 2018: GLOBOCAN estimates of incidence and mortality worldwide for 36 cancers in 185 countries. CA Cancer J. Clin. 2018;68:394–424. doi: 10.3322/caac.21492. - DOI - PubMed
    1. Chen D.S., Mellman I. Elements of cancer immunity and the cancer–immune set point. Nature. 2017;541:321–330. doi: 10.1038/nature21349. - DOI - PubMed
    1. Feig C., Jones J.O., Kraman M., Wells R.J.B., Deonarine A., Chan D.S., Connell C.M., Roberts E.W., Zhao Q., Caballero O.L., et al. Targeting CXCL12 from FAP-expressing carcinoma-associated fibroblasts synergizes with anti-PD-L1 immunotherapy in pancreatic cancer. Proc. Natl. Acad. Sci. USA. 2013;110:20212–20217. doi: 10.1073/pnas.1320318110. - DOI - PMC - PubMed
    1. Petitprez F., De Reyniès A., Keung E.Z., Chen T.W.-W., Sun C.-M., Calderaro J., Jeng Y.-M., Hsiao L.-P., Lacroix L., Bougoüin A., et al. B cells are associated with survival and immunotherapy response in sarcoma. Nature. 2020;577:556–560. doi: 10.1038/s41586-019-1906-8. - DOI - PubMed
    1. Helmink B.A., Reddy S.M., Gao J., Zhang S., Basar R., Thakur R., Yizhak K., Sade-Feldman M., Blando J., Han G., et al. B cells and tertiary lymphoid structures promote immunotherapy response. Nature. 2020;577:549–555. doi: 10.1038/s41586-019-1922-8. - DOI - PMC - PubMed

LinkOut - more resources