

T2 mapping of the peritumoral infiltration zone of glioblastoma and anaplastic astrocytoma
- PMID: 33573473
- PMCID: PMC8551439
- DOI: 10.1177/1971400921989325
T2 mapping of the peritumoral infiltration zone of glioblastoma and anaplastic astrocytoma
Abstract
Purpose: To characterise peritumoral zones in glioblastoma and anaplastic astrocytoma evaluating T2 values using T2 mapping sequences.
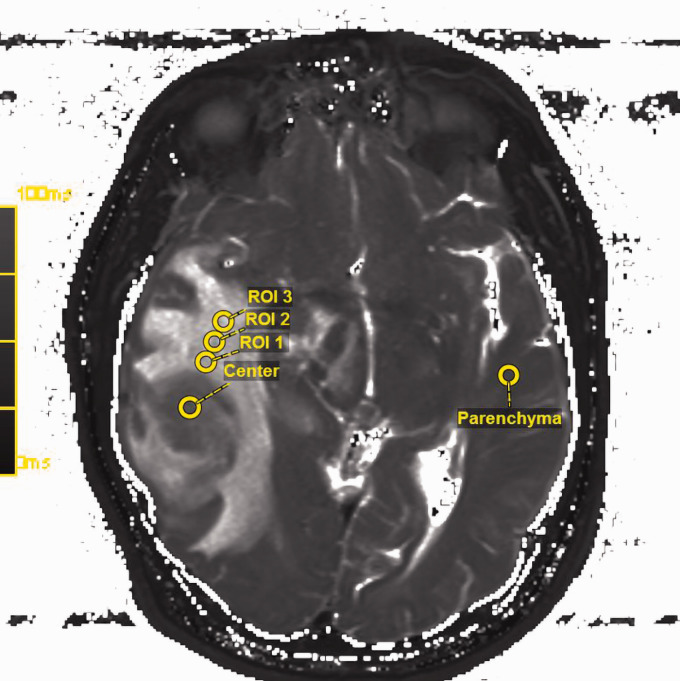
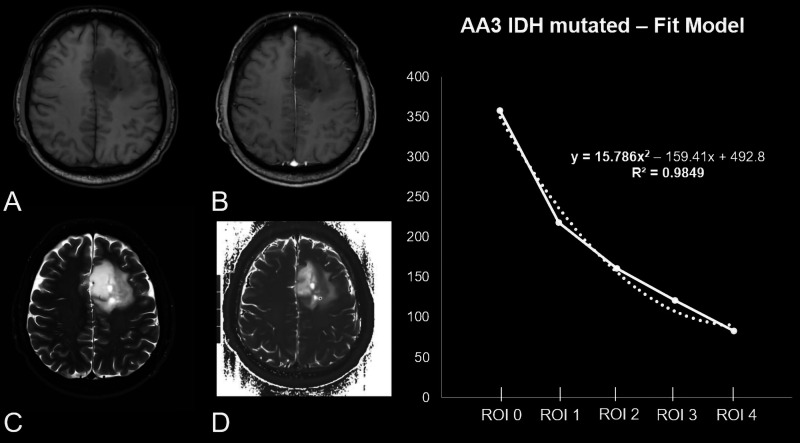
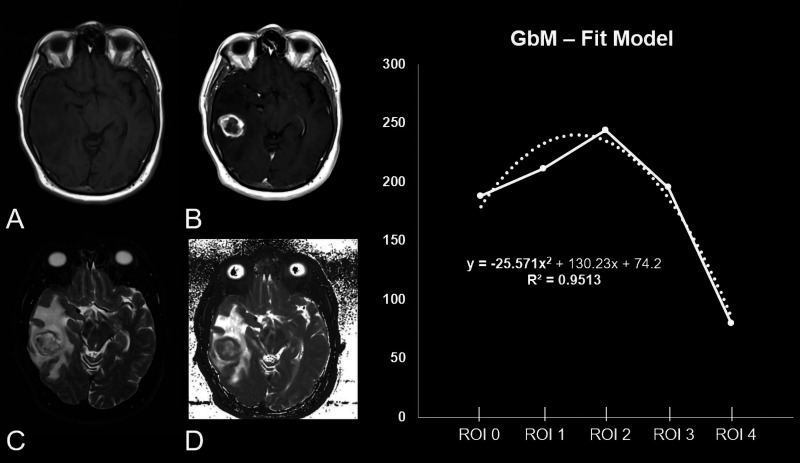
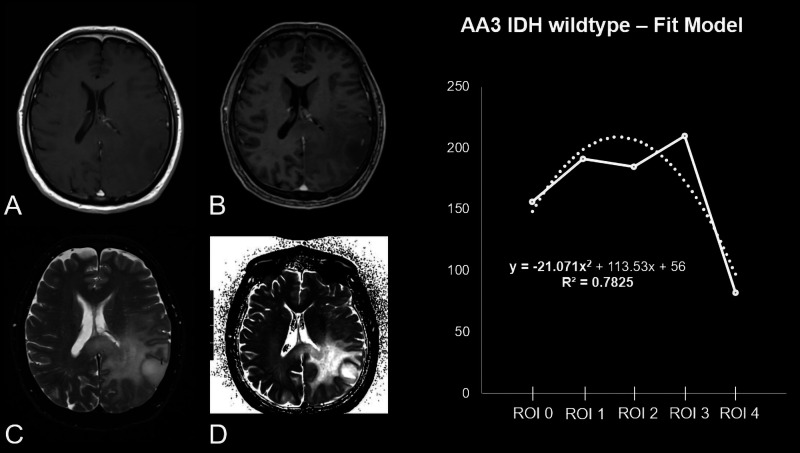
Materials and methods: In this study, 41 patients with histopathologically confirmed World Health Organization high grade gliomas and preoperative magnetic resonance imaging examinations were retrospectively identified and enrolled. High grade gliomas were differentiated: (a) by grade, glioblastoma versus anaplastic astrocytoma; and (b) by isocitrate dehydrogenase mutational state, mutated versus wildtype. T2 map relaxation times were assessed from the tumour centre to peritumoral zones by means of a region of interest and calculated pixelwise by using a fit model.
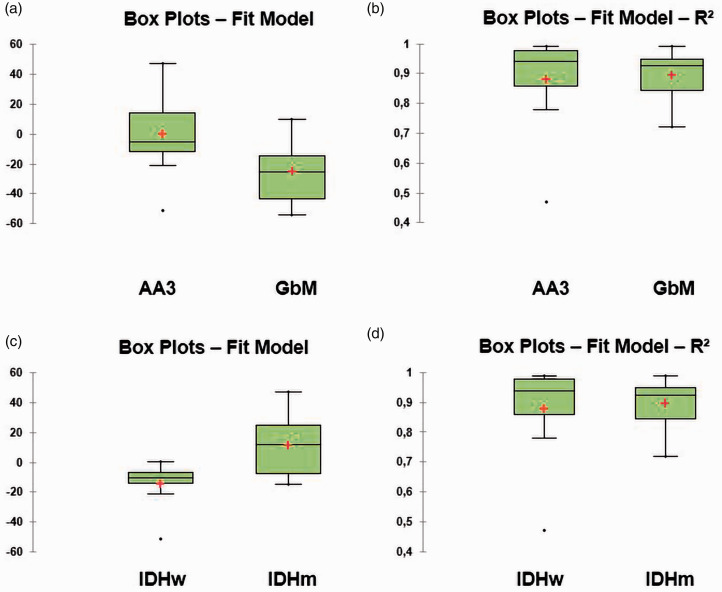
Results: Significant differences between T2 values evaluated from the tumour centre to the peritumoral zone were found between glioblastoma and anaplastic astrocytoma, showing a higher decrease in signal intensity (T2 value) from tumour centre to periphery for glioblastoma (P = 0.0049 - fit-model: glioblastoma -25.02± 19.89 (-54-10); anaplastic astrocytoma -5.57±22.94 (-51-47)). Similar results were found when the cohort was subdivided by their isocitrate dehydrogenase profile, showing an increased drawdown from tumour centre to periphery for wildtype in comparison to mutated isocitrate dehydrogenase (P = 0.0430 - fit model: isocitrate dehydrogenase wildtype -10.35±16.20 (-51) - 0; isocitrate dehydrogenase mutated 12.14±21.24 (-15-47)). A strong statistical proof for both subgroup analyses (P = 0.9987 - glioblastoma R2 0.93±0.08; anaplastic astrocytoma R2 0.94±0.15) was found.
Conclusion: Peritumoral T2 mapping relaxation time tissue behaviour of glioblastoma differs from anaplastic astrocytoma. Significant differences in T2 values, using T2 mapping relaxation time, were found between glioblastoma and anaplastic astrocytoma, capturing the tumour centre to the peritumoral zone. A similar curve progression from tumour centre to peritumoral zone was found for isocitrate dehydrogenase wildtype high grade gliomas in comparison to isocitrate dehydrogenase mutated high grade gliomas. This finding is in accordance with the biologically more aggressive behaviour of isocitrate dehydrogenase wildtype in comparison to isocitrate dehydrogenase mutated high grade gliomas. These results emphasize the potential of mapping techniques to reflect the tissue composition of high grade gliomas.
Keywords: Glioblastoma; MRI (magnetic resonance imaging); T2 mapping; glioma; multiparametric imaging.
Figures
References
-
- Wen PY, Kesari S. Malignant gliomas in adults. N Engl J Med 2008; 359: 492–507. - PubMed
-
- Smits M, van den Bent MJ. Imaging correlates of adult glioma genotypes. Radiology 2017; 284: 316–331. - PubMed
-
- Hegi ME, Diserens AC, Gorlia T, et al. MGMT gene silencing and benefit from temozolomide in glioblastoma. N Engl J Med 2005; 352: 997–1003. - PubMed
-
- Louis DN, Perry A, Reifenberger G, et al. The 2016 World Health Organization classification of tumors of the central nervous system: a summary. Acta Neuropathol 2016; 131: 803–820. - PubMed
MeSH terms
Substances
LinkOut - more resources
Full Text Sources
Other Literature Sources
Medical
