. 2021 Apr;99(4):294-307.
doi: 10.1124/molpharm.120.000217. Epub 2021 Feb 11.

Elevated cAMP Protects against Diclofenac-Induced Toxicity in Primary Rat Hepatocytes: A Protective Effect Mediated by the Exchange Protein Directly Activated by cAMP/cAMP-Regulated Guanine Nucleotide Exchange Factors

Affiliations

Elevated cAMP Protects against Diclofenac-Induced Toxicity in Primary Rat Hepatocytes: A Protective Effect Mediated by the Exchange Protein Directly Activated by cAMP/cAMP-Regulated Guanine Nucleotide Exchange Factors

Fabio Alejandro Aguilar Mora et al. Mol Pharmacol. 2021 Apr.

Abstract

Chronic consumption of the nonsteroidal anti-inflammatory drug diclofenac may induce drug-induced liver injury (DILI). The mechanism of diclofenac-induced liver injury is partially elucidated and involves mitochondrial damage. Elevated cAMP protects hepatocytes against bile acid-induced injury. However, it is unknown whether cAMP protects against DILI and, if so, which downstream targets of cAMP are implicated in the protective mechanism, including the classic protein kinase A (PKA) pathway or alternative pathways like the exchange protein directly activated by cAMP (EPAC). The aim of this study was to investigate whether cAMP and/or its downstream targets protect against diclofenac-induced injury in hepatocytes. Rat hepatocytes were exposed to 400 µmol/l diclofenac. Apoptosis and necrosis were measured by caspase-3 activity assay and Sytox green staining, respectively. Mitochondrial membrane potential (MMP) was measured by JC-10 staining. mRNA and protein expression were assessed by quantitative polymerase chain reaction (qPCR) and Western blot, respectively. The cAMP-elevating agent 7β-acetoxy-8,13-epoxy-1α,6β,9α-trihydroxylabd-14-en-11-one (forskolin), the pan-phosphodiesterase inhibitor IBMX, and EPAC inhibitors 5,7-dibromo-6-fluoro-3,4-dihydro-2-methyl-1(2H)-quinoline carboxaldehyde (CE3F4) and ESI-O5 were used to assess the role of cAMP and its effectors, PKA or EPAC. Diclofenac exposure induced apoptotic cell death and loss of MMP in hepatocytes. Both forskolin and IBMX prevented diclofenac-induced apoptosis. EPAC inhibition but not PKA inhibition abolished the protective effect of forskolin and IBMX. Forskolin and IBMX preserved the MMP, whereas both EPAC inhibitors diminished this effect. Both EPAC1 and EPAC2 were expressed in hepatocytes and localized in mitochondria. cAMP elevation protects hepatocytes against diclofenac-induced cell death, a process primarily involving EPACs. The cAMP/EPAC pathway may be a novel target for treatment of DILI. SIGNIFICANCE STATEMENT: This study shows two main highlights. First, elevated cAMP levels protect against diclofenac-induced apoptosis in primary hepatocytes via maintenance of mitochondrial integrity. In addition, this study proposes the existence of mitochondrial cAMP-EPAC microdomains in rat hepatocytes, opening new avenues for targeted therapy in drug-induced liver injury (DILI). Both EPAC1 and EPAC2, but not protein kinase A, are responsible for this protective effect. Our findings present cAMP-EPAC as a potential target for the treatment of DILI and liver injury involving mitochondrial dysfunction.


Conflict of interest statement

The authors declare that they have no conflict of interest with other people or organizations during the preparation of this work.

Figures

Fig. 1.
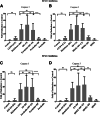
Fig. 1.
Elevation of cAMP prevents DF-induced caspase-3 activation in primary rat hepatocytes. (A and B) show the fold induction of caspase-3 activity vs. control. Cells were incubated with diclofenac 400 µmol/l in the presence and absence of forskolin 10 µmol/l (A) or IBMX 100 µmol/l (B) added 30 minutes before diclofenac exposure. The use of forskolin and IBMX alone do not cause significant induction of caspase-3 activity. Diclofenac and/or elevation of cAMP levels do not induce significant necrotic cell death as determined by Sytox green staining (C). Scale bar, 250 μm. Two-tailed Mann-Whitney U test was used to determine statistical significance (n = 6). Data are presented as means ± S.D. (****P ≤ 0.00005, ***P ≤ 0.0005, **P ≤ 0.005, ns = P ≥ 0.05).
Fig. 2.
Fig. 2.
The PKA inhibitor RP-8CPT-cAMPS (RP) only partially reverses the protective effect of forskolin (A) but not IBMX (B) against DF-induced apoptosis in primary rat hepatocytes. PKA inhibitor alone does not cause cell death. Cells were incubated with diclofenac (400 µmol/l, 12 hours) with and without RP-8CPT-cAMPS (100 µmol/l, 12 hours) added 20 minutes before forskolin (10 µmol/l) or IBMX (100 µmol/l) added 30 minutes before diclofenac exposure. Two-tailed Mann-Whitney U test was used to determine statistical significance (n = 6). Data are presented as means ± S.D. (*P ≤ 0.05, *** P ≤ 0.001, non significant (ns) = P ≥ 0.05).
Fig. 3.
Fig. 3.
Both EPAC inhibitor CE3F4 and ESI-05 reverse the protective effect of forskolin (A and C) and IBMX (B and D) against DF-induced apoptosis in primary rat hepatocytes. EPAC inhibitors alone do not significantly increase caspase-3 activity. Cells were incubated with diclofenac (400 µmol/l, 12 hours) with and without ESI-05 (ES, 15 µmol/l) or CE3F4 (CE, 10 µmol/l) in the presence or absence of forskolin (10 µmol/l) or IBMX (100 µmol/l) added 30 minutes before diclofenac exposure. Two-tailed Mann-Whitney U test was used to determine statistical significance (n = 6). Data are presented as means ± S.D. (****P ≤ 0.00005, ***P ≤ 0.0005, **P ≤ 0.005, non significant (ns) = P ≥ 0.05).
Fig. 4.
Fig. 4.
Relative mRNA expression of EPAC1 and EPAC2 in different liver cell types. (A) EPAC1 mRNA is high in LSECs and intermediate in activated stellate cells but low in (primary) hepatocytes and Kupffer cells. (B) EPAC1 expression. The LSEC data set was omitted to emphasize the expression of EPAC1 in (primary) rat hepatocytes and Kupffer cells. (C) EPAC2 mRNA expression is high in hepatocytes and intermediate in LSECs and activated stellate cells but absent in Kupffer cells. (D) mRNA expression of EPAC2 isoforms in primary rat hepatocytes. EPAC2C mRNA and EPAC2B mRNA are expressed in hepatocytes, whereas EPAC2A mRNA is not detected in hepatocytes.
Fig. 5.
Fig. 5.
Immunofluorescence and Western blot analysis of EPACs. (A) Immunofluorescence analysis shows expression of EPAC1 and EPAC2 in primary cultures of rat hepatocytes. EPAC1 shows a punctate-like staining pattern. Nuclei are stained blue with 4′,6-diamidino-2-phenylindole (DAPI). Negative controls are without primary antibody. Scale bar, 10 μm. (B) EPAC1 protein is expressed in rat hepatocyte mitochondria and whole-cell lysate. EPAC1-HA overexpressed in HEK 293 cells was used as a molecular weight control for EPAC1. β-Actin was used as a loading control. EPAC1 set represents n = 8 from at least three biologic replicates (independent rat isolations). (C) EPAC2 isoforms (2B and 2C) are expressed in rat hepatocyte mitochondria and whole-cell lysate. Human hippocampus, rat heart, and human EPAC2A and EPAC2B, overexpressed in HEK 293 cells, were used as controls. β-Actin was used as a loading control, whereas translocase of inner membrane protein (Tim23) was used as a control for mitochondria samples, and EPAC2 set represents n = 3 biologic replicates (independent rat hepatocyte isolations). Cytosol, cytosolic fraction; Mito, mitochondria fraction; Total, total cell lysate; WCL, whole-cell lysate.
Fig. 6.
Fig. 6.
Elevation of cAMP does not prevent ATP depletion caused by DF in primary rat hepatocytes. The panels show the percentage of luminescence as relative luminescence units (RLU) normalized to the control condition. Cells were incubated with diclofenac (400 µmol/l, 2 and 4 hours) in the presence and absence of forskolin (10 µmol/l, 2 and 4 hours) or IBMX (100 µmol/l, 2 and 4 hours) added 30 minutes before diclofenac exposure. (A) shows ATP levels 2 hours after DF exposure; (B) shows ATP levels 4 hours after DF exposure. Two-tailed Mann-Whitney U test was used to determine statistical significance (n = 9). Data are presented as means ± S.D. (****P ≤ 0.00005, ns = P ≥ 0.05).
Fig. 7.
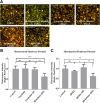
Fig. 7.
Elevation of cAMP prevents early mitochondrial membrane potential depolarization induced by diclofenac in primary hepatocytes. Cells were incubated with diclofenac (400 µmol/l, 2 hours) with and without forskolin (10 µmol/l) or IBMX (100 µmol/l) added 30 minutes before diclofenac exposure. (A) shows JC-10 staining for the different conditions. Scale bar, 250 μm. (B and C) show the quantitative representation of the fluorescence intensity red/green ratio of the JC-10 staining. Quantification of the fluorescence intensity ratio red/green was calculated by comparing the IntDen of the red and green channels, avoiding the quantification of dead cells, and normalizing the data to the mean IntDen of the control condition. Two-tailed Mann-Whitney U test was used to determine statistical significance (n = 6). Data are presented as means ± S.D. (***P ≤ 0.0005, **P ≤ 0.005, *P ≤ 0.05, ns = P ≥ 0.05).
Fig. 8.
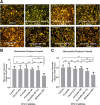
Fig. 8.
EPAC1 inhibition [CE3F4; (A and C)] but not EPAC2 inhibition [ESI-05; (A and C)] slightly but significantly reduces the protective effect of forskolin against DF-induced mitochondrial membrane potential depolarization. EPAC inhibitors alone do not cause significant alterations to the mitochondrial membrane potential (A–C). (A) shows fluorescence intensity (ratio red/green). Scale bar, 250 μm. Cells were incubated with DF (400 µmol/l, 2 hours) with and without ESI-05 (ES) (15 µmol/l) or CE3F4 (CE) (10 µmol/l) added 30 minutes before forskolin (10 µmol/l) added 30 minutes before diclofenac exposure. (B and C) show quantification of the fluorescence intensity ratio red/green, which was calculated by comparing the IntDen of the red and green channels, avoiding the quantification of dead cells, and normalizing the data to the mean IntDen of the control condition. Two-tailed Mann-Whitney U test was used to determine statistical significance (n = 6). Data are presented as means ± S.D. (*P ≤ 0.05,**P ≤ 0.01, ns = P ≥ 0.05).
Fig. 9.
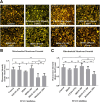
Fig. 9.
The EPAC2 inhibitor ESI-05 (A and B) but not the EPAC1 inhibitor CE3F4 (CE) (A and C) abolishes the protective effect of IBMX against DF-induced mitochondrial membrane potential depolarization in primary hepatocytes. EPAC inhibitors alone do not cause significant alterations in the mitochondrial membrane potential. The figures show fluorescence intensity (ratio red/green). Cells were incubated with diclofenac (400 µmol/l, 2 hours) with and without ESI-05 (ES) (15 µmol/l) or CE3F4 (CE) (10 µmol/l) added 30 minutes before IBMX (100 µmol/l) added 30 minutes before diclofenac exposure. Quantification of the fluorescence intensity ratio red/green was calculated by comparing the IntDen of the red and green channels, avoiding the quantification of dead cells, and normalizing the data to the mean IntDen of the control condition. Two-tailed Mann-Whitney U test was used to determine statistical significance (n = 6). Data are presented as means ± S.D. (*P ≤ 0.05, **P ≤ 0.01, ns = P ≥ 0.05).
Fig. 10.
Fig. 10.
Proposed mechanism of the protective effect of cAMP-EPAC against diclofenac-induced toxicity in rat hepatocytes. Diclofenac toxic metabolites are derived mainly from phase I metabolism in the endoplasmic reticulum (ER). Phase I metabolism is driven by the cytochrome P450 family (CYP2C9, CYP3A4, and CYP2C8 in humans or CYP3A1, CYP2C6, and CYP2C11 in rats). As a result, 4-OH, 5-OH, and unidentified mono- and dihydroxylated metabolites are formed (Lores Arnaiz et al., 1995; Boelsterli, 2003). When glutathione and/or NAD(P)H are depleted, diclofenac metabolites accumulate and cause ER stress, inducing CCAAT-enhancer-binding prtoein (C/EBP) homologous protein (CHOP). As a consequence, the inositol 1,4,5-trisphosphate (IP3) receptor type 1 (IP3R1) calcium ion release channel is activated, inducing a mitochondrial overload of Ca2+ through sites of close contact called mitochondria-associated ER membranes, causing a potential difference between the cytosol and the inner mitochondrial membrane potential (ΔΨm) (Rizzuto et al., 1998). Sustained high levels of Ca2+ in the mitochondria trigger the release of cytochrome c, Apoptosome activating factor-1 (Apaf-1), and ATP. These molecules bind to procaspase 9, leading to apoptosome formation and activation of caspase-9, which activates caspase-3, followed by apoptosis (Lamb, 2020). Apoptosis induced by diclofenac is prevented by the use of cAMP-elevating agents (forskolin and IBMX). The cAMP-elevating agents promote cAMP accumulation via direct activation of pmAC or the inhibition of PDEs. cAMP accumulation is compartmentalized and activates via either EPAC1 (primarily localized in the mitochondria) or both EPAC2A and EPAC2B (localized in mitochondria and cytosol). Depicted is a potential (mitochondrial) AC-cAMP-EPAC1 and PDE-cAMP-EPAC2 domain. EPAC activation will then prevent ΔΨm depolarization, preventing the activation of caspase-3 and apoptotic cell death. β-AR: β-adrenergic receptor, MCU: mitochondrial calcium uniporter. For further details, see text.

Similar articles

Cited by

References

    1. Acin-Perez R, Salazar E, Kamenetsky M, Buck J, Levin LR, Manfredi G (2009) Cyclic AMP produced inside mitochondria regulates oxidative phosphorylation. Cell Metab 9:265–276. - PMC - PubMed
    1. Aithal GP, Day CP (2007) Nonsteroidal anti-inflammatory drug-induced hepatotoxicity. Clin Liver Dis 11:563–575, vi–vii. - PubMed
    1. Azevedo MF, Faucz FR, Bimpaki E, Horvath A, Levy I, de Alexandre RB, Ahmad F, Manganiello V, Stratakis CA (2014) Clinical and molecular genetics of the phosphodiesterases (PDEs). Endocr Rev 35:195–233. - PMC - PubMed
    1. Bhakuni GS, Bedi O, Bariwal J, Deshmukh R, Kumar P (2016) Animal models of hepatotoxicity. Inflamm Res 65:13–24. - PubMed
    1. Bhattacharjee R, Xiang W, Wang Y, Zhang X, Billiar TR (2012) cAMP prevents TNF-induced apoptosis through inhibiting DISC complex formation in rat hepatocytes. Biochem Biophys Res Commun 423:85–90. - PMC - PubMed

Publication types

LinkOut - more resources