. 2021 Feb 16;118(7):e2017115118.
doi: 10.1073/pnas.2017115118.

SOX2 is required independently in both stem and differentiated cells for pituitary tumorigenesis in p27-null mice

Affiliations

SOX2 is required independently in both stem and differentiated cells for pituitary tumorigenesis in p27-null mice

Veronica Moncho-Amor et al. Proc Natl Acad Sci U S A. .

Abstract

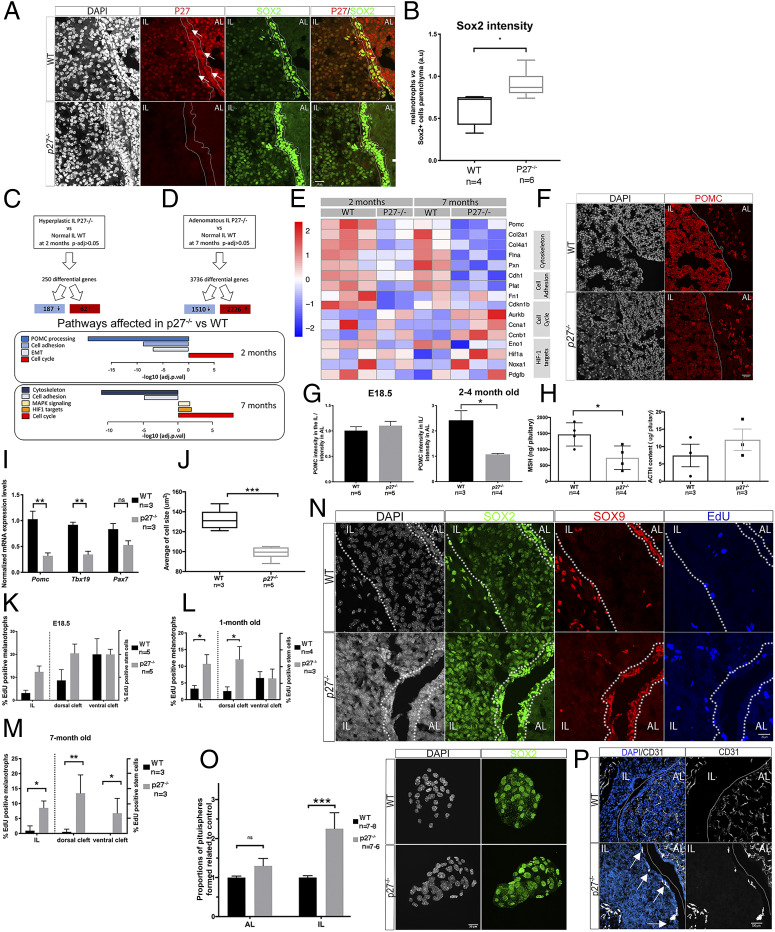
P27, a cell cycle inhibitor, is also able to drive repression of Sox2 This interaction plays a crucial role during development of p27-/- pituitary tumors because loss of one copy of Sox2 impairs tumorigenesis [H. Li et al., Cell Stem Cell 11, 845-852 (2012)]. However, SOX2 is expressed in both endocrine and stem cells (SCs), and its contribution to tumorigenesis in either cell type is unknown. We have thus explored the cellular origin and mechanisms underlying endocrine tumorigenesis in p27-/- pituitaries. We found that pituitary hyperplasia is associated with reduced cellular differentiation, in parallel with increased levels of SOX2 in stem and endocrine cells. Using conditional loss-of-function and lineage tracing approaches, we show that SOX2 is required cell autonomously in p27-/- endocrine cells for these to give rise to tumors, and in SCs for promotion of tumorigenesis. This is supported by studies deleting the Sox2 regulatory region 2 (Srr2), the target of P27 repressive action. Single cell transcriptomic analysis further reveals that activation of a SOX2-dependent MAPK pathway in SCs is important for tumorigenesis. Altogether, our data highlight different aspects of the role of SOX2 following loss of p27, according to cellular context, and uncover an unexpected SOX2-dependent tumor-promoting role for SCs. Our results imply that targeting SCs, in addition to tumor cells, may represent an efficient antitumoral strategy in certain contexts.

Keywords: pituitary; stem cell; tumorigenesis.


Conflict of interest statement

The authors declare no competing interest.

Figures

Fig. 1.
Fig. 1.
The expression of stem cell and differentiation markers is affected in p27−/− IL. (A) P27 and SOX2 immunofluorescence in adult pituitaries. In p27−/− IL, SOX2 staining is more intense. (B) Quantification of SOX2 expression levels in p27−/− versus wild type (WT) after immunofluorescence. The ratio of staining intensity between SOX2+melanotroph/SOX2+ SC in AL parenchyma is represented. In WT, SOX2 staining in melanotrophs is less intense than in AL SCs (0.63 ± 0.20) while in p27−/− it becomes similar (0.91 ± 0.16); (*P = 0.019, n = 4–6 in each group). (C and D) Bulk RNAseq selected pathway analysis in 2-mo-old IL (p27−/− n = 2 vs. WT n = 3, adjusted P value <0.05) (C), and in 7-mo-old hyperplastic IL (p27−/− n = 4 vs. WT n = 2) (D). Blue tones show down-regulated pathways while red-yellow represent up-regulation. (E) Heatmap of representative genes expression from pathways shown in C and D. (F) POMC immunofluorescence in adult pituitaries. (G) Quantification of POMC intensity in melanotrophs in relation to corticotrophs at E18.5 in WT (1.01 ± 0.17, n = 5) and p27−/− (1.10 ± 0.19, n = 5) and in 2- to 4-mo-old animals. Levels are significantly reduced in mutants (WT: 2.42 ± 0.76, n = 3; p27−/−: 1.1 ± 0.07, n = 4, *P = 0.0286). (H) Radioimmunoassays for MSH and ACTH. p27−/− pituitaries contain less MSH (*P = 0.0306, n = 4 in each group) (Left graph); ACTH levels are not affected (Right graph). (I) RT-qPCR in 2- to 3-mo-old p27−/− and WT. Pomc (WT: 1.03 ± 0.27, n = 3; p27−/−: 0.32 ± 0.09, n = 3,**P = 0.0013) and Tbx19 levels (WT: 0.94 ± 0.08, n = 3; p27−/−: 0.30 ± 0.10, n = 3, **P = 0.0071) were reduced in mutants. (J) Average cell size of melanotrophs. p27−/− melanotrophs (99 ± 5.6, n = 5) are smaller compared to WT (132 ± 10, n = 3, ***P = 0.0007). (KM) Analysis of cell proliferation. EdU incorporation was quantified in melanotrophs (EdU;SOX2;PAX7 triple positive/SOX2;PAX7 double positive in L or EdU;SOX2 double positive; SOX9 negative/SOX2 positive;SOX9 negative positive cells in M and N) and SCs (EdU;SOX2 double positive; PAX7 negative/SOX2 positive;PAX7 negative cells in L or EdU;SOX2;SOX9 triple positive/SOX2;SOX9 double positive in M and N). SCs were distinguished as ventral (flanking AL) or dorsal (flanking IL). In 1-mo-old mice (M), cell proliferation increases in p27−/− melanotrophs and dorsal SCs (n = 3–4 mice/genotype, melanotrophs *P = 0.0235, dorsal cleft *P = 0.0419). In 7-mo-old mice, (N) cell proliferation increases in melanotrophs and both dorsal and ventral SCs (n = 3 mice/genotype, melanotrophs *P = 0.0167, dorsal cleft **P = 0.0085, ventral cleft *P = 0.0229). (N) SOX2, SOX9, and EdU triple staining in 1-mo-old pituitaries. (O) Immunofluorescence for SOX2 on IL pituispheres from 2- to 3-mo-old animals. The proportion of pituispheres is increased in mutant IL (***P < 0.0001, n = 6–8 in each group). (P) Immunofluorescence for CD31 in 1-mo-old pituitaries. p27−/− ILs show ectopic blood vessels (arrows). ns, nonsignificant.
Fig. 2.
Fig. 2.
Deletion of one copy of Sox2 in p27−/− animals improves survival and results in reduction of cell proliferation and impairment of tumorigenesis. (A) Brightfield pictures taken at the same magnification of WT, Sox2+/−, p27−/− , and p27−/−; Sox2+/− pituitaries (Left). Histological analysis of 10- to 12-mo-old WT, p27−/−, and p27−/−; Sox2+/− pituitaries (Right). In p27−/−; Sox2+/− IL tumorigenesis is impaired, but hyperplasia is observed. (B) Comparison modalities for RNAseq analysis of wild-type, p27−/−, and p27−/−; Sox2+/− 2- to 3-mo-old IL samples (WT n = 4, p27−/− n = 3, p27−/−; Sox2+/− n = 3, adjusted P value <0.05) (Left). Selected enriched pathways are represented (Center) and heatmap of representative gene expression from affected pathways (Right). (C) Analysis of cell proliferation. EdU incorporation was quantified in melanotrophs (EdU; SOX2 double positive; SOX9 negative/SOX2 positive;SOX9 negative cells) and SCs (EdU; SOX2; SOX9 triple positive/SOX2; SOX9 double positive cells). SCs were further distinguished as ventral or dorsal, respectively, as flanking the anterior or intermediate lobe. Deletion of one copy of Sox2 results in a reduction of cell proliferation compared to p27−/− samples in dorsal cleft SCs (n = 3 to 4 mice/genotype, *P = 0.0208), melanotrophs. (D) SOX2 and EdU double staining in 2- to 3-mo-old WT, p27−/−, and p27−/−; Sox2+/− animals. There is a clear reduction in SOX2 levels in p27−/−; Sox2+/− ILs. Cleft and IL are outlined. (E) Proportion of pituispheres obtained from AL and IL WT, Sox2+/−, p27−/−, and p27−/−; Sox2+/− 2- to 3-mo-old animals. There is a reduction in the proportion of pituispheres formed from p27−/−; Sox2+/− ILs compared to p27−/− samples. WT (1 ± 0.11, n = 5), Sox2+/− (0.2 ± 0.08, n = 2), p27−/− (2.09 ± 0.31, n = 4), and p27−/−; Sox2+/− (1 ± 0.52, n = 3), ****P < 0.0001 and ***P = 0.0002; the reduction in Sox2+/− samples in agreement with the slightly hypomorphic pituitaries observed in Sox2 heterozygous mice (25). (F) Quantitative analysis of melanotroph marker expression levels by RT-qPCR in 2- to 3-mo old WT, Sox2+/−, p27−/−, and p27−/− ; Sox2+/− IL. In p27−/−; Sox2+/− animals, Tbx19 expression levels are restored to WT levels. Pomc; WT (n = 3) vs. p27−/−; Sox2+/− (n = 3), *P = 0.03 and WT vs. p27−/− (n = 3), **P = 0.0022, Tbx19; WT vs. p27−/−; Sox2+/− (n = 3, P = nonsignificant [ns]) and WT vs. p27−/− (n = 3, *P = 0.0169).
Fig. 3.
Fig. 3.
Deletion of Srr2 in p27−/− animals results in reduction of cell proliferation in SCs and impairment of tumorigenesis. (A) Schematic representation of the Sox2 murine locus and Srr2 deletions. Two pairs of sgRNA (pairs 1 and 2, protospacer adjacent motif sequence in orange) were designed. The primers used to genotype Srr2-deleted animals are marked by red arrows. Three founders deleted for Srr2 were used to generate stable lines (founders 1 through 3); the size of the deletion is indicated for each line. (B) Gel electrophoresis showing mosaic loss of Srr2 in founder mice. The number above each lane corresponds to a individual founder. Boxed numbers below indicate strain derived from that particular founder. (C) Brightfield pictures of WT, Srr2del/del, p27−/−, and p27−/−; Srr2del/del pituitaries. Deletion of two copies of Sox2 Srr2 on a p27−/− background is sufficient to delay tumorigenesis. (D) Analysis of cell proliferation. EdU incorporation was quantified in melanotrophs (EdU; SOX2 double positive; SOX9 negative/SOX2 positive; SOX9 negative cells) and SCs (EdU; SOX2; SOX9 triple positive/SOX2; SOX9 double positive cells) in 7-mo-old WT, p27−/−, and p27−/−; Srr2del/del animals. In p27−/−; Srr2del/del animals, there is a reduction of proliferation in stem cells compared to p27−/− (p27−/− (12.33 ± 5.37, n = 4) vs. p27−/−; Srr2del/del (2.11 ± 1.88, n = 4), **P = 0.0061), but not in melanotrophs (p27−/− [8.75 ± 2.36] vs. p27−/−; Srr2del/del [6.45 ± 4.01], P = ns). (E) SOX2 and EdU double staining in 7-mo-old p27−/− and p27−/−; Srr2del/del animals. SOX2 expression appears decreased in p27−/−; Srr2del/del IL. Cleft is outlined. (F) Quantification of SOX2 expression levels in WT, Srr2del/del, p27−/−, p27−/−;Sox2+/−, p27−/−;Srr2del/del. Levels of expression were quantified after immunofluorescence in SCs and melanotrophs. In p27−/−;Srr2del/del, SOX2 staining is less intense than in p27−/− (*P = 0.017 SCs and **P = 0.0078 in melanotrophs, n = 11 to 4 in each group). In contrast SOX2 staining is more intense in p27−/− SC vs. WT (***P = 0.0007) and p27−/−;Sox2+/− (***P = 0.0009). (G) Proportion of pituispheres obtained from IL in WT, p27−/−, and p27−/−; Srr2del/del. The percentage of spheres formed from p27−/−; Srr2del/del (0.02 ± 0.007, n = 3, P = ns) is not significantly higher than WT (0.006 ± 0.005, n = 3), in contrast with p27−/− samples (0.04 ± 0.02, n = 3, *P = 0.0344), demonstrating that loss of Srr2 has an impact on sphere-forming efficiency in mutants. ns, nonsignificant.
Fig. 4.
Fig. 4.
Deletion of one copy of Sox2 in p27−/− melanotrophs prevents IL tumorigenesis. (A) SOX2 and EdU double staining in 6- to 8-mo-old Pomc-CreERT2, Pomc-CreERT2; p27−/−, and Pomc-CreERT2; Sox2fl/+; p27−/− pituitaries. (B) Analysis of cell proliferation. EdU incorporation was quantified in melanotrophs (EdU; SOX2 low; POMC triple positive/DAPI nuclei in IL). EdU levels are similarly elevated in both p27−/− samples. Pomc-CreERT2; Sox2fl/+; p27−/− (7.53 ± 2.92, n = 4, **P = 0.0023) and Pomc-CreERT2; p27−/− (7.68 ± 1.20, n = 8, ***P = 0.0007) vs. Pomc-CreERT2 (controls), (1.60 ± 0.55, n = 3). (C and D) EdU incorporation was quantified in Sox2+/+ melanotrophs (PAX7+ve; eYFP−ve) (2.40 ± 1.31, n = 6) and in Sox2+/− melanotrophs (PAX7; eYFP double positive) (0.78 ± 0.86, n = 6) in 2.5- to 6-mo-old Pomc-CreERT2; Sox2fl/+; p27−/−; Rosa26ReYFP mice, assuming that Rosa26ReYFP recombination reflects Sox2 heterozygous deletion. In Sox2+/− melanotrophs EdU incorporation is significantly reduced compared to Sox2+/+ ones (*P = 0.0210), demonstrating that loss of one copy of Sox2 results in reduced proliferation in p27−/− melanotrophs. (D) EdU, eYFP, and PAX7 triple staining. Most EdU; PAX7 positive cells (arrows) do not express eYFP in Pomc-CreERT2; Sox2fl/+; p27−/−; Rosa26ReYFP IL. (E) Brightfield pictures of Pomc-Cre, Pomc-Cre; p27−/−, and Pomc-Cre; Sox2fl/+; p27−/− pituitaries. Deletion of one copy of Sox2 using Pomc-Cre prevents IL tumorigenesis. (F) Double immunofluorescence for POMC and SOX9 in 6- to 10-mo-old animals, illustrating reduced IL size in Pomc-Cre; Sox2fl/+; p27−/−. (G) Measurement of IL area in Pomc-Cre; p27−/− (1,472,054 ± 808,382, n = 3) and Pomc-Cre; Sox2fl/+; p27−/− (495,612 ± 185,861, n = 3). IL area in Pomc-Cre; Sox2fl/+; p27−/− pituitaries represents a third of IL area in p27−/− mutants (**P = 0.0041). (H) Quantification of POMC intensity in melanotrophs in relation to corticotrophs in 6- to 10-mo-old Pomc-Cre; p27−/− (1.13 ± 0.11, n = 3) vs. Pomc-Cre; Sox2fl/+; p27−/− (1.89 ± 0.29, n = 3) animals, where levels are significantly increased, *P = 0.0127. (I) In situ hybridization for Sox2 in 6.25- to 10-mo-old wild-type, p27−/−, p27−/−; Sox2+/−, and Pomc-Cre; Sox2fl/+; p27-/ animals. (J) Quantification of Sox2 levels following in situ hybridization. Sox2 expression levels are reduced in both p27−/−; Sox2+/− and Pomc-Cre; Sox2fl/+; p27-/ melanotrophs and SCs compared to p27−/−. Quantification of Sox2 levels in melanotrophs: p27−/− (12.17 ± 2.15, n = 4), WT (3.5 ± 2.5, **P < 0.003), p27−/−; Sox2+/− (5.4 ± 1, *P = 0.0276), Pomc-Cre; Sox2fl/+; p27−/ (2.56 ± 0.1, **P = 0.0038). Quantification of Sox2 levels in SCs: p27−/− (28 ± 6, n = 4), WT (11.4 ± 8, n = 5, ****P < 0.0001), p27−/−; Sox2+/− (11.3 ± 1.4, n = 3, ****P < 0.0001), Pomc-Cre; Sox2fl/+; p27−/ (19 ± 3, n = 3, **P = 0.0039). IL is outlined in A. IL and stem cell cleft are outlined in I. ns, nonsignificant.
Fig. 5.
Fig. 5.
SOX2 is required in SCs for tumorigenesis in p27−/− IL. (A) eYFP, SOX9 (Middle), and eYFP, PAX7 (Right) double stainings in 7- to 12-mo-old Sox9iresCreERT2/+; Rosa26ReYFP/+ and Sox9iresCreERT2/+; p27−/−; Rosa26ReYFP/+ animals. eYFP; SOX9 double positive cells are localized in the epithelium lining the cleft in both genotypes (arrows). Very few eYFP+, SOX9, and PAX7 cells are present in Sox9iresCreERT2/+; Rosa26ReYFP/+ animals (arrows). In Sox9iresCreERT2/+; p27−/− Rosa26ReYFP/+ pituitaries some rare eYFP; PAX7 double-positive cells are present, demonstrating low levels of differentiation into melanotroph (Left). (B) Brightfield pictures (Upper) and SOX2 immunohistochemistry (Bottom) on sections of Sox9iresCreERT2/+; Rosa26ReYFP/+, Sox9iresCreERT2/+; p27−/−, and Sox9iresCreERT2/+; Sox2fl/+; p27−/− pituitaries. In Sox9iresCreERT2/+; Sox2fl/+; p27−/− pituitaries tumorigenesis is impaired (1-y-old 14% tumor incidence, n = 7) compared to Sox9iresCreERT2/+; p27−/− (1-y-old, n = 5, 100% tumor incidence). The thickness of the SOX2 positive SC epithelium resembles that of control, demonstrating that reduction of Sox2 dosage in SCs impairs p27−/− IL tumorigenesis. (C, D, and F) Analysis of cell proliferation. EdU incorporation was quantified in SCs and melanotrophs in 7- to 12-mo-old Sox9iresCreERT2/+, Sox9iresCreERT2/+; p27−/−, and Sox9iresCreERT2/+; Sox2fl/+; p27−/− IL. (C) In SCs (EdU; SOX2; SOX9 triple positive/SOX2; SOX9 double-positive cells), there is a significant reduction of proliferation in Sox9iresCreERT2/+; Sox2fl/+; p27−/− samples (0.20 ± 0.35, n = 3, **P = 0.0011) compared to Sox9iresCreERT2/+; p27−/− ones (3 ± 0.68, n = 3). In fact, proliferation in Sox9iresCreERT2/+; Sox2fl/+; p27−/− SC is similar to Sox9iresCreERT2/+ controls (0.28 ± 0.32, n = 3, P = ns). (D) In melanotrophs (POMC positive cells in IL/DAPI positive nuclei), there is a reduction of cell proliferation in Sox9iresCreERT2/+;Sox2fl/+;p27−/− samples (1.88 ± 0.72, n = 6, **P = 0.0033) compared to Sox9iresCreERT2/+;p27−/− (3.7 ± 0.76, n = 4); again proliferation in Sox9iresCreERT2/+;Sox2fl/+;p27−/− is similar to Sox9iresCreERT2/+ controls (0.60 ± 0.4, n = 4, *P = 0.03) while proliferation is increased in Sox9iresCreERT2/+;p27−/− vs Sox9iresCreERT2/+ controls (****P = 0.0001). (E) Quantification of the vascular structures ectopic development in 7 to 12 mo old. Sox9iresCreERT2/+, Sox9iresCreERT2/+; p27−/−, and Sox9iresCreERT2/+; Sox2fl/+; p27−/− animals. Deletion of one copy of Sox2 in SC leads to a reduction in the development of ectopic blood vessels in IL. IL vascular structures area: Sox9iresCreERT2/+ (0.32 ± 0.28, n = 3), Sox9iresCreERT2/+; p27−/− (2.56 ± 1.26, n = 3, (*P < 0.03), and Sox9iresCreERT2/+; Sox2fl/+; p27−/− (1.15 ± 0.43, n = 3). (F) EdU, SOX2 double staining in 7- to 12-mo-old Sox9iresCreERT2/+, Sox9iresCreERT2/+; p27−/−, and Sox9iresCreERT2/+; Sox2fl/+; p27−/− pituitary glands. Right, immunofluorescence for CD31 showing ectopic blood vessel formation reduction in Sox9iresCreERT2/+; Sox2fl/+; p27−/− sample. SC layer is outlined in A, IL in F. ns, nonsignificant.
Fig. 6.
Fig. 6.
Characterization of the transcriptomic effects of Sox2 dosage reduction in SCs in p27−/− IL by single cell analysis. (A) Identification of clusters in integrated UMAP. (B) Subclustering of the stem cell fraction (0.9 resolution) shows that segregation only partially correlates with genotype (Right). (C) Representation of the proportion of cells of the indicated genotype in each cluster, Sox9iresCreERT2/+ (n = 137 cells), Sox9iresCreERT2/+; p27−/− (n = 104 cells), and Sox9iresCreERT2/+; Sox2fl/+; p27−/− (n = 82 cells). (D) Heatmap showing expression of 14 genes selected out of 36 differentially expressed genes (adjusted P value <0.05) in Sox9iresCreERT2/+; p27−/− compared with Sox9iresCreERT2/+ or Sox9iresCreERT2/+; Sox2fl/+; p27−/−. (E) Immunohistochemistry for p-ERK on Sox9iresCreERT2/+, Sox9iresCreERT2/+; p27−/−, and Sox9iresCreERT2/+; Sox2fl/+; p27−/− pituitaries. While the MAPK/ERK pathway seems overactive in p27−/− SCs, p-ERK levels return to normal levels upon deletion of one copy of Sox2 in SCs. (F) Subclustering of the melanotroph fraction (0.2 resolution) shows that segregation correlates with genotype (Right). (G) Representation of the proportion of cells of the indicated genotype in the most abundant cluster, Sox9iresCreERT2/+ (n = 1,272 cells), Sox9iresCreERT2/+; p27−/− (n = 3,561 cells), and Sox9iresCreERT2/+; Sox2fl/+; p27−/− (n = 3,006 cells). (H) Strategy followed for scRNAseq analysis of Sox9iresCreERT2/+; p27−/− vs. Sox9iresCreERT2/+ or/and Sox9iresCreERT2/+; Sox2fl/+; p27−/− melanotrophs. (I, Upper) Pathway analysis on genes differentially expressed (adjusted P value <0.05) in melanotrophs following the strategy delineated in I. Pathways associated with secretory function and cytoskeleton are down-regulated in Sox9iresCreERT2/+; p27−/− cells. (Bottom) Process network analysis performed on genes differentially expressed between Sox9iresCreERT2/+; p27−/− and Sox9iresCreERT2/+; Sox2fl/+; p27−/− melanotrophs (adjusted P value <0.05). Processes associated with translation and transcription are down-regulated in Sox9iresCreERT2/+; p27−/− melanotrophs, while genes promoting cell cycle progression are up-regulated. (J) RT-qPCR analysis of Tbx19 levels in 5- to 12-mo-old Sox9iresCreERT2/+, Sox9iresCreERT2/+; p27−/−, Sox9iresCreERT2/+; Sox2fl/+; p27−/−, and p27−/−; Sox2+/− IL. Tbx19 levels are increased in Sox9iresCreERT2/+; Sox2fl/+; p27−/− (0.99 ± 0.20, n = 3, *P = 0.02) and p27−/−; Sox2+/− (1.07 ± 0.15, n = 3, **P = 0.0044) vs. Sox9iresCreERT2/+; p27−/− (0.58 ± 0.28, n = 4).
Fig. 7.
Fig. 7.
Model recapitulating the consequences of Sox2 dosage modulation during IL p27−/− tumorigenesis and its proposed roles. In normal IL, SOX2 is expressed at high levels in SCs and at low levels in melanotrophs. In p27−/− IL, melanotroph tumors develop with increased SC proliferation. SOX2 levels are increased in both cell types, while expression of TBX19 and POMC is reduced in melanotrophs. Removal of one copy of Sox2 in p27−/− animals (p27−/−; Sox2+/−) results in impairment of tumorigenesis, while hyperplasia is still observed. Conditional deletion of Sox2 in melanotrophs (Pomc-Cre; Sox2fl/+; p27−/−) prevents hyperplasia and tumor formation; therefore, SOX2 is required cell autonomously for tumor formation (Fig. 4). Furthermore, modulation of SOX2 levels in SCs in this model suggests that melanotrophs interact with SCs (dotted arrow). Conditional deletion of Sox2 in SCs (Sox9iresCreERT2; Sox2fl/+; p27−/−) also impairs tumorigenesis, reduction of Tbx19 levels, and SC overproliferation but hyperplasia is still observed (Figs. 5 and 6). Therefore SCs promote tumor formation and loss of differentiated features, while not giving rise to tumorigenic cells themselves. This tumor-promoting role of SCs (arrow) depends on SOX2. Therefore SOX2 is required both in melanotrophs and SCs for respectively cell-autonomous and tumor-promoting functions following loss of P27. This model was created with BioRender.com.

References

    1. Balbinot C., et al. , The Cdx2 homeobox gene suppresses intestinal tumorigenesis through non-cell-autonomous mechanisms. J. Exp. Med. 215, 911–926 (2018). - PMC - PubMed
    1. Andoniadou C. L., et al. , Sox2(+) stem/progenitor cells in the adult mouse pituitary support organ homeostasis and have tumor-inducing potential. Cell Stem Cell 13, 433–445 (2013). - PubMed
    1. Lytle N. K., Barber A. G., Reya T., Stem cell fate in cancer growth, progression and therapy resistance. Nat. Rev. Cancer 18, 669–680 (2018). - PMC - PubMed
    1. Lamolet B., et al. , A pituitary cell-restricted T box factor, Tpit, activates POMC transcription in cooperation with Pitx homeoproteins. Cell 104, 849–859 (2001). - PubMed
    1. Budry L., et al. , The selector gene Pax7 dictates alternate pituitary cell fates through its pioneer action on chromatin remodeling. Genes Dev. 26, 2299–2310 (2012). - PMC - PubMed

Publication types

MeSH terms

Substances