. 2021 Mar 1;35(5-6):392-409.
doi: 10.1101/gad.347989.120. Epub 2021 Feb 11.

Molecular principles of Piwi-mediated cotranscriptional silencing through the dimeric SFiNX complex

Affiliations

Molecular principles of Piwi-mediated cotranscriptional silencing through the dimeric SFiNX complex

Jakob Schnabl et al. Genes Dev. .

Abstract

Nuclear Argonaute proteins, guided by their bound small RNAs to nascent target transcripts, mediate cotranscriptional silencing of transposons and repetitive genomic loci through heterochromatin formation. The molecular mechanisms involved in this process are incompletely understood. Here, we show that the SFiNX complex, a silencing mediator downstream from nuclear Piwi-piRNA complexes in Drosophila, facilitates cotranscriptional silencing as a homodimer. The dynein light chain protein Cut up/LC8 mediates SFiNX dimerization, and its function can be bypassed by a heterologous dimerization domain, arguing for a constitutive SFiNX dimer. Dimeric, but not monomeric SFiNX, is capable of forming molecular condensates in a nucleic acid-stimulated manner. Mutations that prevent SFiNX dimerization result in loss of condensate formation in vitro and the inability of Piwi to initiate heterochromatin formation and silence transposons in vivo. We propose that multivalent SFiNX-nucleic acid interactions are critical for heterochromatin establishment at piRNA target loci in a cotranscriptional manner.

Keywords: Drosophila oogenesis; LC8; Panoramix; Piwi; cotranscriptional silencing; heterochromatin formation; molecular condensates; piRNA pathway; transposon silencing.


Figures

Figure 1.
Figure 1.
The dynein light chain Cut up/LC8 is an integral SFiNX complex subunit. (A) Silver-stained SDS-PAGE ([left] molecular weight marker) of immunoprecipitated Panx (from endogenously FLAG-GFP-tagged OSC line) and control (from wild-type OSCs). Indicated bands were identified using mass spectrometry. (B) Western blot analysis indicating coimmunoprecipitation of endogenously tagged Ctp from OSCs with Panx and Nxf2 (control: wild-type OSCs). (C) Confocal image of Drosophila egg chamber showing GFP-tagged Ctp. Scale bar, 20µm. (D) Cartoon showing the cotranscriptional silencing reporter system in OSCs. (E, left) Bar diagram indicates fold repression of the GFP reporter after transfection of indicated λN-tagged proteins normalized to control (data represent mean ± SD of three biological replicates). (Right) Western blot analysis showing expression of indicated λN fusion proteins in OSCs (Atp5a: loading control). (F, top) Box plots showing GFP reporter levels in OSCs 5 d after transfection with siRNAs against control or panx and 3 d after transfection with plasmids expressing indicated λN fusion proteins (numbers indicate fold repression values normalized to control; box plots indicate median, first, and third quartiles [box]; whiskers show 1.5× interquartile range; outliers were omitted; n = 2500 cells). The western blot shows Panx protein levels in control versus panx siRNA transfected OSCs (Atp5a: loading control).
Figure 2.
Figure 2.
Ctp is required for SFiNX-mediated transposon silencing. (A) Bar graph showing mRNA levels (normalized to rp49 levels) of the endogenous LTR retrotransposons gypsy and mdg1 after depletion of Panx or Ctp (two independent siRNAs). actin5C mRNA levels served as control. Data represent mean ± SD of three independent experiments. (B) Western blot showing levels of indicated proteins after depletion of Panx or Ctp (Atp5a: loading control). (C) Schematic representation of Panx, indicating secondary structure elements ([black] α helices, [gray] β strands), and the two Ctp binding sites and their evolutionary conservation are shown below. The sequence logo depicts the consensus Ctp/LC8 binding motif (Rapali et al. 2011a). Protein regions tested in D are indicated. (D,E) Western blot analyses of GFP-Ctp immunoprecipitation experiments using lysate from S2 cells transfected with indicated FLAG-Panx expression plasmids (relative amount loaded in immunoprecipitation lanes: 4×). (IN) Input, (UB) unbound, (IP) immunoprecipitate. (F) Western blot showing Panx levels in ovarian lysates from flies of indicated genotype (Atp5a: loading control). (G) The left bar graph shows hatching rates of eggs laid by flies of indicated genotype (data represent mean + SD of three independent replicates). The right graph shows mRNA levels of somatic (mdg1) and germline (burdock) transposons in total ovarian RNA from flies of indicated genotype (normalized to rp49 and control flies; data represent mean + SD of three independent replicates). (H) Meta profiles showing H3K9me3 levels (determined by CUT&RUN) in a 6-kb window around 381 piRNA-controlled transposon insertions (“center”) in OSCs transfected with indicated siRNAs (control or panx KD) and rescue constructs (IgG served as control). Shading indicates standard error of mean (SEM) of two replicates.
Figure 3.
Figure 3.
Ctp mediates dimerization of diverse nuclear protein complexes. (A) Volcano plot showing fold enrichments versus statistical significance (determined by quantitative mass spectrometry) of proteins in FLAG-GFP-Ctp coimmunoprecipitates versus control (n = 3 biological replicates; experimental OSCs express endogenously tagged Ctp; control: wild-type OSCs). The bait (Ctp) and selected interacting nuclear proteins are labeled; red lines indicate applied significance cutoffs. (B) Scatter plot showing fold enrichments (versus control) of proteins coimmunoprecipitating with Ctp from OSC versus ovary lysates. The bait (Ctp) and selected interacting nuclear proteins are labeled. (C) Enrichment of predicted Ctp/LC8 motives in Ctp copurifying proteins (from OSCs [top] and from ovaries [bottom]) determined by gene set enrichment analysis. Protein lists were ranked by their fold enrichment (ranking metric) in the respective coimmunoprecipitation experiments. Ctp hub (Jespersen et al. 2019) was used for Ctp motif prediction. (D) Selected nuclear Ctp interactors grouped into known protein complexes. (Dots) Predicted Ctp binding motives, (red) experimentally confirmed, (gray) not confirmed. (Right) Protein sequence alignments of indicated Ctp binding sites are shown; TQT motives (mutated in Supplemental Fig. S3A,B) are highlighted. (E) Scatter plot showing fold enrichments (vs. control) of proteins coimmunoprecipitating with Ctp (from OSCs) or with LC8/Dynll1 from mouse ES cells. The bait (LC8) and selected interacting nuclear proteins are labeled. (F) Absolute peak intensities of peptides from indicated proteins in Panx or Egg coimmunoprecipitates (values of matched controls were subtracted from experimental values; n = 3 replicates). (n.d.) Not detected. (G) Volcano plot showing fold enrichment of proteins (determined by quantitative mass spectrometry) in FLAG-GFP-Ctp coimmunoprecipitates from panx[Ctp-mut] versus wild-type ovaries. (n = 3 biological replicates).
Figure 4.
Figure 4.
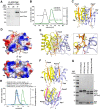
The SFiNX complex is a homodimer. (A) Western blot analysis of a Panx-GFP immunoprecipitation experiment from OSCs harboring one GFP-tagged and one wild-type panx allele. (IN)Input, (UB) unbound, (IP) immunoprecipitate). (B) Molecular weight determination of Ctp in complex with Panx peptides containing Ctp binding site #1 (TQT site), site #2 (TQV site), or both sites as measured by SEC-MALS. (C) Ribbon representation of the structure of a Ctp homodimer (monomers in yellow and cyan) in complex with two Panx peptides containing the Ctp interacting site #1 (TQT site). (D) Electrostatic surface representations of the Ctp homodimer in complex with two Panx peptides containing the Ctp interacting site#1 (TQT site; shown in stick representation). (E) Intermolecular interactions (hydrophobic and hydrogen bonding networks) between the Ctp dimer (monomers in yellow and cyan) and a Panx peptide containing the Ctp interacting site #1 (orange). The TQT motif recognition is shown in the close-up. (F) Ribbon representation of the structure of two Ctp dimers (yellow and blue) in complex with two Panx peptides containing Ctp interacting sites #1 and #2. (G) Coomassie-stained SDS PAGE showing recombinant SFiNX complex variants with indicated protein subunits analyzed in H. (*) HSP70 as determined by mass spectrometry. (H) SEC-MALS chromatogram and determined molecular weight of indicated SFiNX complex variants (from G).
Figure 5.
Figure 5.
Dimerization is required for SFiNX to silence in a cotranscriptional manner. (A) Bar graph showing the transposon repression rescue potential of indicated Panx expression constructs transfected into OSCs depleted of endogenous Panx. gypsy levels were determined via qRT-PCR (at least three biological replicates are shown; error bars: SD). (B) Cartoon representation of the “bypass” strategies using the yeast GCN4 coiled-coil domain. Internal replacement of both Ctp binding sites (blue) or replacement of the entire C-terminal domain of Panx (green) are shown. (C) Bar graph showing hatching rates of eggs laid by flies with indicated genotype (at least three biological replicates are shown; error bars: SD). (D) Bar graph showing mRNA levels of the LTR retrotransposon mdg1 determined via qRT-PCR in ovaries of indicated genotypes. Expression levels were normalized to w[1118] controls and act5C (n = 3 biological replicates; error bars: SD). (E) Cartoon showing the OSC reporter system that allows analysis of cotranscriptional (λN-recruitment) and transcriptional (Gal4 recruitment) silencing. (F) Bar diagrams showing silencing potential (GFP repression) of indicated λN (left) or Gal4 (right) fusion proteins normalized to control (data represent mean + SD of at least three independent experiments).
Figure 6.
Figure 6.
SFiNX interacts with nucleic acids. (A) Agarose gel images showing electrophoresis mobility shift assays (EMSA) using indicated nucleic acids (Alexa 647-labeled). Serial dilution of recombinant SFiNX[wild type] ranging from 7.8 to 2000 nM is shown (“−” indicates no protein; nucleic acid concentration: 5n-+M). (B) Binding curves based on EMSA experiments in A (calculated from quantified free nucleic acid; n = 3; error bars: SD) are shown. (C) Binding curves between ssRNA and indicated SFiNX variants are shown (n = 3; error bars: SD). (D) Schematic representation of Panx, indicating secondary structure elements ([black] α helices, [gray] β strands) and the putative HTH-motif below. Residues mutated in E and F are labeled with asterisks. (E, top) Agarose gel images showing electrophoresis mobility shift assays using indicated nucleic acids (Alexa 647-labeled). Serial dilution of SFiNX[wild type] ranging from 7.8 to 2000 nM is shown (“−” indicates no protein; nucleic acid concentration: 5 nM). (Bottom left) Coomassie-stained SDS PAGE showing recombinant SFiNX complex with HTH mutations. Binding curves based on EMSA experiments with SFiNX[HTH-mut] with ssRNA and dsDNA (calculated from quantified free nucleic acid; n = 3; error bars: SD) are shown. (F, left) Bar graph showing the transposon repression rescue potential of indicated Panx expression constructs transfected into OSCs depleted of endogenous Panx. gypsy levels were determined via qRT-PCR (n = 3 biological replicates are shown; error bars: SD). (Right) Bar diagrams showing silencing potential (GFP repression) of indicated λN-fusion proteins normalized to control (data represent mean + SD of three independent experiments).
Figure 7.
Figure 7.
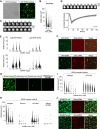
SFiNX forms molecular condensates. (A, left) Bright-field image showing SFiNX[Wt] condensates at 10 μM. Scale bar, 20 µm. (Right) Confocal image showing condensate formation of recombinant SFiNX at 10 µM (containing 10% mEGFP-SFiNX). Scale bar, 20 µm. (B) Shown are droplet number and area per droplet (sum of three microscopic fields of view) of recombinant SFiNX condensates (with mEGFP-SFiNX at 1:10) at indicated protein concentration. (C) Time-lapse series showing fusion event of two SFiNX condensates (differing intensities are due to the bigger droplet being photobleached prior to the fusion event). Scale bar, 5 µm. (D, top) Time-lapse series showing recovery after partial photobleaching of SFiNX condensates (confocal image: representative experiment). Scale bar, 5 µm. (Bottom) Quantification of FRAP data. n = 12 experiments; SD in gray). (E) Shown are droplet number and area per droplet (sum of three microscopic fields of view) of SFiNX condensates (with mEGFP-SFiNX at 1:10) at indicated protein dsDNA (top) and ssRNA (bottom) concentrations. (F) Confocal images (scale bar, 20 µm) showing enrichment of Alexa 647-labeled double-stranded DNA (top) or single-stranded RNA (bottom) in condensates of mEGFP-SFiNX (4 µM). (G) Confocal images showing ability of indicated, fluorescein-labeled SFiNX variants (concentration: 10 µM; scale bar, 20 µm) to form condensates. (H) Shown are droplet number and area per droplet of three microscopic fields of fluorescein-labeled SFiNX variants at indicated concentration (from representative images in G; Supplemental Fig. S7C). (I) Shown are droplet number and area per droplet of three microscopic fields of fluorescein-labeled SFiNX variants at indicated concentration (from representative images in Supplemental Fig. S7D). (J) Confocal images (scale bar, 20 µm) showing enrichment (ssRNA) or exclusion (dsDNA) of Alexa 647-labeled nucleic acids in condensates of fluorescein-labeled SFiNX[HTH-mut] (4 µM).

Similar articles

Cited by

References

    1. Adams PD, Grosse-Kunstleve RW, Hung LW, Ioerger TR, McCoy AJ, Moriarty NW, Read RJ, Sacchettini JC, Sauter NK, Terwilliger TC. 2002. PHENIX: building new software for automated crystallographic structure determination. Acta Crystallogr D Biol Crystallogr 58: 1948–1954. 10.1107/S0907444902016657 - DOI - PubMed
    1. Alberti S, Gladfelter A, Mittag T. 2019. Considerations and challenges in studying liquid–liquid phase separation and biomolecular condensates. Cell 176: 419–434. 10.1016/j.cell.2018.12.035 - DOI - PMC - PubMed
    1. Allshire RC, Madhani HD. 2018. Ten principles of heterochromatin formation and function. Nat Rev Mol Cell Biol 19: 229–244. 10.1038/nrm.2017.119 - DOI - PMC - PubMed
    1. Aravin AA, Hannon GJ, Brennecke J. 2007. The Piwi-piRNA pathway provides an adaptive defense in the transposon arms race. Science 318: 761–764. 10.1126/science.1146484 - DOI - PubMed
    1. Barbar E. 2008. Dynein light chain LC8 is a dimerization hub essential in diverse protein networks. Biochemistry 47: 503–508. 10.1021/bi701995m - DOI - PubMed

Publication types

MeSH terms