. 2021 Jun 1;81(11):3092-3104.
doi: 10.1158/0008-5472.CAN-20-2673. Epub 2021 Feb 11.

Rapid Depletion of Intratumoral Regulatory T Cells Induces Synchronized CD8 T- and NK-cell Activation and IFNγ-Dependent Tumor Vessel Regression

Affiliations

Rapid Depletion of Intratumoral Regulatory T Cells Induces Synchronized CD8 T- and NK-cell Activation and IFNγ-Dependent Tumor Vessel Regression

Yutaka Kurebayashi et al. Cancer Res. .

Abstract

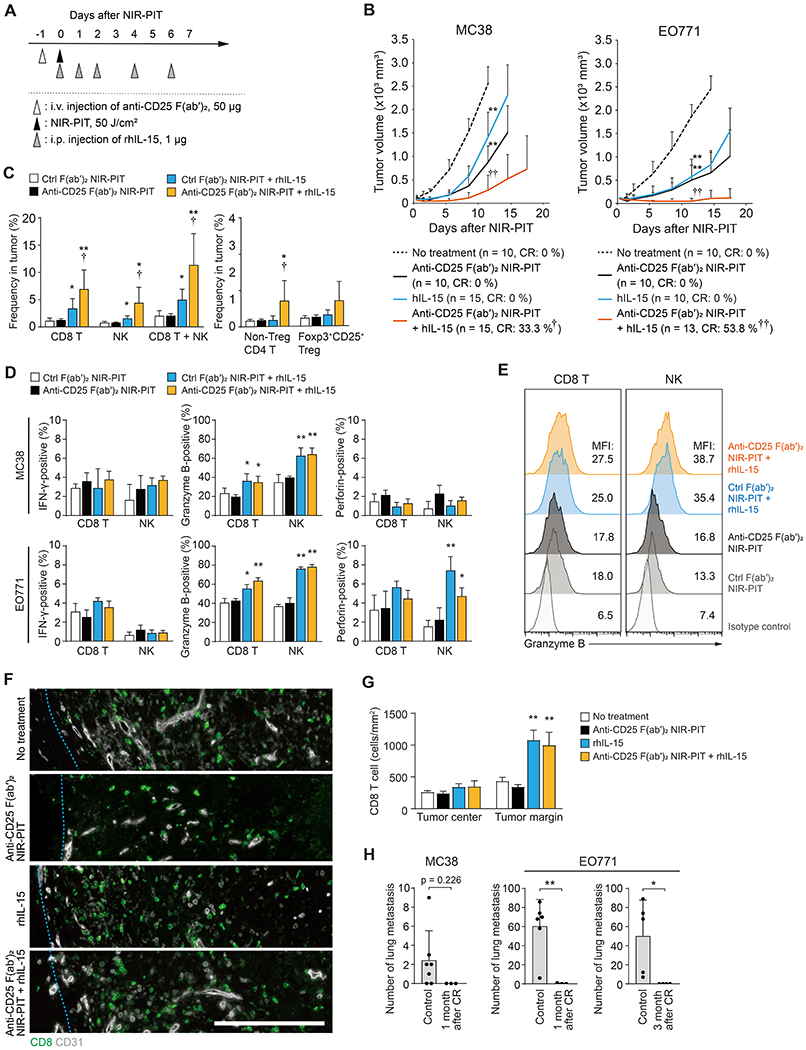
Regulatory T cells (Tregs) are known to inhibit antitumor immunity, yet the specific mechanism by which intratumoral Tregs promote tumor growth remains unclear. To better understand the roles of intratumoral Tregs, we selectively depleted tumor-infiltrating Tregs using anti-CD25-F(ab')2 near-infrared photoimmunotherapy. Depletion of tumor-infiltrating Tregs induced transient but synchronized IFNγ expression in CD8 T and natural killer (NK) cells. Despite the small fraction of CD8 T and NK cells contained within examined tumors, IFNγ produced by these CD8 T and NK cells led to efficient and rapid tumor vessel regression, intratumoral ischemia, and tumor necrosis/apoptosis and growth suppression. IFNγ receptor expression on vascular endothelial cells was required for these effects. Similar findings were observed in the early phase of systemic Treg depletion in tumor-bearing Foxp3DTR mice; combination with IL15 therapy further inhibited tumor growth and achieved increased complete regression. These results indicate the pivotal roles of intratumoral Tregs in maintaining tumor vessels and tumor growth by suppressing CD8 T and NK cells from producing IFNγ, providing insight into the mechanism of Treg-targeting therapies. SIGNIFICANCE: Intratumoral Treg depletion induces synchronized intratumoral CD8 T- and NK-cell activation, IFNγ-dependent tumor vessel regression, and ischemic tumor necrosis/apoptosis, indicating the roles of intratumoral Tregs to support the tumor vasculature. GRAPHICAL ABSTRACT: http://cancerres.aacrjournals.org/content/canres/81/11/3092/F1.large.jpg.


Conflict of interest statement

Conflict of interest statement

P.L.C., H.K., and N.S. have filed U.S. national and international patent applications for near infrared photoimmunotherapy of suppressor cells to treat cancer used in this study.

Regarding C.O.: This project has been funded in whole or in part with federal funds from the National Cancer Institute, National Institutes of Health, under Contract No. HHSN261200800001E and 75N910D00024. The content of this publication does not necessarily reflect the views or policies of the Department of Health and Human Services, nor does mention of trade names, commercial products, or organizations imply endorsement by the U.S. Government.

Figures

Figure 1.
Figure 1.. Selective depletion of intratumoral Tregs suppresses tumor growth.
(A) Selective depletion of intratumoral Tregs analyzed 30 minutes after anti-CD25-F(ab′)2 NIR-PIT on MC38 tumor (approximately 100 mm3). Representative flow cytometry data showing frequency of CD25+Foxp3+ Tregs in CD3+CD4+ T cells in indicated tissues (n = 3, each). (B) Frequency and cell number of CD3+CD4+CD25+Foxp3+ Tregs and CD3+CD4+Foxp3- non-Treg cells in total cells in MC38 tumor 30 minutes after control-F(ab′)2 or anti-CD25-F(ab′)2 NIR-PIT, analyzed by flow cytometry (n = 3, each). (C) Changes in the frequency of Foxp3+CD25+ Tregs among CD3+CD4+ T cells in MC38 and EO771 tumors over 4 days after anti-CD25-F(ab′)2 NIR-PIT, analyzed by flow cytometry (n = 3 at each time point). (D) Frequency of indicated subsets of lymphocytes in total cells in untreated MC38, EO771, LL/2, and 4T1 tumors, analyzed by flow cytometry (n ≥ 5, each). *: compared to MC38 tumor, †: compared to EO771 tumor. (E) Tumor growth after control-F(ab′)2 or anti-CD25-F(ab′)2 NIR-PIT on MC38, EO771, LL/2, and 4T1 tumors. * and †: p < 0.05, ** and ††: p < 0.01.
Figure 2.
Figure 2.. IFN-γR expression in non-bone-marrow-derived stromal cells is required for the anti-tumor effect of intratumoral Treg depletion.
(A) Induction of IFN-γ and perforin, but not TNF-α and granzyme B, in CD3+CD8+ T and CD45+NK1.1+ NK cells 30 minutes after anti-CD25-F(ab′)2 on MC38 tumor, analyzed by flow cytometry (n ≥ 4, each). Tumor tissues were minced and incubated with brefeldin A (4 hours) without exogenous stimulation before flow cytometry analysis. Refer to Figure S5 for results after PMA/ionomycin stimulation. (B) Changes in the frequency of IFN-γ or perforin-expressing cells in CD3+CD8+ T cells and CD45+NK1.1+ NK cells, using the method depicted in (A), in MC38 and EO771 tumors following anti-CD25-F(ab′)2 NIR-PIT (n ≥ 4 at each time point). (C and D) Anti-tumor effect of anti-CD25-F(ab′)2 NIR-PIT on MC38 tumor was abrogated by intravenous injection of anti-IFN-γ antibody (100 μg, one day before NIR-PIT) (C) and in Ifngr1−/− mice (D). (E and F) Anti-tumor effect of anti-CD25-F(ab′)2 NIR-PIT on MC38 tumor was abrogated in Ifngr1−/− mice reconstituted with WT bone-marrow (WTIfngr1−/−) (E), while that was maintained in WT mice reconstituted with Ifngr1−/− bone-marrow (Ifngr1−/−WT ) (F). *: p < 0.05, **: p < 0.01.
Figure 3.
Figure 3.. Selective depletion of intratumoral Tregs causes IFN-γ-dependent rapid vessel regression.
(A) Representative immunohistochemistry of CD31 (Top), DyLight 594-conjugated Tomato-lectin and CD31 (Tomato-lectin perfusion assay, Middle), and Collagen IV and CD31 (Bottom), 4 hours after control-F(ab′)2 or anti-CD25-F(ab′)2 NIR-PIT on MC38 tumor (n ≥ 3, each). Bar: 100 μm. (B and C) Quantitation of regressed vessels (B) and vessel perfusion (C) on immunohistochemistry, as in (A), at indicated time points following control-F(ab′)2 or anti-CD25-F(ab′)2 NIR-PIT on MC38 tumor (n ≥ 3 at each time point). (D) Quantitation of vessel density on CD31 immunohistochemistry at indicated time points after anti-CD25-F(ab′)2 NIR-PIT on MC38 tumor (n ≥ 3 at each time point). (E) CD25 was not expressed in endothelial cells (CD45-CD31+) in MC38 tumor, analyzed by flow cytometry (n = 3, representative data). (F) Vessel perfusion in MC38 tumors, analyzed by Tomato-lectin perfusion assay, was maintained in Ifngr1−/− and WTIfngr1−/− mice, but was impaired in Ifngr1−/−WT bone-marrow chimera mice, 4 hours after anti-CD25-F(ab′)2 NIR-PIT (n = 3, each). (G and H) Impaired tumor vessel perfusion, analyzed by Tomato-lectin perfusion assay, in early phase of Treg depletion in MC38 tumor-bearing Foxp3DTR mice. Diphtheria toxin (DT, 25 ng/g) was intraperitoneally injected on Day −3, −2, and −1 of analysis. Anti-IFN-γ antibody injection (100 μg on Day −3 and −1) abrogated impaired perfusion. Representative immunohistochemistry (G) and quantitation summary (H) (n = 3, each). Bar: 100 μm. (I) Transmission electron microscope images show degeneration of endothelial cells (white arrowheads: obscured intracellular organelle with or without cytoplasmic vacuolation, black arrowheads: swollen mitochondria and increased electron densities in cytoplasm) 4 hours after anti-CD25-F(ab′)2 NIR-PIT on MC38 tumor. Bar: 2 μm. (J) Quantitation of degenerated vessels in (I). In each group, 22 vessels from 2 tumors were analyzed with χ2 test. *: compared to no treatment, †: compared to control-F(ab′)2 NIR-PIT, * and †: p < 0.05, ** and ††: p < 0.01.
Figure 4.
Figure 4.. IFN-γ-dependent rapid vessel regression is followed by tumor ischemia and necrosis/apoptosis of tumor.
(A and B) Flow cytometry indicates increased pimonidazole positivity in CD45- tumor cells and CD45+ immune cells in pimonidazole-binding assay following anti-CD25-F(ab′)2 NIR-PIT. Representative histograms at 18 hours after anti-CD25-F(ab′)2 NIR-PIT (A) and changes of pimonidazole+ hypoxic tumor and immune cell frequencies in MC38 and EO771 tumors (B, n = 3 at each time point). (C and D) Increased pimonidazole+ areas in pimonidazole-binding assay in MC38 tumors 18 hours after anti-CD25-F(ab′)2 NIR-PIT. Representative immunohistochemistry (C) and quantitation summary (D) (n = 3, each). Bar: 250 μm. (E and F) Flow cytometry analysis of pimonidazole positivity in CD45- tumor cells and CD45+ immune cells in pimonidazole-binding assay, 18 hours after anti-CD25-F(ab′)2 NIR-PIT on MC38 tumor in Ifngr1−/−, and Ifngr1−/−WT and WTIfngr1−/− bone-marrow chimera mice. Representative histograms (E) and quantitation summery in CD45- tumor cells (F) (n ≥ 3, each). (G and H) Increased necrotic areas positive for propidium iodide in propidium iodide injection assay, observed 18 hours after anti-CD25-F(ab′)2 NIR-PIT on MC38 tumor, which were abrogated in Ifngr1−/− mice. Representative histological images (G) and quantitation summary (H) (n = 3, each). Bar: 250 μm. (I and J) Increased TUNEL-positive apoptotic cells 18 hours after anti-CD25-F(ab′)2 NIR-PIT on MC38, which was abrogated in Ifngr1−/− mice. Representative histological images (I) and quantitation summary (J) (n = 3, each). Bar: 250 μm. *: p < 0.05, **: p < 0.01.
Figure 5.
Figure 5.. IFN-γ directly targets endothelial cells to cause vessel regression.
(A) IFN-γRI expression in endothelial cells (CD45-panCK-CD31+), pericytes (CD45-panCK-CD31-NG2+), and fibroblasts (CD45-panCK-CD31-PDFGRα+) in MC38 tumors in WT, Ifngr1−/−, or Tie2CreIfngr1flox/flox mice, analyzed by flow cytometry (n = 2, each). (B) Anti-tumor effect of anti-CD25-F(ab′)2 NIR-PIT on MC38 tumors was abrogated in Tie2CreIfngr1flox/flox mice. Ifngr1flox/flox mice were used as control. (C) Anti-tumor effect of anti-CD25-F(ab′)2 NIR-PIT on MC38 tumors was abrogated in WTTie2CreIfngr1flox/flox mice. WTIfngr1flox/flox mice were used as control. (D and E) Immunohistochemistry of DyLight 594-conjugated Tomato-lectin and CD31 (endothelial cells) in Tomato-lectin perfusion assay, 18 hour after anti-CD25-F(ab′)2 NIR-PIT on MC38 tumors in Ifngr1flox/flox or Tie2CreIfngr1flox/flox mice. Representative images (D, Bar: 250 μm) and quantitation summary (E) (n = 3, each). (F and G) Immunohistochemistry of pimonidazole and CD31 in pimonidazole-binding assay, 18 hour after anti-CD25-F(ab′)2 NIR-PIT on MC38 tumors in Ifngr1flox/flox or Tie2CreIfngr1flox/flox mice. Representative images (F, Bar: 500 μm) and quantitation summary (G). (n = 3, each). **: p < 0.01.
Figure 6.
Figure 6.. Depletion of intratumoral Tregs causes IFN-γ/phospho-STAT1 signaling around tumor vessels.
(A and B) Perivascular localization of CD8+ T cells, NKp46+ NK cells, and CD4+Foxp3+ Tregs analyzed by immunohistochemistry in untreated MC38 tumors. Representative images (A, Bar: 100 μm) and frequency of indicated lymphocytes located in indicated distances from tumor vessels (B) (n = 3, each). (C) Increased phospho-STAT1 (Tyr701) positivity around tumor vessels analyzed by immunohistochemistry 60 minutes after anti-CD25-F(ab′)2 NIR-PIT (n = 3, each, representative images). For negative control, frozen sections were treated with lambda protein phosphatase (λ-PP) before the phospho-STAT1 staining. Inset: phospho-STAT1 (Tyr701) positivity CD31+ endothelial cells. Bar: 500 μm. (D) Percentage of phospho-STAT1-positive areas analyzed by distance from tumor vessels (Top) and phospho-STAT1-positive tumor vessels (Bottom) in (C) (n = 3, each). *: p < 0.05, **: p < 0.01.
Figure 7.
Figure 7.. Combination of rhIL-15 treatment with anti-CD25-F(ab’)2 NIR-PIT synergize to increase complete eradication of tumor.
(A) Regimen of anti-CD25-F(ab′)2 NIR-PIT and rhIL-15 combination therapy. (B) Anti-CD25-F(ab′)2 NIR-PIT and rhIL-15 synergistically impaired growth of MC38 and EO771 tumors. Sample size and complete regression (CR) rate in each group are indicated. χ2 test was used to calculate p-values of CR ratio. *: compared to no treatment group, †: compared to other three groups. See Supplemental Figure 13A for the survival curves. (C) Frequency of indicated lymphocyte subsets 5 days after indicated treatments on MC38 tumor, analyzed by flow cytometry (n ≥ 5, each). *: compared to no treatment group and anti-CD25-F(ab′)2 NIR-PIT group, †: compared to rhIL-15 group. (D) Positivity of IFN-γ, granzyme B, and perforin in CD3+CD8+ T cells or CD45+NK1.1+ NK cells, analyzed by flow cytometry 3 days after indicated treatments on MC38 or EO771 tumor (Day 3, n ≥ 5, each) *: compared to no treatment group and anti-CD25-F(ab′)2 NIR-PIT group, †: compared to rhIL-15 group. (E) Granzyme B expression in CD3+CD8+ T cells or CD45+CD3-NK1.1+ NK cells analyzed by flow cytometry 3 days after indicated treatments on MC38 tumor (n ≥ 5). (F and G) rhIL-15 treatment induced infiltration of CD8 T cells to the periphery of EO771 tumors (Day 3). Representative immunohistochemistry (F, Bar: 250 μm) and Quantitation summary (G). (n = 3, each). (H) Prevention of lung metastasis formation after re-challenge by intravenous injection of 1×10⁶ MC38 or EO771 tumor cells at 1 month or 3 months of complete regression by anti-CD25-F(ab′)2 NIR-PIT and rhIL-15 combination therapy (n ≥ 3, each). * and †: p < 0.05, ** and ††: p < 0.01.

Similar articles

Cited by

References

    1. Vignali DA, Collison LW, Workman CJ. How regulatory T cells work. Nat Rev Immunol 2008;8:523–32 - PMC - PubMed
    1. Burzyn D, Benoist C, Mathis D. Regulatory T cells in nonlymphoid tissues. Nature immunology 2013;14:1007–13 - PMC - PubMed
    1. Speiser DE, Ho PC, Verdeil G. Regulatory circuits of T cell function in cancer. Nat Rev Immunol 2016;16:599–611 - PubMed
    1. Curiel TJ, Coukos G, Zou L, Alvarez X, Cheng P, Mottram P, et al. Specific recruitment of regulatory T cells in ovarian carcinoma fosters immune privilege and predicts reduced survival. Nature medicine 2004;10:942–9 - PubMed
    1. Fridman WH, Pages F, Sautes-Fridman C, Galon J. The immune contexture in human tumours: impact on clinical outcome. Nature reviews Cancer 2012;12:298–306 - PubMed

MeSH terms