. 2021 Apr 15;81(8):2044-2055.
doi: 10.1158/0008-5472.CAN-20-2041. Epub 2021 Feb 11.

The miR-181a-SFRP4 Axis Regulates Wnt Activation to Drive Stemness and Platinum Resistance in Ovarian Cancer

Affiliations

The miR-181a-SFRP4 Axis Regulates Wnt Activation to Drive Stemness and Platinum Resistance in Ovarian Cancer

Anil Belur Nagaraj et al. Cancer Res. .

Abstract

Wnt signaling is a major driver of stemness and chemoresistance in ovarian cancer, yet the genetic drivers that stimulate its expression remain largely unknown. Unlike other cancers, mutations in the Wnt pathway are not reported in high-grade serous ovarian cancer (HGSOC). Hence, a key challenge that must be addressed to develop effective targeted therapies is to identify nonmutational drivers of Wnt activation. Using an miRNA sensor-based approach, we have identified miR-181a as a novel driver of Wnt/β-catenin signaling. miR-181ahigh primary HGSOC cells exhibited increased Wnt/β-catenin signaling, which was associated with increased stem-cell frequency and platinum resistance. Consistent with these findings, inhibition of β-catenin decreased stem-like properties in miR-181ahigh cell populations and downregulated miR-181a. The Wnt inhibitor SFRP4 was identified as a novel target of miR-181a. Overall, our results demonstrate that miR-181a is a nonmutational activator of Wnt signaling that drives stemness and chemoresistance in HGSOC, suggesting that the miR-181a-SFRP4 axis can be evaluated as a novel biomarker for β-catenin-targeted therapy in this disease. SIGNIFICANCE: These results demonstrate that miR-181a is an activator of Wnt signaling that drives stemness and chemoresistance in HGSOC and may be targeted therapeutically in recurrent disease.


Conflict of interest statement

Conflict of Interest: MK has equity in 3+2 Pharma LLC and is a consultant for Fuji Film Pharma and Lynk Pharmaceuticals.

Figures
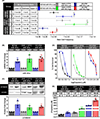
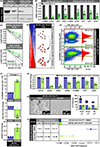
Figure 1:
Figure 1:. miR-181aHigh EOC Tumor Initiating Cells exhibit increased cisplatin resistance and β-catenin protein expression
(A) Graph of log(Fraction Non-Responding) vs number of cells (left) and Stem Cell Frequency Ratio for HEYA8 miR-181aLow and miR-181aHigh cells, OV81.2 CP10 miR-181aLow and miR-181aHigh cells, and OCI-P5X miR-181aLow and miR-181aHigh cells. (B) Graph of miR-181a expression in miR-181aLow vs miR-181aHigh EOC cell lines. (C) Western blots showing β-catenin expression in miR-181aLow vs miR-181aHigh EOC cell lines with quantification below. (D) Graph showing cell viability dose-response curves for miR-181aLow vs miR-181aHigh EOC cell lines in response to cisplatin treatment. (E) Graph showing calculated IC50 values for miR-181aLow vs miR-181aHigh EOC cell lines in response to cisplatin treatment. All data are representative of 3 independent experiments. * = p<0.05, ** = p<0.005, *** = p<0.0005. Error bars indicate ±standard deviation unless otherwise stated. Error bars for the stem cell frequency graphs indicate upper and lower 95% confidence intervals. Abbreviations: NR- Non-Responding, SC- Stem Cell.
Figure 2:
Figure 2:. Wnt/β-catenin signaling is enriched in miR-181a high cells in EOC
(A) Graphs of stemness and WNT marker expression in the miR-181aLow vs miR-181aHigh EOC cells. (B) Representative immunofluorescence micrographs of miR-181aLow and miR-181aHigh EOC cells stained for active β-catenin. (C) Quantification of immunofluorescence micrographs for active β-catenin. (D) Graph of TOP-eGFP reporter activity for HEYA8, OCI-P5X, and OV81.2 CP10 miR-181aLow vs miR-181aHigh EOC cells. All data are representative of 3 independent experiments. * = p<0.05, ** = p<0.005, *** = p<0.0005. Error bars indicate ±standard deviation unless otherwise stated. Abbreviations: RLA- Relative Luciferase Activity.
Figure 3:
Figure 3:. WNT/β-catenin inhibitor SFRP4 is a novel target of miR-181a
(A) Graph showing SFRP4 mRNA expression in the miR-181aLow vs miR-181aHigh EOC cells. (B) Western Blot showing SFRP4 protein expression in the miR-181aLow vs miR-181aHigh EOC cells with quantification below. (C) Graph showing SFRP4 3’UTR Reporter Activity for the miR-181aLow vs miR-181aHigh EOC cells. (D) Graph showing tumor burden for the in vivo limiting dilution tumor formation HEYA8 miR-181aLow vs miR-181aHigh mouse groups. (E) Representative images of miR-181aLow vs miR-181aHigh tumors (left) for the in vivo limiting dilution tumor formation assay with quantification of the number of tumors formed in each group (right). (F) Graph of tumor kinetics for the HEYA8 miR-181aLow vs miR-181aHigh mouse groups. (G) Western blot showing β-catenin protein expression in the HEYA8 miR-181aLow and HEYA8 miR-181aHigh tumors with quantification below. (H) Graph showing SFRP4 mRNA expression in the HEYA8 miR-181aLow and HEYA8 miR-181aHigh tumors. (I) Box plot showing differences in miR-181a, SFRP4, CD44, and β-catenin expression in 22 matched primary vs recurrent patient high grade serous ovarian cancer tumors. Individual sets of matched primary and recurrent tumors are connected by solid lines. Green lines indicate a decrease in expression between primary vs recurrent and red lines indicate an increase between primary vs recurrent. All data are representative of 3 independent experiments. * = p<0.05, ** = p<0.005, *** = p<0.0005. Error bars indicate ±standard deviation unless otherwise stated. Abbreviations: RLA- Relative Luciferase Activity.
Figure 4:
Figure 4:. SFRP4 inhibits tumor initiating cell properties in miR-181a high EOC cells
(A) Western blot showing expression of active β-catenin and SFRP4 in OCI-P5X miR-181aHigh pTOL vs pSFRP4 cells. (B) Quantification of active β-catenin and SFRP4 protein expression in OCI-P5X miR-181aHigh and FT237 pmiR-181a pTOL vs pSFRP4 cells. (C) Micrographs showing representative ELDA tumor spheres for OCI-P5X miR-181aHigh pTOL vs pSFRP4 cells. (D) Graph of log(Fraction Non-Responding) vs number of cells (left) and Stem Cell Frequency Ratio (right) for OCI-P5X miR-181aHigh pTOL vs pSFRP4 cells. (E) Graph showing mRNA expression of stemness and WNT markers for OCI-P5X miR-181aHigh and FT237 pmiR-181a pTOL vs pSFRP4 cells. (G) Graph showing TOPFLASH luciferase activity for OCI-P5X miR-181aHigh and FT237 pmiR-181a pTOL vs pSFRP4 cells. All data are representative of 3 independent experiments. * = p<0.05, ** = p<0.005, *** = p<0.0005. Error bars indicate ±standard deviation unless otherwise stated. Abbreviations: NR- Non-Responding, SC- Stem Cell, RLA- Relative Luciferase Activity.
Figure 5:
Figure 5:. Inhibition of miR-181a activated WNT signaling decreases EOC tumor initiating cell properties
(A) Western blot showing β-catenin expression in HEYA8 and OV81.2 CP10 miR-181aHigh shβcat vs shscram cells. (B) Graph showing decreased mRNA expression of stemness and WNT markers in HEYA8 and OV81.2 CP10 miR-181aHigh shβcat vs shscram cells. (C) Graph showing decreased stem cell frequency in HEYA8 and OV81.2 CP10 miR-181aHigh shβcat vs shscram cells. (D) Diagram showing strategy for targeting miR-181a/WNT high EOC cells using ICG-001. (E) Graphs showing mCHERRY fluorescence in HEYA8 miR-181aHigh cells after 4 passages of Q.O.D. DMSO or 40 μM ICG-001 treatment. (F) Graphs depicting mCHERRY intensity (top), miR-181a expression (middle), and SFRP4 expression (bottom) in HEYA8 miR-181aHigh cells after 4 passages of Q.O.D. DMSO or 40 μM ICG-001 treatment. (G) Graph showing mRNA expression levels for HEYA8 miR-181aHigh cells treated with either DMSO or 5 μM ICG-001 for 24 hours. (H) Representative micrographs showing tumor sphere formation for HEYA8 miR-181aHigh cells treated with either DMSO or 5 μM ICG-001 for 24 hours. Quantification below. (I) Graph of log(Fraction Non-Responding) vs number of cells (left) and Stem Cell Frequency Ratio (right) for HEYA8 miR-181aHigh treated with either DMSO or 5 μM ICG-001 for 24 hours. All data are representative of 3 independent experiments. * = p<0.05, ** = p<0.005, *** = p<0.0005. Error bars indicate ±standard deviation unless otherwise stated. Abbreviations: NR- Non-Responding, SC- Stem Cell.
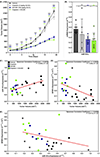
Figure 6:
Figure 6:. Therapeutic targeting of miR-181a-WNT signaling decreases EOC tumor growth in vivo
(A) Graph showing tumor kinetics for the PBS, Cisplatin, ICG-001, and Cisplatin + ICG-001 treatment groups. (B) Graph showing miR-181a expression across the PBS, Cisplatin, ICG-001, and Cisplatin + ICG-001 treatment groups. (C) Graph showing correlation between miR-181a (top) and SFRP4 (bottom) expression and final tumor volume for each treatment group. Data points are color coded according to treatment group. (D) Graph showing correlation between miR-181a and SFRP4 expression for each treatment group tumor. Data points are color coded according to treatment group. All data are representative of 3 independent experiments. * = p<0.05, ** = p<0.005, *** = p<0.0005. Error bars indicate ±standard deviation unless otherwise stated.

References

    1. Siegel RL, Miller KD, Jemal A. Cancer statistics, 2020. CA Cancer J Clin 2020; 70: 7–30. - PubMed
    1. Choi YP, Shim HS, Gao M-Q, Kang S, Cho NH. Molecular portraits of intratumoral heterogeneity in human ovarian cancer. Cancer Lett 2011; 307: 62–71. - PubMed
    1. Dagogo-Jack I, Shaw AT. Tumour heterogeneity and resistance to cancer therapies. Nat. Rev. Clin. Oncol. 2018; 15: 81–94. - PubMed
    1. Perets R, Wyant GA, Muto KW, Bijron JG, Poole BB, Chin KT et al. Transformation of the Fallopian Tube Secretory Epithelium Leads to High-Grade Serous Ovarian Cancer in Brca;Tp53;Pten Models. Cancer Cell 2013; 24: 751–765. - PMC - PubMed
    1. Karst AM, Levanon K, Drapkin R. Modeling high-grade serous ovarian carcinogenesis from the fallopian tube. Proc Natl Acad Sci 2011; 108: 7547–7552. - PMC - PubMed

Publication types

MeSH terms