An official website of the United States government
The .gov means it’s official.
Federal government websites often end in .gov or .mil. Before
sharing sensitive information, make sure you’re on a federal
government site.
The site is secure.
The https:// ensures that you are connecting to the
official website and that any information you provide is encrypted
and transmitted securely.
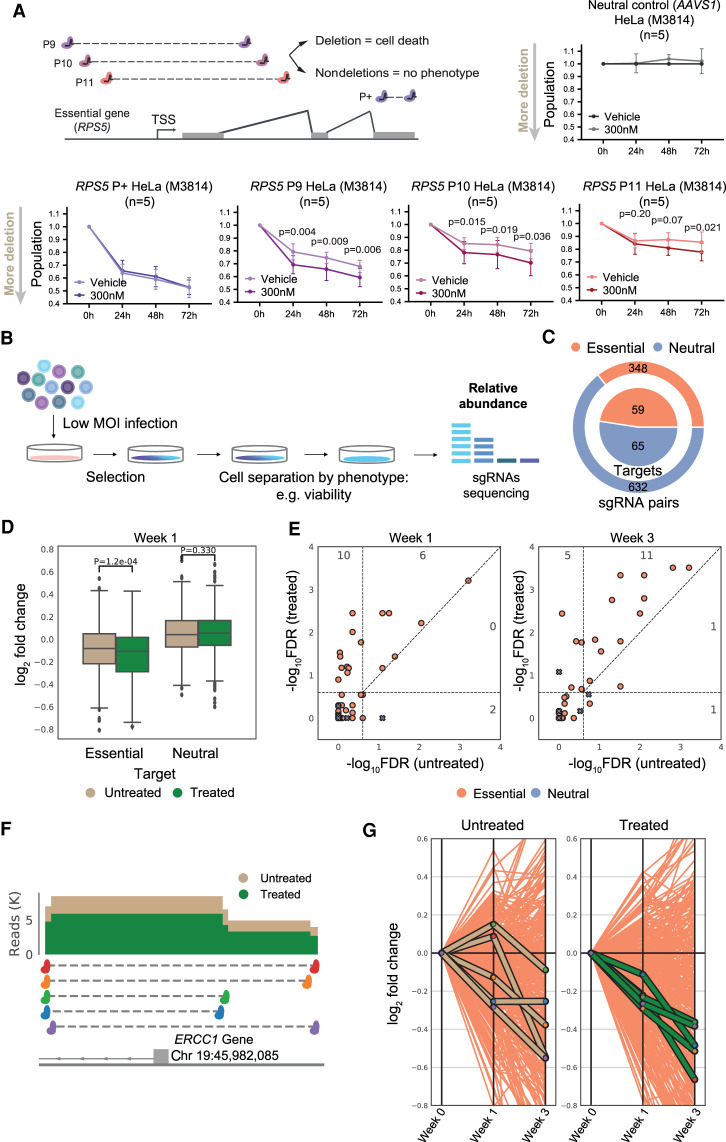
CRISPR-Cas9 deletion (CRISPR-del) is the leading approach for eliminating DNA from mammalian cells and underpins a variety of genome-editing applications. Target DNA, defined by a pair of double-strand breaks (DSBs), is removed during nonhomologous end-joining (NHEJ). However, the low efficiency of CRISPR-del results in laborious experiments and false-negative results. By using an endogenous reporter system, we show that repression of the DNA-dependent protein kinase catalytic subunit (DNA-PKcs)-an early step in NHEJ-yields substantial increases in DNA deletion. This is observed across diverse cell lines, gene delivery methods, commercial inhibitors, and guide RNAs, including those that otherwise display negligible activity. We further show that DNA-PKcs inhibition can be used to boost the sensitivity of pooled functional screens and detect true-positive hits that would otherwise be overlooked. Thus, delaying the kinetics of NHEJ relative to DSB formation is a simple and effective means of enhancing CRISPR-deletion.
Poor deletion efficiency of paired sgRNAs and CRISPR-deletion (CRISPR-del) model. ( A )…
Figure 1.
Poor deletion efficiency of paired sgRNAs and CRISPR-deletion (CRISPR-del) model. (A) Model for CRISPR-del and its improvement by inhibition of nonhomologous end-joining (NHEJ). (B) Reanalysis of significant growth-promoting gene “hits” identified in the CRISPR-del negative selection screen in Huh7 cells from Zhu et al. (2016). Each hit is targeted by several individual paired sgRNAs. Histogram displays the percentage of paired sgRNAs that effectively perturb their target gene. The dashed line represents the median (42.9%). (C) Scatterplot displays paired sgRNAs targeting gene hits from B. The x-axis indicates the mean of the two sgRNAs predicted on-target efficiency (calculated with the Rule Set II scoring algorithm from Doench et al. 2016); y-axis, log2-transformed fold-change in paired sgRNA detection after cell passaging (growth phenotype). R indicates Pearson's correlation; P, P-value.
Figure 2.
CiDER reporter system identifies DNA-PKcs…
Figure 2.
CiDER reporter system identifies DNA-PKcs inhibition as a means to increase CRISPR-del efficiency.…
Figure 2.
CiDER reporter system identifies DNA-PKcs inhibition as a means to increase CRISPR-del efficiency. (A) The CiDER endogenous reporter relies on a series of sgRNA pairs targeting exon 1 of PLXND1 gene, whose protein product is detected by flow cytometry. (B) CiDER measurements of CRISPR-del efficiency over a range of times between sgRNA delivery and cell harvesting (mean, standard deviation). (C) Independent evaluation of CRISPR-del efficiency in sorted plexin D1–negative and D1–positive cells. (Top) Representative fluorescent activated cell sorting (FACS) plot. Plexin D1–negative (APC-) and Plexin D1–positive cells (APC+) are gated. (Bottom) The fraction of nondeleted alleles in each population quantified by qPCR (mean, standard deviation). The black bar corresponds to a nontargeting control used for normalization. Green bars correspond to sorted HeLa cells with pgRNAs targeting PLXND1 (P3). (D) CRISPR-del efficiency measured by CiDER in HeLa upon DNA-PKcs inhibition (mean, standard deviation, one-tailed paired t-test). (E, top) Representative raw flow cytometry plots for HeLa upon DNA-PKcs inhibition. Plexin D1–positive cells are gated, and numbers correspond to percentage of cells. (Bottom) Representative images of individual sorted, stained HeLa cells. (F) CiDER measurements of CRISPR-del efficiency in HeLa upon DNA-PKcs inhibition with indicated small molecules (values: mean plexin D1–positive cells; *P < 0.05, one-tailed paired t-test).
DNA-PKcs inhibition boosts CRISPR-del independent of cell, readout, or sgRNA delivery method. ( …
Figure 3.
DNA-PKcs inhibition boosts CRISPR-del independent of cell, readout, or sgRNA delivery method. (A) CRISPR-del efficiency of CiDER in HeLa upon DNA ligase 4 inhibition (mean). (B) CiDER measurement of CRISPR-del efficiency in HCT116 and HEK293T cell lines upon DNA-PKcs inhibition (mean, standard deviation, one-tailed paired t-test). (C) CRISPR-del efficiency at MALAT1-enhancer upon DNA-PKcs inhibition. (Left) The fraction of WT allele quantified by qPCR (mean, standard deviation, one-tailed paired t-test). (Center) The pgRNAs, PCR primers, and a representative agarose gel from the genomic PCR of the region. (Right) Quantification of the KO band from the gel. (D) CRISPR-del efficiency of CiDER in HeLa as a result of initiating DNA-PKcs inhibition at 24 h after lentiviral infection (MOI = 0.3).
Figure 4.
Applying DNA-PKcs inhibition to pooled…
Figure 4.
Applying DNA-PKcs inhibition to pooled CRISPR-del screens. ( A ) Testing the functional…
Figure 4.
Applying DNA-PKcs inhibition to pooled CRISPR-del screens. (A) Testing the functional benefit of DNA-PKcs inhibition. (Left) Experimental setup, with pgRNAs targeting the transcription start site (TSS) of the essential gene RPS5. A positive control sgRNA pair (P+) target the gene open reading frame and thus cause loss of function independent of deletion. (Right) Viability assays with pgRNAs targeting the nonessential AAVS1 locus. (Bottom) Viability assays after RPS5 TSS deletion (mean, standard deviation, one-tailed paired t-test). (B) Design of a typical pooled high-throughput screen to identify essential genes. (C) Composition of pgRNA library targeting both essential genes’ TSS and nonessential neutral loci. (D) Log2 fold-change (LFC) in abundance of indicated pgRNAs compared with day 0. Significance calculated by two-tailed t-test. (E) Hits reported by MAGeCK at two timepoints. Negative log10 false-discovery rate (−log10FDR) for treated and untreated samples are indicated in the y- and x-axis, respectively. Each point represents a target. A hit is called a true positive (TP) if it is targeting an essential gene and has an FDR <0.25. Points above the diagonal indicate hits with a lower FDR (higher −log10FDR) in the treated sample. Numbers in plot reflect TPs in each combination of treated/untreated cells. (F) pgRNAs targeting ERCC1 TSS: read coverage for untreated and treated samples at 1 wk. (G) Fold-change variation for individual ERCC1 pgRNAs across timepoints: x-axis, timepoint (0, 1, and 3 wk); y-axis, LFC in abundance. Orange lines represent all pgRNAs targeting essential genes.
Antoniani C, Meneghini V, Lattanzi A, Felix T, Romano O, Magrin E, Weber L, Pavani G, El Hoss S, Kurita R, et al. 2018. Induction of fetal hemoglobin synthesis by CRISPR/Cas9-mediated editing of the human β-globin locus. Blood 131: 1960–1973. 10.1182/blood-2017-10-811505
-
DOI
-
PubMed
Aparicio-Prat E, Arnan C, Sala I, Bosch N, Guigó R, Johnson R. 2015. DECKO: single-oligo, dual-CRISPR deletion of genomic elements including long non-coding RNAs. BMC Genomics 16: 846. 10.1186/s12864-015-2086-z
-
DOI
-
PMC
-
PubMed
Barretina J, Caponigro G, Stransky N, Venkatesan K, Margolin AA, Kim S, Wilson CJ, Lehár J, Kryukov GV, Sonkin D, et al. 2012. The Cancer Cell Line Encyclopedia enables predictive modelling of anticancer drug sensitivity. Nature 483: 603–607. 10.1038/nature11003
-
DOI
-
PMC
-
PubMed
Bausch-Fluck D, Hofmann A, Bock T, Frei AP, Mirkowska P, Härtlová A, Van EJ, Bourquin J. 2015. A mass spectrometric-derived cell surface protein atlas. PLoS One 10: e0121314. 10.1371/journal.pone.0121314
-
DOI
-
PMC
-
PubMed
Bergadà-Pijuan J, Pulido-Quetglas C, Vancura A, Johnson R. 2020. CASPR, an analysis pipeline for single and paired guide RNA CRISPR screens, reveals optimal target selection for long non-coding RNAs. Bioinformatics 36: 1673–1680. 10.1093/bioinformatics/btz811
-
DOI
-
PubMed