. 2021 Mar 31;41(13):2930-2943.
doi: 10.1523/JNEUROSCI.0619-20.2021. Epub 2021 Feb 11.

Outer Hair Cell Glutamate Signaling through Type II Spiral Ganglion Afferents Activates Neurons in the Cochlear Nucleus in Response to Nondamaging Sounds

Affiliations

Outer Hair Cell Glutamate Signaling through Type II Spiral Ganglion Afferents Activates Neurons in the Cochlear Nucleus in Response to Nondamaging Sounds

Catherine J C Weisz et al. J Neurosci. .

Abstract

Cochlear outer hair cells (OHCs) are known to uniquely participate in auditory processing through their electromotility, and like inner hair cells, are also capable of releasing vesicular glutamate onto spiral ganglion (SG) neurons: in this case, onto the sparse Type II SG neurons. However, unlike glutamate signaling at the inner hair cell-Type I SG neuron synapse, which is robust across a wide spectrum of sound intensities, glutamate signaling at the OHC-Type II SG neuron synapse is weaker and has been hypothesized to occur only at intense, possibly damaging sound levels. Here, we tested the ability of the OHC-Type II SG pathway to signal to the brain in response to moderate, nondamaging sound (80 dB SPL) as well as to intense sound (115 dB SPL). First, we determined the VGluTs associated with OHC signaling and then confirmed the loss of glutamatergic synaptic transmission from OHCs to Type II SG neurons in KO mice using dendritic patch-clamp recordings. Next, we generated genetic mouse lines in which vesicular glutamate release occurs selectively from OHCs, and then assessed c-Fos expression in the cochlear nucleus in response to sound. From these analyses, we show, for the first time, that glutamatergic signaling at the OHC-Type II SG neuron synapse is capable of activating cochlear nucleus neurons, even at moderate sound levels.SIGNIFICANCE STATEMENT Evidence suggests that cochlear outer hair cells (OHCs) release glutamate onto Type II spiral ganglion neurons only when exposed to loud sound, and that Type II neurons are activated by tissue damage. Knowing whether moderate level sound, without tissue damage, activates this pathway has functional implications for this fundamental auditory pathway. We first determined that OHCs rely largely on VGluT3 for synaptic glutamate release. We then used a genetically modified mouse line in which OHCs, but not inner hair cells, release vesicular glutamate to demonstrate that moderate sound exposure activates cochlear nucleus neurons via the OHC-Type II spiral ganglion pathway. Together, these data indicate that glutamate signaling at the OHC-Type II afferent synapse participates in auditory function at moderate sound levels.

Keywords: Type II spiral ganglion neurons; cochlear nucleus; glutamate signaling; granule cells; outer hair cells.


Figures

Figure 1.
Figure 1.
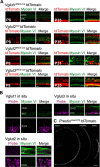
Analysis of Vglut expression in OHCs. A, The Cre-dependent tdTomato (red) fluorescent reporter mouse (Ai14) crossed to Vglut1IRESCre, Vglut2Cre, Vglut2IRESCre, or Vglut3IRESCre mice indicates expression of VGluT3 in OHCs of the cochlea at P8 and P35, and VGluT2 expression in occasional OHCs in the Vglut2Cre, but not the Vglut2IRESCre mouse lines. Hair cells are labeled with myosin VI (green). Scale bar, 20 µm. B, ISH for Vgluts1-3 in OHC, IHC, and SGN in sections of P8.5 mice. Hair cells are labeled with myosin VI (green). Scale bar, 20 µm. C, Cochlea of P8 PrestinCreERT2;tdTomato mouse injected with tamoxifen shows expression of the fluorescent reporter in OHCs of the cochlear apex, mid-turn, and base. Scale bar, 200 µm.
Figure 2.
Figure 2.
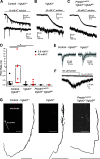
VGluT2 and VGluT3 mediate glutamate release from cochlear OHCs. A, Voltage-clamp recording from a control (Vglut3fl/fl) Type II SG afferent dendrite. Top, Application of extracellular solution with elevated 40 mm potassium generates a sustained inward current, and PSCs in the Type II afferent. Bottom, Magnification of selected PSCs. B, Voltage-clamp recording from a Type II SG afferent dendrite of a Vglut3−/− mouse. Top, Application of 40 mm potassium solution generates an inward current and PSCs in the Type II SG afferent. Bottom, Magnification of selected PSCs. C, Voltage-clamp recording from a Type II SG afferent dendrite from a PrestinCreERT2;Vglut3−/−;Vglut2fl/fl mouse. Top, Application of 40 mm potassium solution generates an inward current in the dendrites but does not generate PSCs in the Type II SG afferent. Bottom, Magnification of trace. D, Scatter plot of PSC rate in normal (5.8 mm) and elevated (40 mm) potassium solution. Each dot represents one cell. Box represents median and quartiles. *p < 0.05. E, Example traces of PSCs recorded from a Vglut3+/+ WT (top) and Vglut3−/− mouse Bottom, Ten traces overlaid (gray). Black represents average of 10 traces. F, Voltage-clamp trace from a Type II SG dendrite from a PrestinCreERT2;Vglut3/;Vglut2fl/fl mouse. Focal application of 100 μM kainate evokes an inward current (black), which is blocked by 10 μM NBQX (gray). G, Morphology of example Type II SG neuron dendrites from which recordings were performed. Dendrites were filled with AlexaFluor-488 or -594 hydrazide via the recording pipette (visible, “electrode”) and imaged with 2-photon excitation. Traced neurons are shown for better visibility. Insets, Maximum intensity projections of each neuron (left, middle, right). Right inset, two dendrites are visible from separate recordings. Scale bars, 100 μm.
Figure 3.
Figure 3.
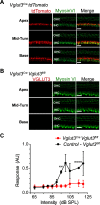
Characterization of Vglut3Cre mouse line. A, Vglut3Cre;tdTomato mouse cochlea shows that IHCs, but not OHCs, exhibit tdTomato fluorescence (red) in apex, mid-turn, and base of the cochlea of P35 mice. Hair cells are immunostained for myosin VI (green). Scale bar, 20 µm. B, No VGluT3 immunoreactivity is observed in the IHCs of Vglut3Cre;Vglut3fl/fl mice. Hair cells were also immunostained for myosin VI (green). Scale bar, 20 µm. C, Acoustic startle response is absent in the Vglut3Cre;Vglut3fl/fl mice (n = 6), but not control (Vglut3fl/fl) littermates (n = 4). AU, Arbitrary units. Data are mean ± SEM. **p < 0.01. ****p < 0.0001.
Figure 4.
Figure 4.
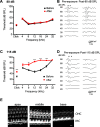
Hearing function after noise exposure. ABR thresholds measured before and 2 weeks after exposure to (A,B) 80 dB SPL or (C,D) 115 dB SPL for 1 h in Vglut3fl/fl mice. B, D, Representative traces. Numbers above traces indicate ABR wave number. Data are mean ± SEM; n = 6 mice. E, Phalloidin staining of cochlea of Vglut3fl/fl mice 2 weeks after 115 dB SPL noise exposure. Scale bar, 10 µm. **p < 0.01. ***p < 0.001.
Figure 5.
Figure 5.
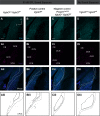
Sound-induced expression of c-Fos in the CN in response to a moderate nondamaging, 80 dB SPL, level of sound, or to no sound stimulus. A, Representative images from Vglut3Cre;Vglut3fl/fl mouse following sound exposure show c-Fos immunoreactivity (cyan) restricted to the GCD. Ai, Nissl staining (magenta). Aii, Merge of cyan and magenta channels. CB, Cerebellum. Aiii, Mask of c-Fos signal from A. Aii-Dii, Region enclosed by white dashed line indicates GCD. Region enclosed by black dashed line indicates regions of the DCN that also contain granule cells. B, Representative image of the CN of Vglut3fl/fl (positive control) mouse subjected to 80 dB SPL sound exposure shows c-Fos immunoreactivity (cyan) throughout DCN and GCD. Bi, Nissl staining of cell somata (magenta). Bii, Merge of cyan and magenta channels. Biii, Mask of c-Fos signal from B. C, Representative image from PrestinCreERT2;Vglut3−/−;Vglut2fl/fl negative control mouse following sound exposure indicates background levels of c-Fos immunoreactivity (cyan). Ci, Nissl staining (magenta). Cii, Merge of cyan and magenta channels. Ciii, Mask of c-Fos signal from C. D, Representative image from Vglut3Cre;Vglut3fl/fl mouse that was not exposed to sound indicates background levels of c-Fos immunoreactivity (cyan). Di, Nissl staining (magenta). Dii, Merge of cyan and magenta channels. Diii, Mask of c-Fos signal from D. Scale bars, 100 µm.
Figure 6.
Figure 6.
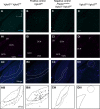
Sound-induced expression of c-Fos in the CN in response to an intense, 115 dB SPL, sound level. A, Representative image from Vglut3Cre;Vglut3fl/fl mouse after sound exposure shows c-Fos immunoreactivity (cyan) restricted to the GCD. Ai, Nissl staining (magenta). Aii, Merge of cyan and magenta channels. CB, Cerebellum. Aiii, Mask of c-Fos signal from A. Aii-Cii, Region enclosed by white dashed line indicates GCD. Region enclosed by black dashed line indicates regions of the DCN that also contain granule cells. Aiii-Ciii, Region enclosed by gray dashed line indicates GCD. Region enclosed by black dashed line indicates regions of the DCN that also contain granule cells. B, Representative image of CN from Vglut3fl/fl (positive control) after sound exposure shows c-Fos immunoreactivity (cyan) throughout DCN and GCD. Bi, Nissl staining of cell somata (magenta). Bii, Merge of cyan and magenta channels. Biii, Mask of c-Fos signal from B. C, Representative image from PrestinCreERT2;Vglut3−/−;Vglut2fl/fl negative control mouse indicates background levels of c-Fos immunoreactivity (cyan). Ci, Nissl staining (magenta). Cii, Merge of cyan and magenta channels. Ciii, Mask of c-Fos signal from C. D, Representative image from Vglut3Cre;Vglut3fl/fl after sound exposure shows a lack of c-Fos immunoreactivity (cyan) in Nucleus Y (Y). Di, Nissl staining (magenta). Y, Nucleus Y. Dii, Merge of cyan and magenta channels. Region enclosed by black dashed line indicates regions of the DCN. Region enclosed by gray dashed line indicates Nucleus Y. Diii, Mask of c-Fos signal from D. Region enclosed by black dashed line indicates regions of the DCN. Region enclosed by gray dashed line indicates Nucleus Y. Scale bar, 100 µm.
Figure 7.
Figure 7.
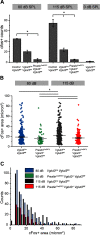
Analysis of c-Fos+ neurons in the CN in response to sound. A, Quantification of the number of c-Fos+ neurons in CN of Vglut3fl/fl (positive control), Vglut3Cre;Vglut3fl/fl, and PrestinCreERT2;Vglut3−/−; Vglut2fl/fl (negative control) mice following 80, 115, or 0 dB SPL sound. *p < 0.05. B, Cell nuclei sizes of c-Fos+ neurons from Vglut3Cre;Vglut3fl/fl (blue) and PrestinCreERT2;Vglut3−/−;Vglut2fl/fl (green) mice exposed to 80 dB SPL sound, and from Vglut3Cre;Vglut3fl/fl (black) and PrestinCreERT2;Vglut3−/−;Vglut2fl/fl (red) mice exposed to 115 dB SPL sound. *p < 0.05. C, Frequency histogram of c-Fos+ cell nuclei sizes shown in B. n = 5-7 mice per genotype.

Similar articles

Cited by

References

    1. Akil O, Chang J, Hiel H, Kong JH, Yi E, Glowatzki E, Lustig LR (2006) Progressive deafness and altered cochlear innervation in knock-out mice lacking prosaposin. J Neurosci 26:13076–13088. 10.1523/JNEUROSCI.3746-06.2006 - DOI - PMC - PubMed
    1. Akil O, Seal RP, Burke K, Wang C, Alemi A, During M, Edwards RH, Lustig LR (2012) Article restoration of hearing in the VGluT3 knockout mouse using virally mediated gene therapy. Neuron 75:283–293. 10.1016/j.neuron.2012.05.019 - DOI - PMC - PubMed
    1. Barker M, Solinski HJ, Hashimoto H, Tagoe T, Pilati N, Hamann M (2012) Acoustic overexposure increases the expression of VGluT-2 mediated projections from the lateral vestibular nucleus to the dorsal cochlear nucleus. PLoS One 7:e35955. 10.1371/journal.pone.0035955 - DOI - PMC - PubMed
    1. Benson TE, Brown MC (2004) Postsynaptic targets of Type II auditory nerve fibers in the cochlear nucleus. J Assoc Res Otolaryngol 5:111–125. 10.1007/s10162-003-4012-3 - DOI - PMC - PubMed
    1. Berglund AM, Ryugo DK (1987) Hair cell innervation by spiral ganglion neurons in the mouse. J Comp Neurol 255:560–570. 10.1002/cne.902550408 - DOI - PubMed

Publication types

Substances