. 2021 Feb 12;371(6530):eaax2537.
doi: 10.1126/science.aax2537.

Reintroduction of the archaic variant of NOVA1 in cortical organoids alters neurodevelopment

Affiliations

Reintroduction of the archaic variant of NOVA1 in cortical organoids alters neurodevelopment

Cleber A Trujillo et al. Science. .

Abstract

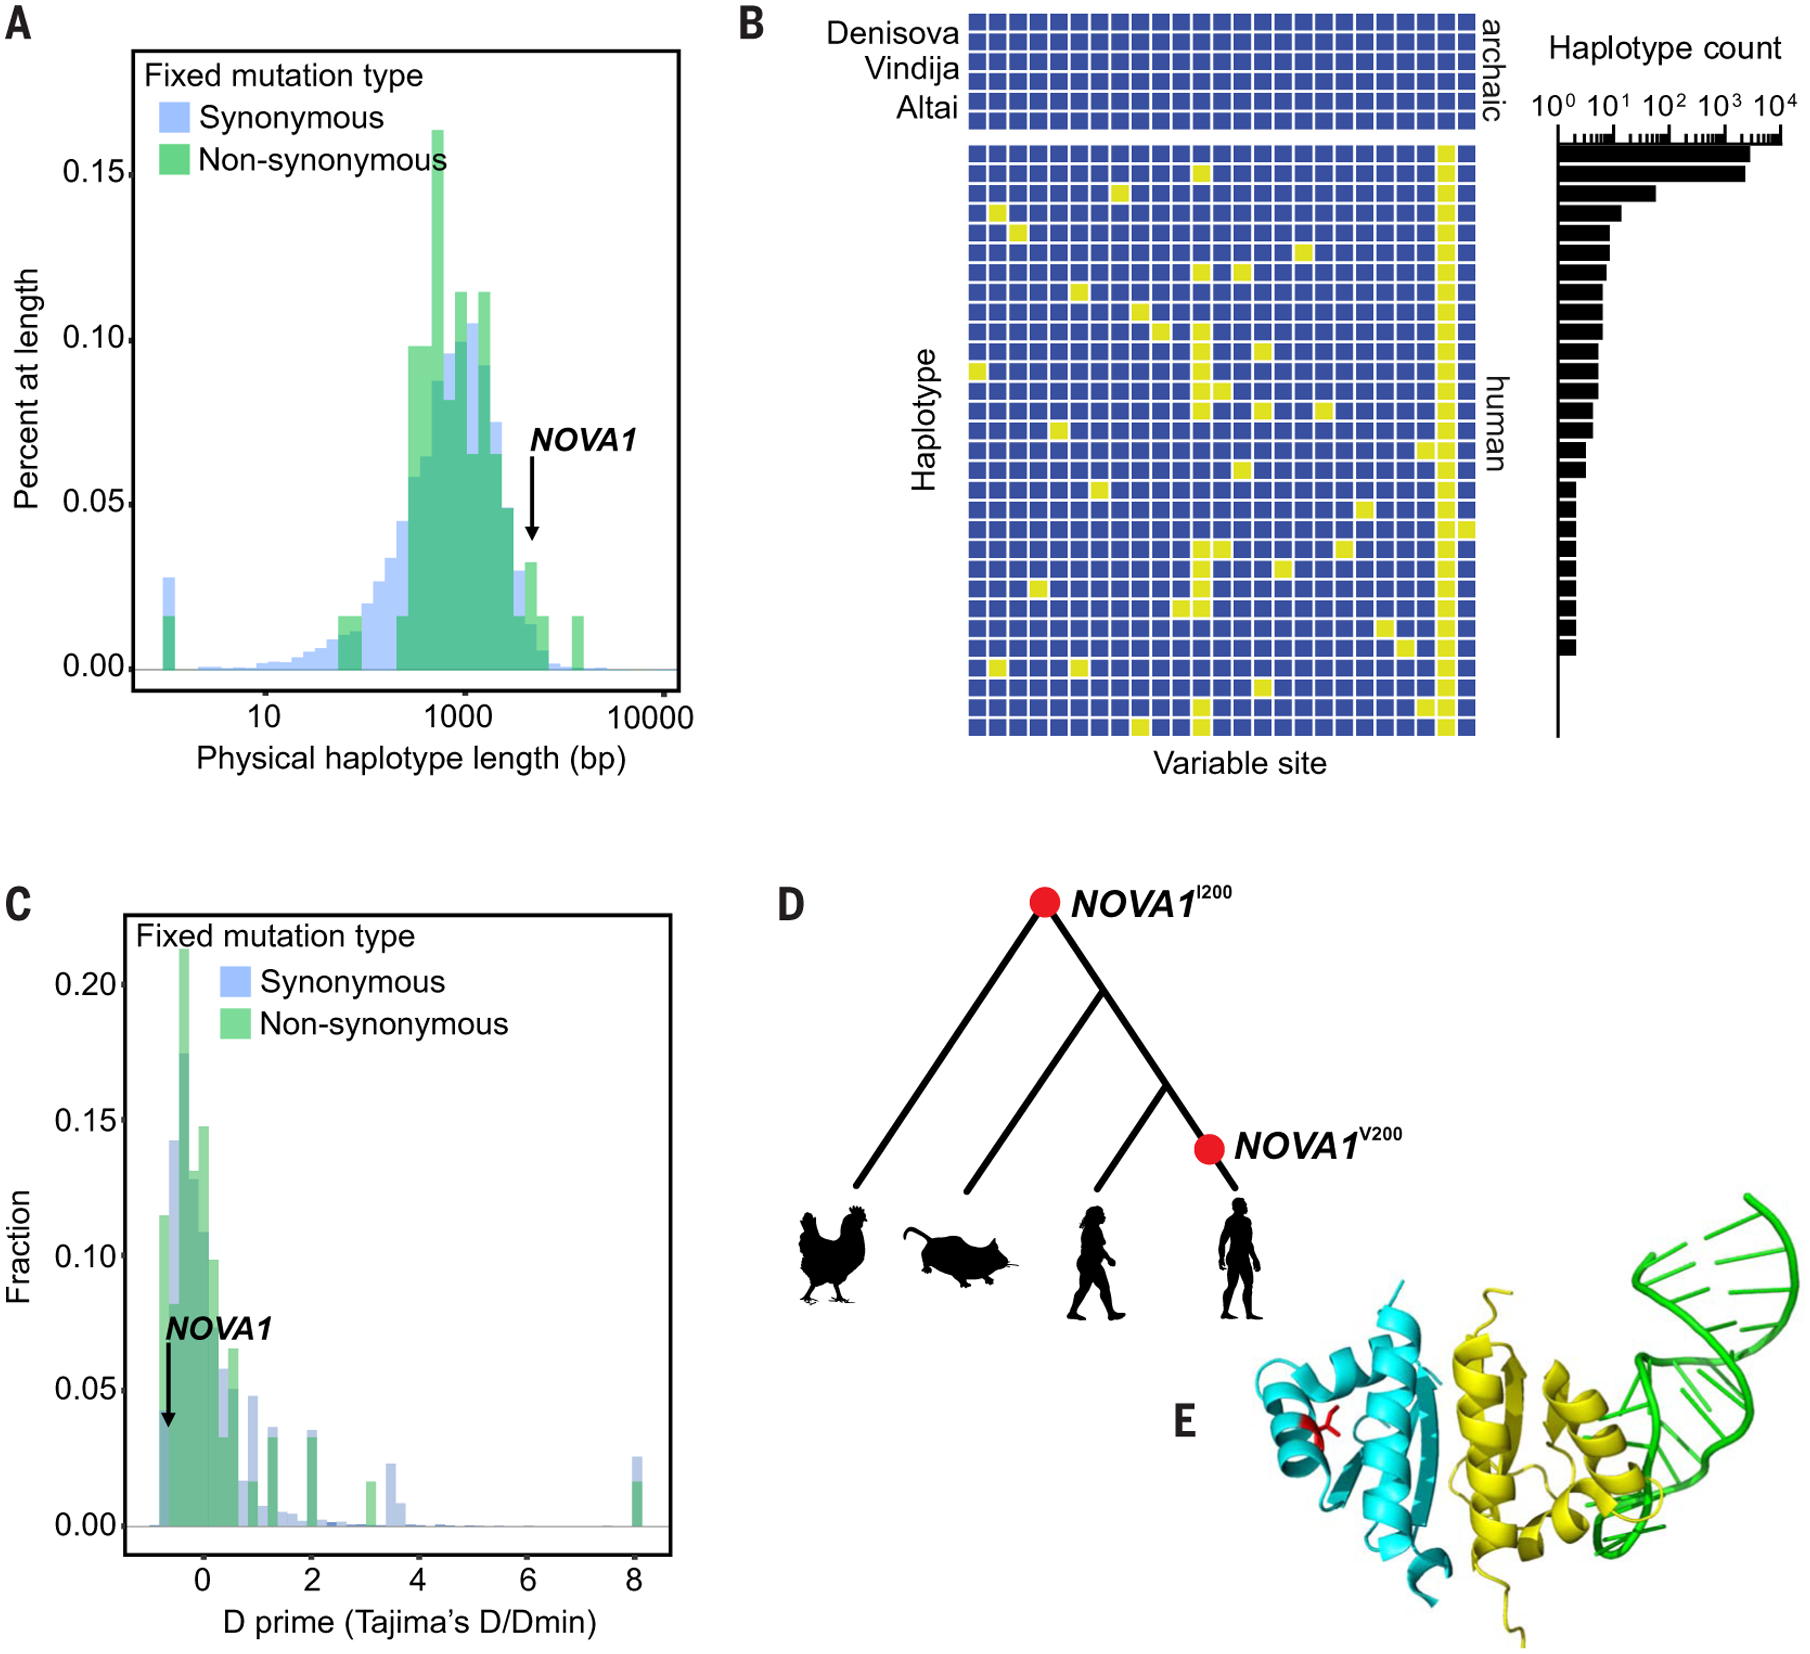
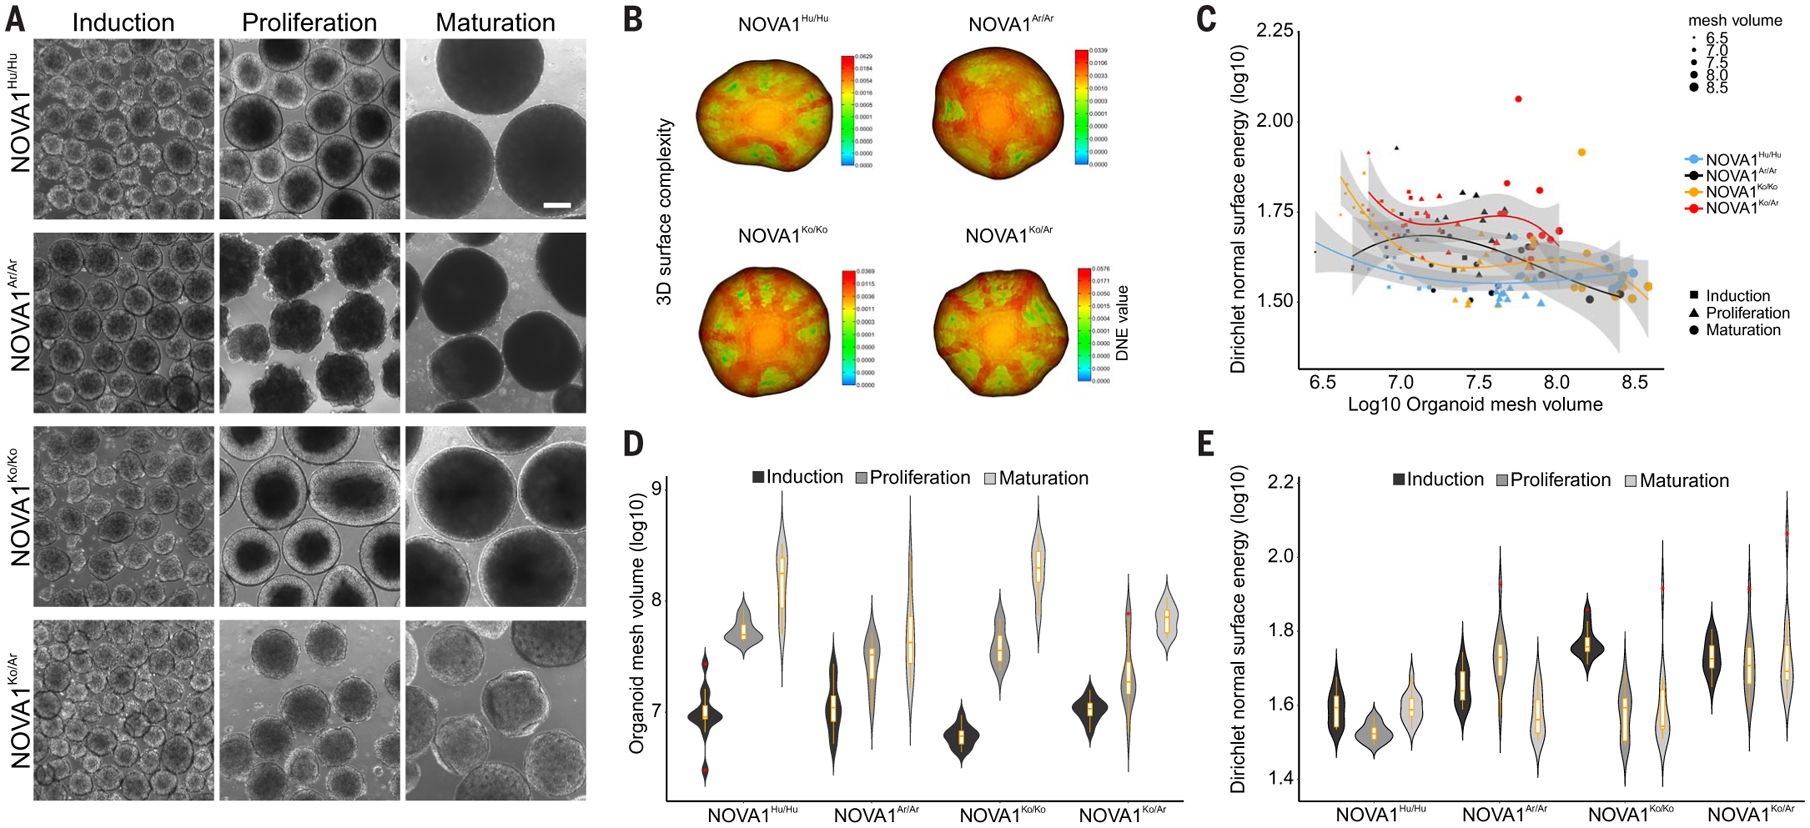
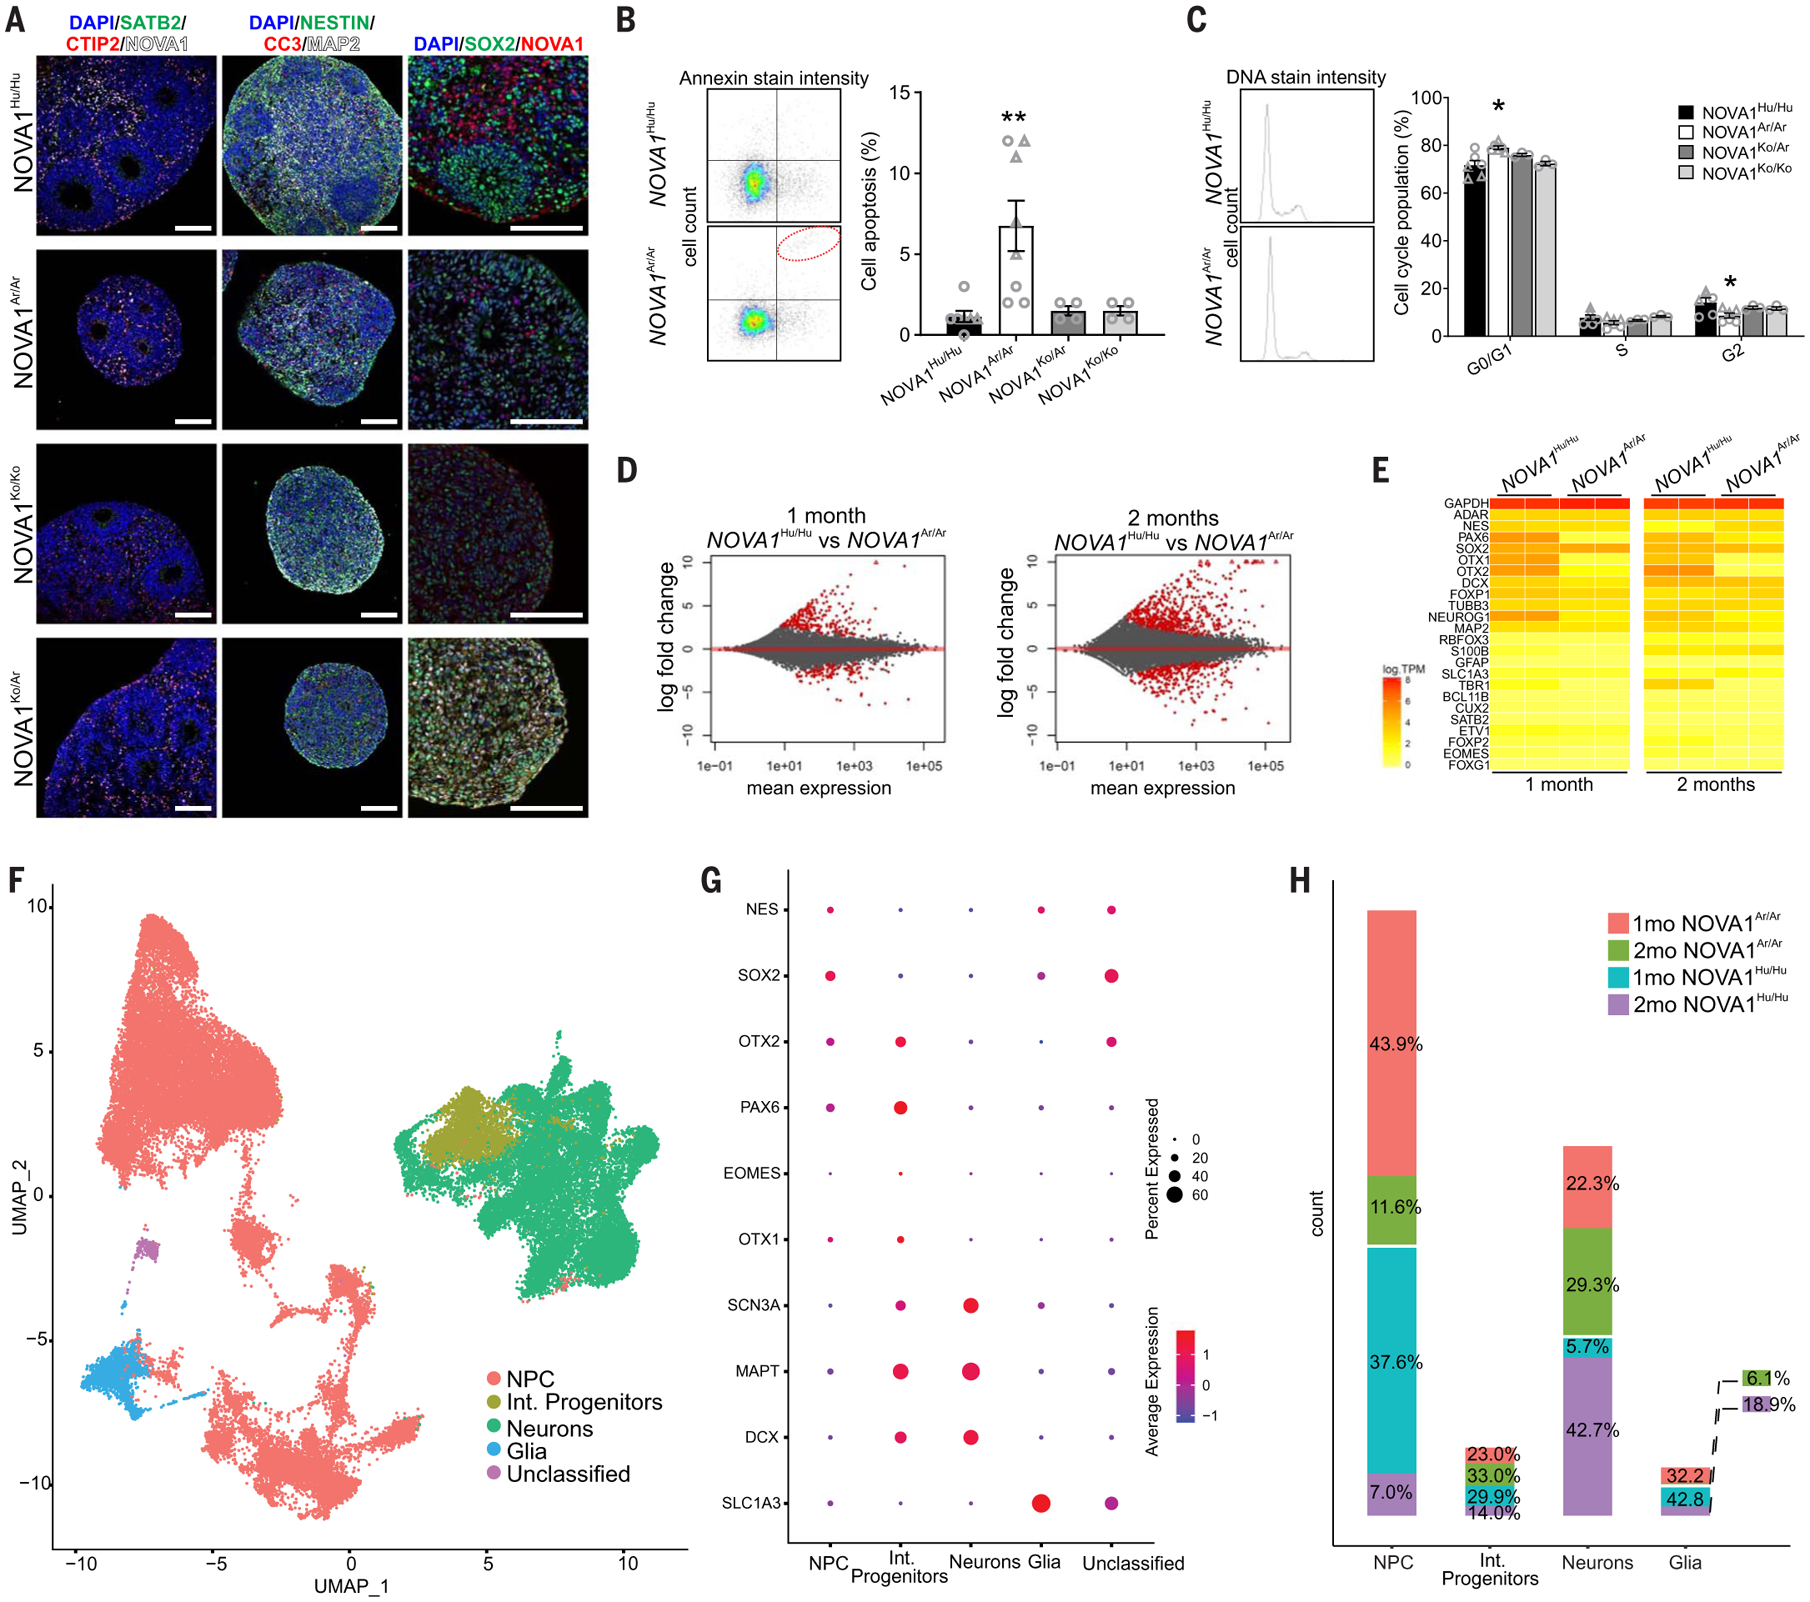
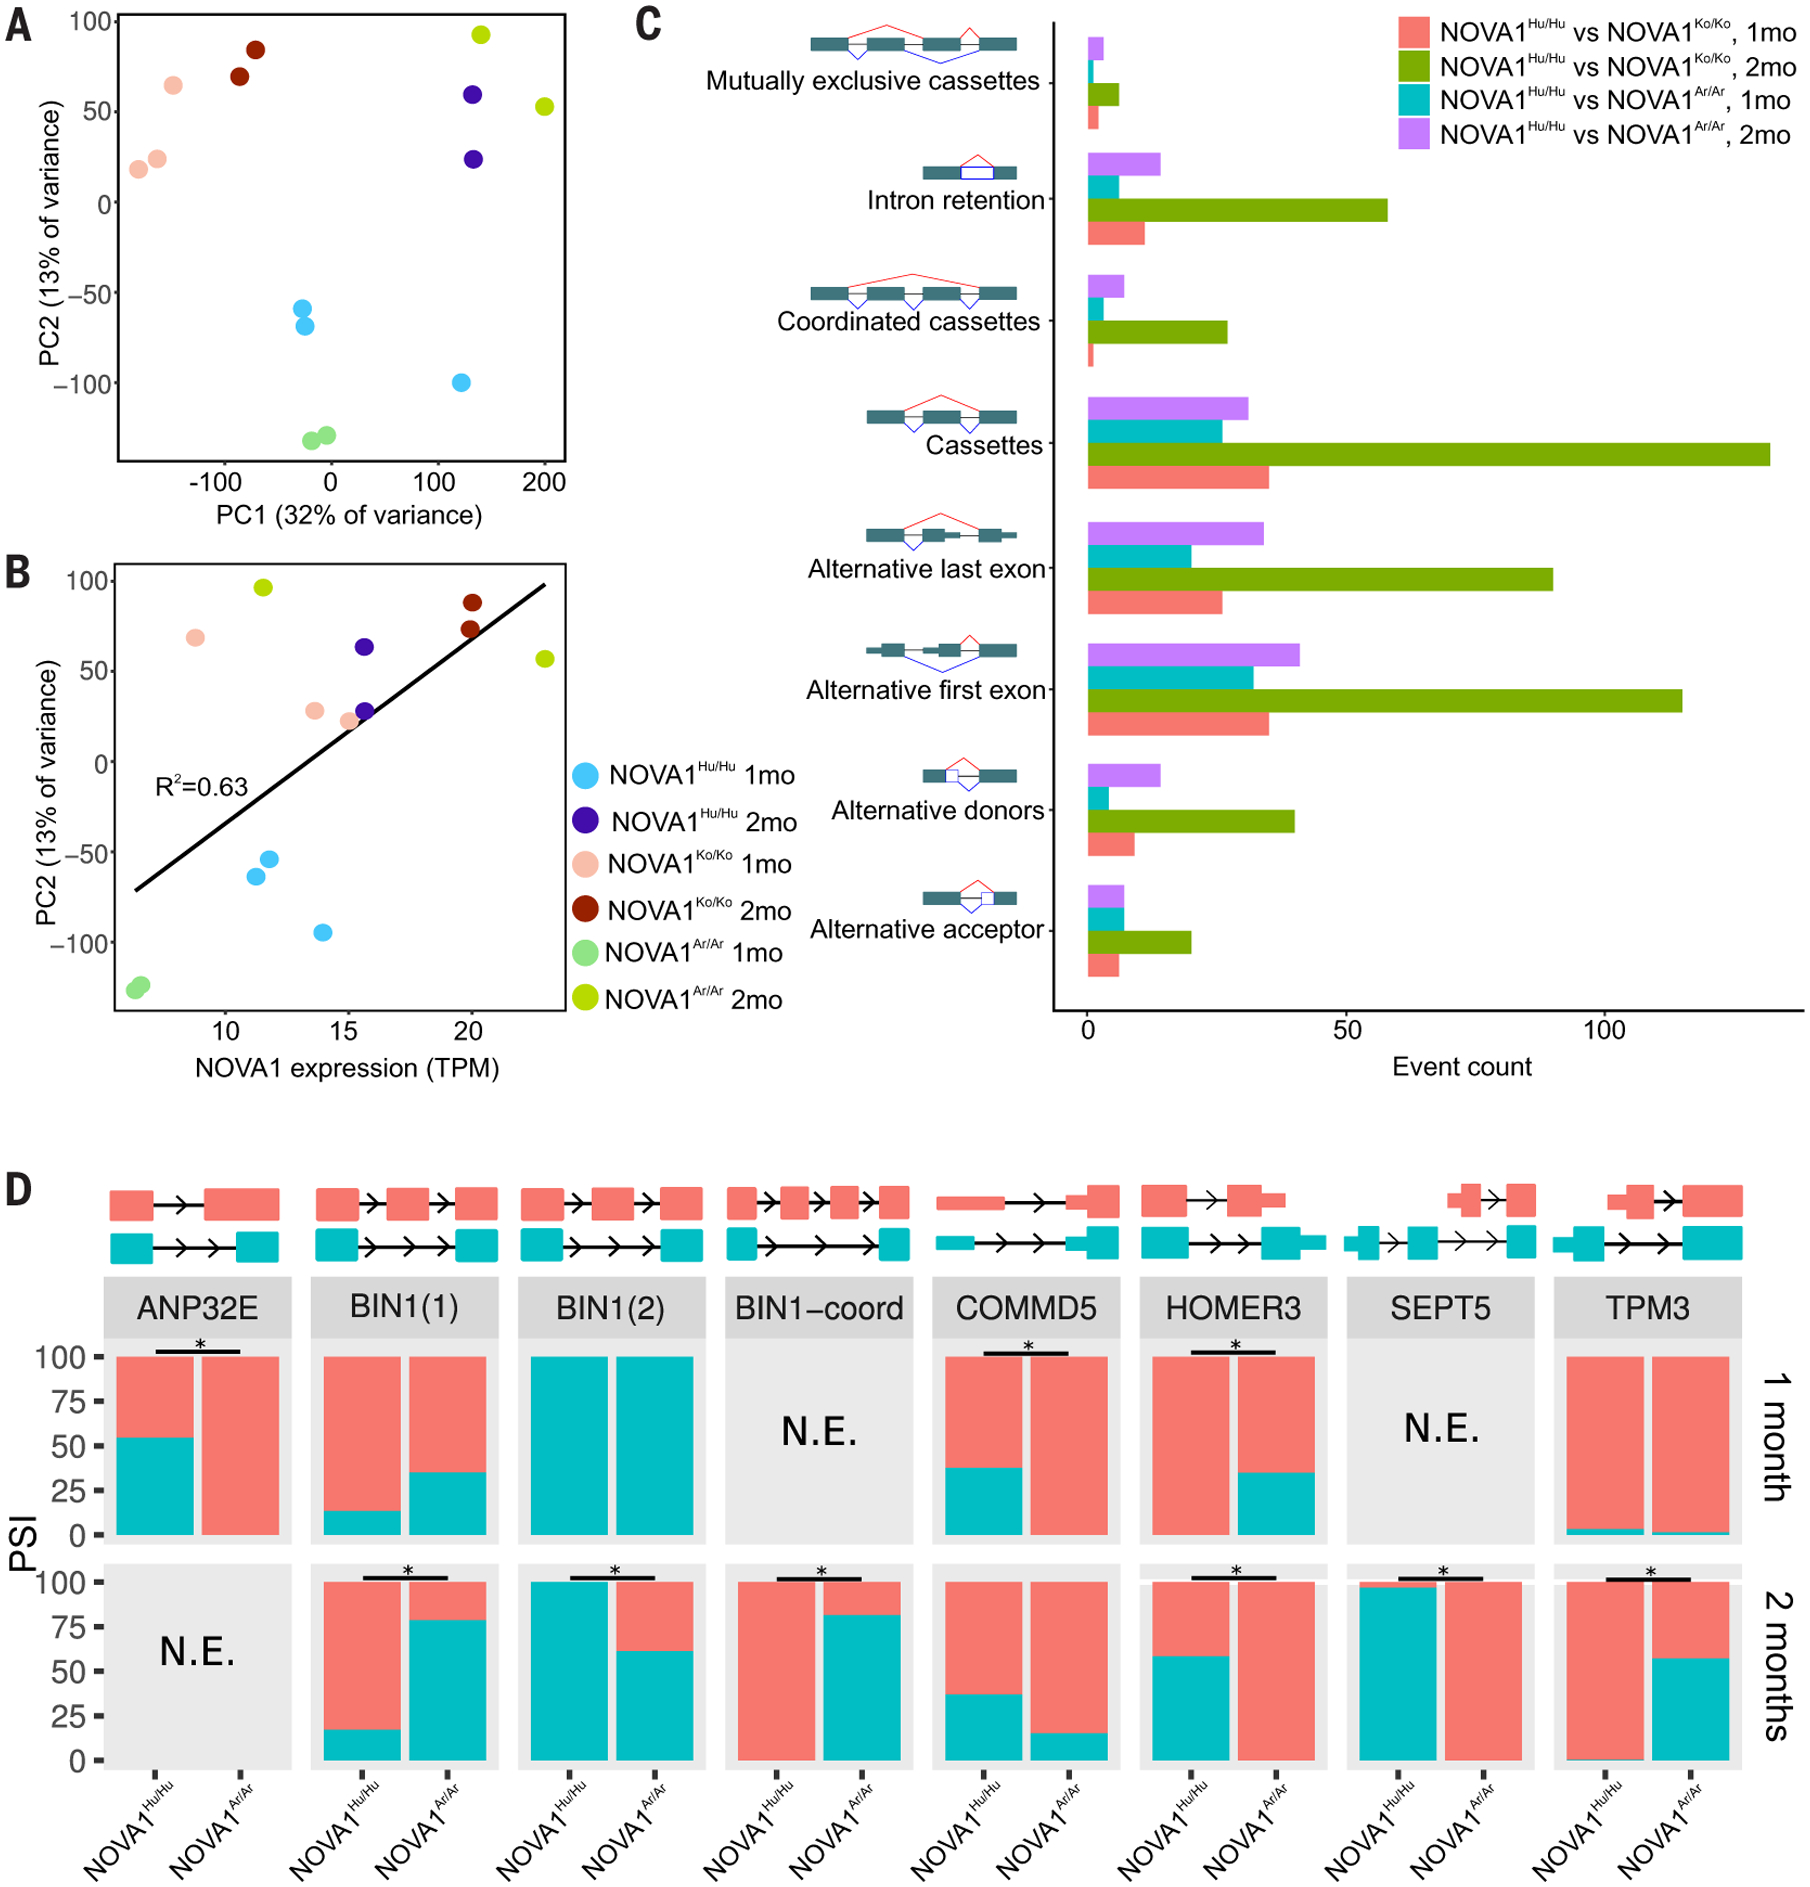
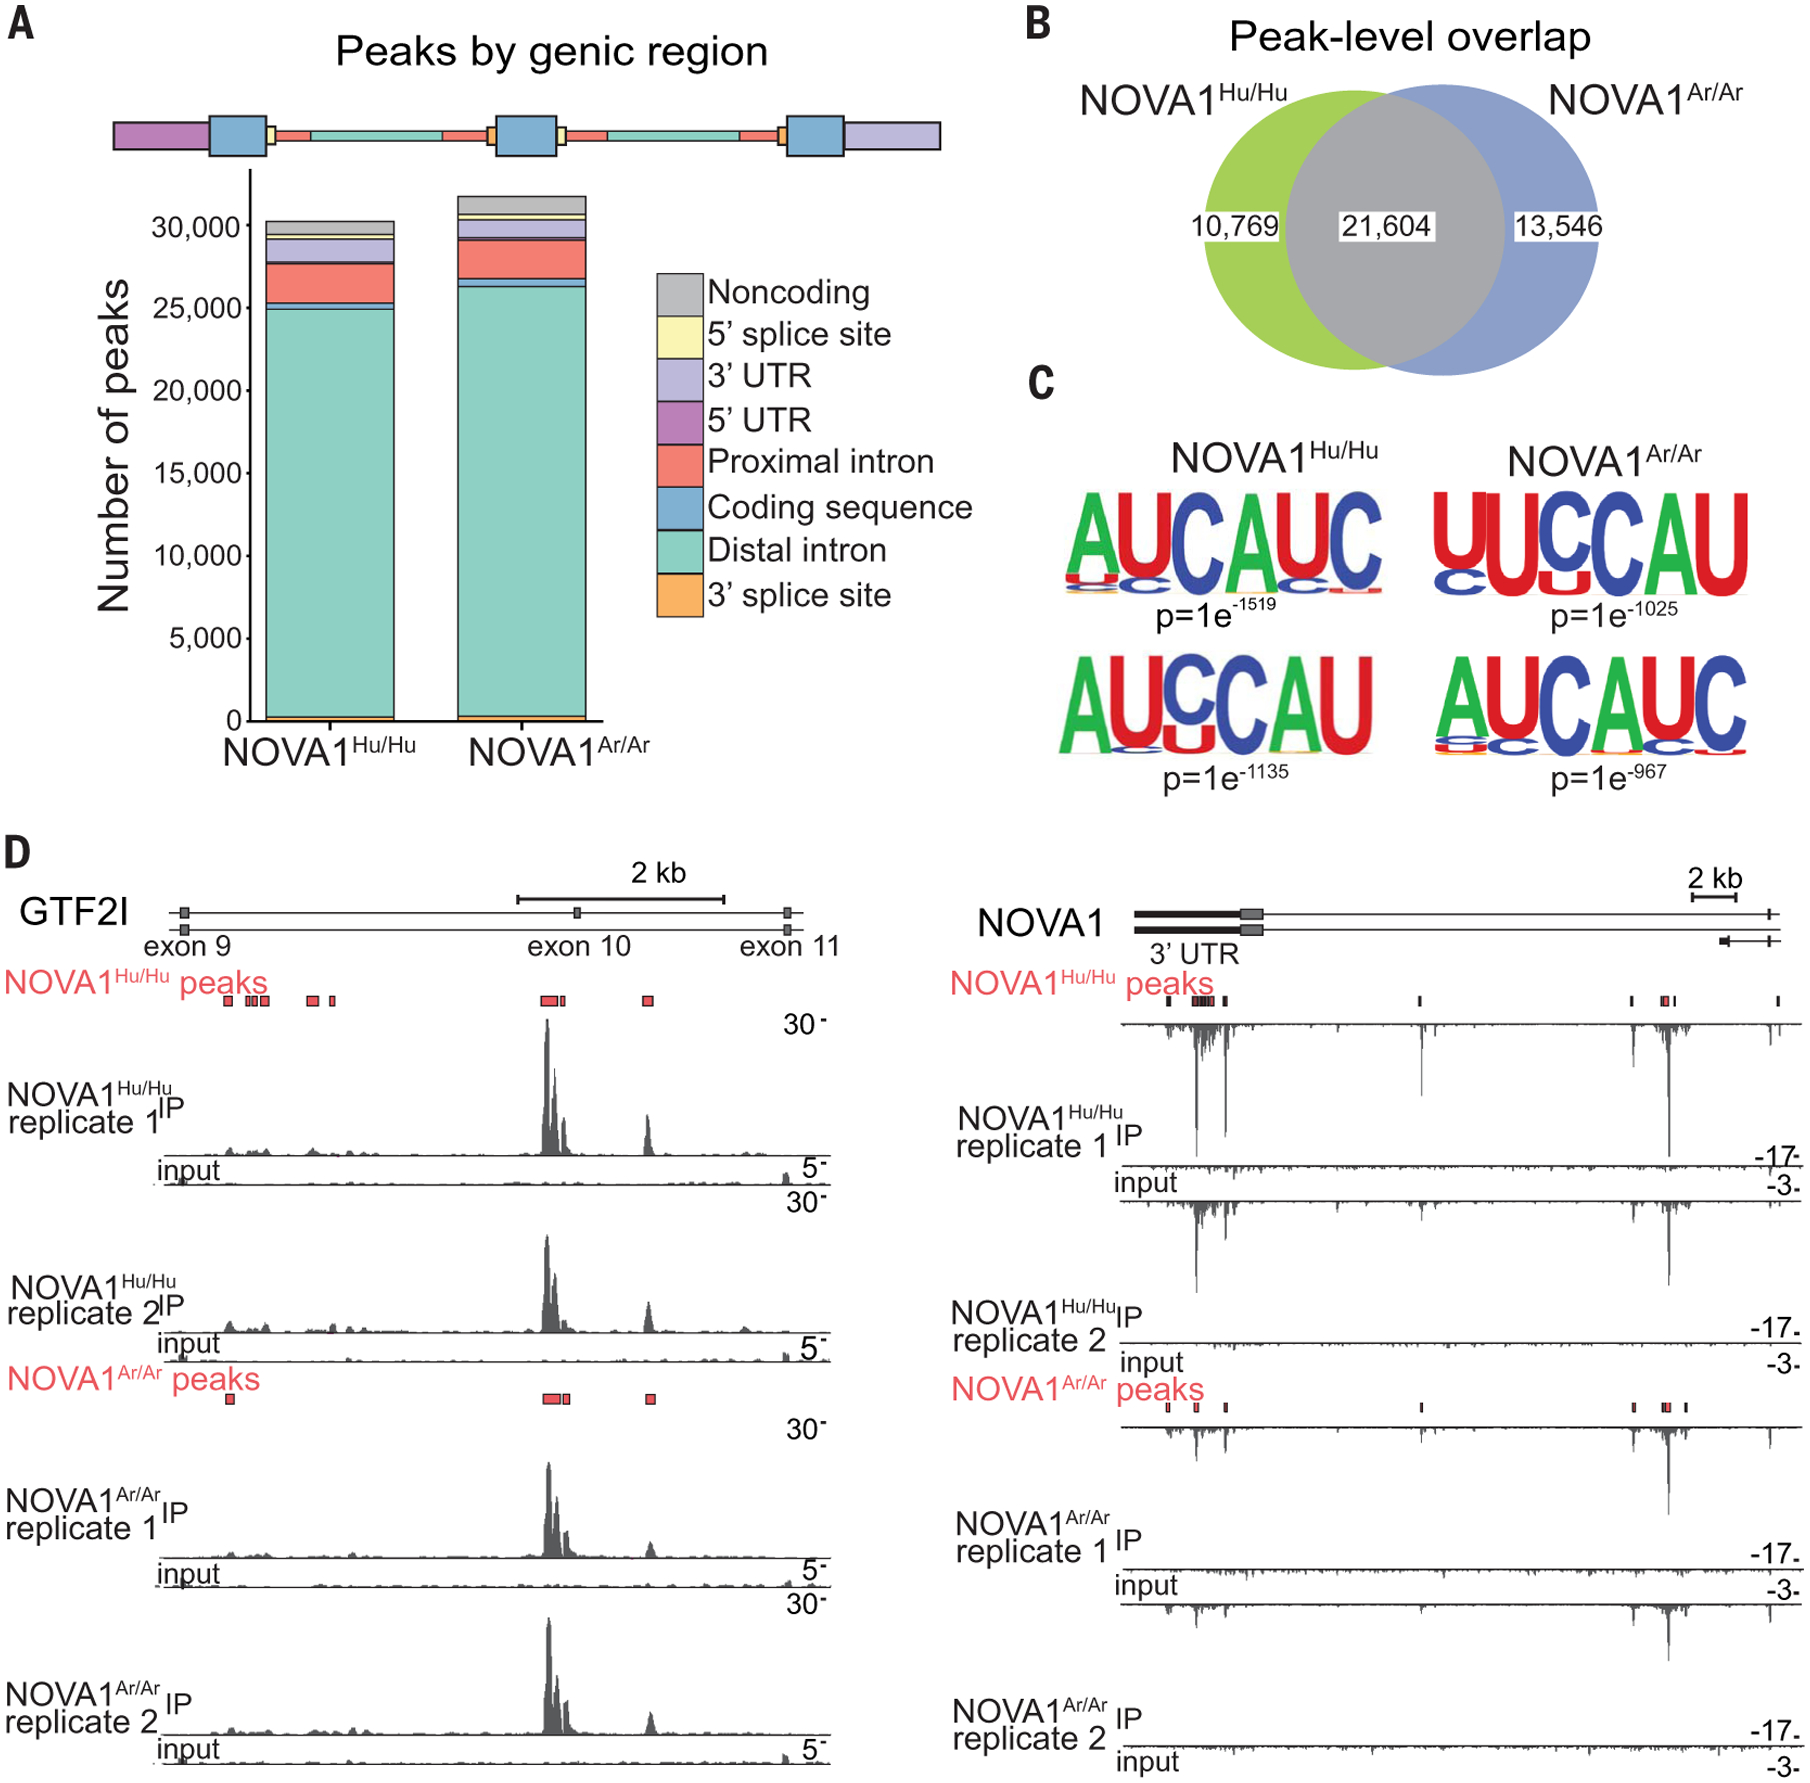
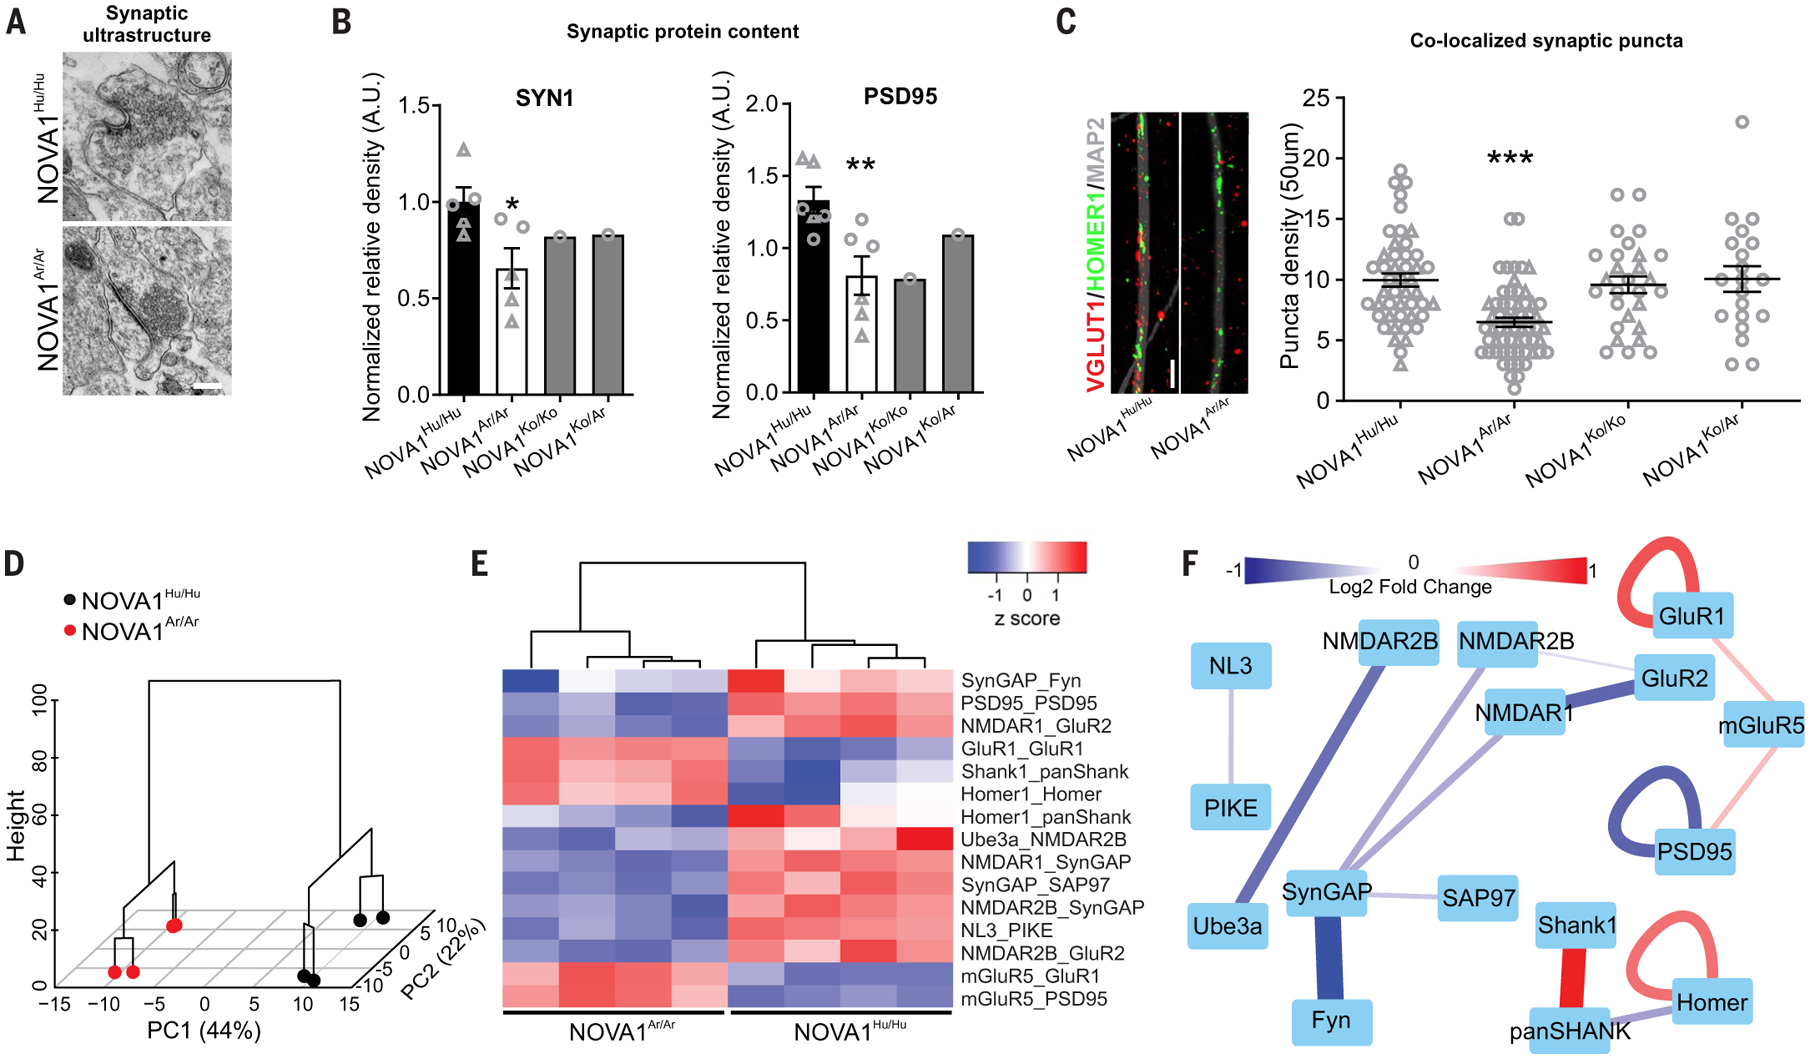
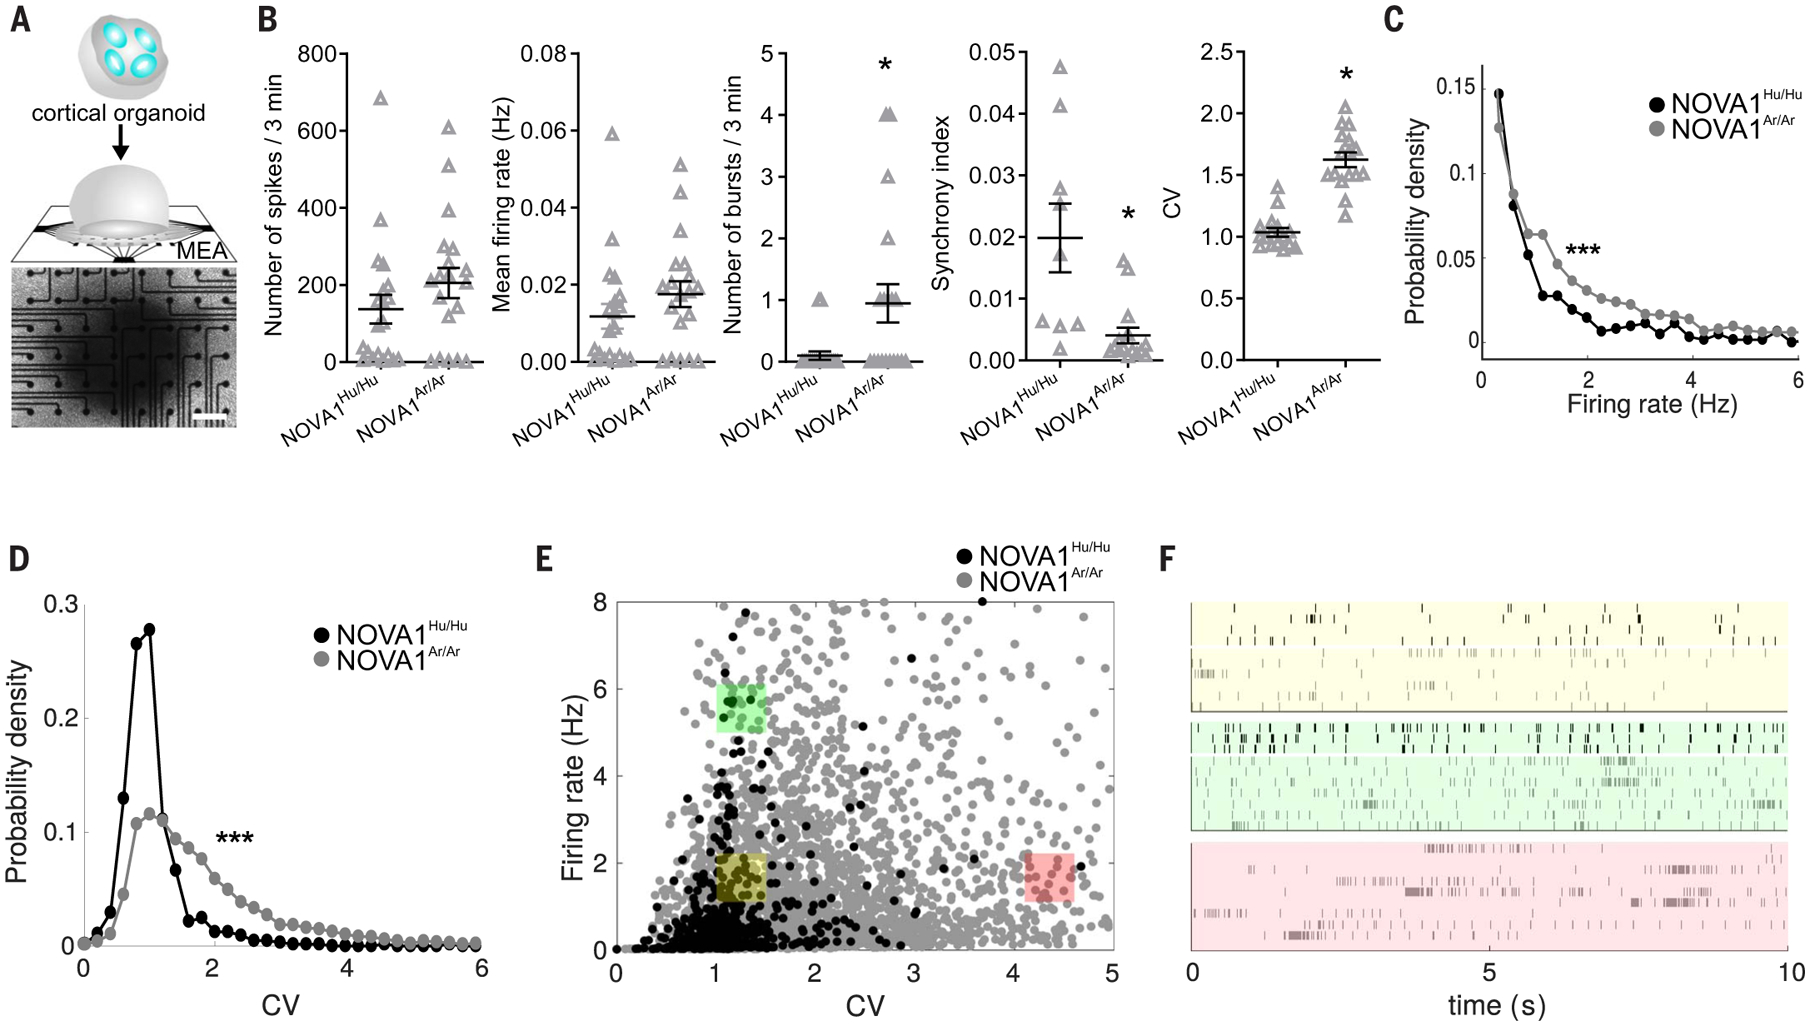
The evolutionarily conserved splicing regulator neuro-oncological ventral antigen 1 (NOVA1) plays a key role in neural development and function. NOVA1 also includes a protein-coding difference between the modern human genome and Neanderthal and Denisovan genomes. To investigate the functional importance of an amino acid change in humans, we reintroduced the archaic allele into human induced pluripotent cells using genome editing and then followed their neural development through cortical organoids. This modification promoted slower development and higher surface complexity in cortical organoids with the archaic version of NOVA1 Moreover, levels of synaptic markers and synaptic protein coassociations correlated with altered electrophysiological properties in organoids expressing the archaic variant. Our results suggest that the human-specific substitution in NOVA1, which is exclusive to modern humans since divergence from Neanderthals, may have had functional consequences for our species' evolution.


Conflict of interest statement

Competing interests: A.R.M. is a cofounder of and has equity interest in TISMOO, a company dedicated to genetic analysis and brain organoid modeling focusing on therapeutic applications customized for autism spectrum disorder and other neurological disorders with genetic origins. The terms of this arrangement have been reviewed and approved by the University of California, San Diego, in accordance with its conflict-of-interest policies. G.W.Y. is cofounder, member of the board of directors, science advisory board member, and equity holder of and paid consultant for Locanabio and Eclipse BioInnovations. G.W.Y. is a visiting professor at the National University of Singapore. G.W.Y.’s interest(s) have been reviewed and approved by the University of California, San Diego, in accordance with its conflict-of-interest policies.

Figures

Fig. 1.
Fig. 1.. Catalog of human versus Neanderthal genetic variation and the NOVA1 haplotype.
(A) Physical haplotype lengths [in base pairs (bp)] around human-specific fixed derived alleles in the 1000 Genomes Project dataset. We defined a haplotype as the distance upstream and downstream of a human-specific fixed derived allele for which no human in the 1000 Genomes Project dataset shares a derived allele with an archaic hominin. Lengths of haplotypes around both synonymous and nonsynonymous substitutions are shown. (B) Haplotypes around the human-specific fixed derived allele in NOVA1. Rows are individual haplotypes; columns are variable sites. Yellow boxes have a derived allele (different from the 1000 Genomes Project ancestral sequence). Human haplotypes are labeled by the number of (phased, haploid) human genomes that carry them. Only biallelic SNPs with reference alleles are shown, and the region is bounded by sites at which modern humans share derived alleles with archaic hominins. (C) Normalized Tajima’s D of haplotypes around human-specific fixed derived alleles. (D) Phylogeny of modern humans, Neanderthals, mice, and chickens, with their amino acid at position 200 in NOVA1 denoted [NOVA1I200 (isoleucine) and NOVA1V200 (valine)]. (E) Tertiary structure of NOVA1. Partial structure of NOVA1, showing the KH1 (yellow) and KH2 (blue) domains bound to RNA (green). The location of the variable residue at position 200 is shown in red. The structure of the KH3 domain has not been solved. RNA can simultaneously bind to both the KH1 and KH2 domains of NOVA1.
Fig. 2.
Fig. 2.. The impact of the NOVA1 archaic genetic variant on modern human neurodevelopment.
(A) Cellular and molecular development of human cortical organoids. Representative bright-field images captured at different stages of maturation (three replicates from two independent cell lines; NOVA1Hu/Hu n = 5 clones, NOVA1Ar/Ar n = 5 clones, NOVA1Ko/Ko n = 2 clones, and NOVA1Ko/Ar n = 2 clones). For more details, see table S2. Scale bar, 200 μm. (B) Reconstruction and shape quantification of 3D cortical organoid surface models using image processing and 2D outline segmentation. (C) Correlations between organoid size (mesh volume) and shape with DNE. DNE was used as a shape metric or surface rugosity and curvature measure (i.e., the bending of the surface; high DNE values correspond to a ridged surface). A third-degree polynomial was used to fit the data, and the confidence interval is 95%. Note that organoid surface complexity decreases with an increase in organoid size only for NOVA1Ko/Ko. For the rest, the correlations are not significant; organoid surface complexity is relatively independent of organoid size. Fitted values and model predictions (lines) nicely reflect the model; the combination of violin (density) and boxplot tracing changes in size and shape during organoid neurodevelopment is shown. Shading indicates 95% confidence interval. (D and E) NOVA1Ar/Ar cortical organoids showed (D) smaller diameter and (E) increased surface rugosity at the proliferative and maturation stages compared with NOVA1Hu/Hu (n = 36 organoids per genotype and time point, two independent cell lines).
Fig. 3.
Fig. 3.. The transcriptional and cellular alterations of the NOVA1 archaic genetic variant on human neurodevelopment.
(A) Cryosections of 1-month-old cortical organoids. Organoids are composed of a proliferative region (Ki67+, SOX2+, and Nestin+) surrounded by cortical neurons (NeuN+, MAP2+, and CTIP2+). Scale bars, 100 μm. (B) Annexin cell death assay scatterplot shows an increase in cell death percentage in 1-month-old NOVA1Ar/Ar cortical organoids [NOVA1Hu/Hu n = 6, five clones; NOVA1Ar/Ar n = 8, five clones; NOVA1Ko/Ko n = 4, one clone; and NOVA1Ko/Ar n = 4, one clone; analysis of variance (ANOVA) Kruskal-Wallis test, P = 0.0015 NOVA1Hu/Hu versus NOVA1Ar/Ar]. (C) DNA staining intensity shows a decrease in cell proliferation in 1-month-old NOVA1Ar/Ar cortical organoids (NOVA1Hu/Hu n = 6, five clones; NOVA1Ar/Ar n = 6, three clones; NOVA1Ko/Ko n = 3, one clone; and NOVA1Ko/Ar n = 3, one clone; two-way ANOVA Dunnett test, P = 0.002 NOVA1Hu/Hu versus NOVA1Ar/Ar). For (B) and (C), data are shown as mean ± SEM; *P < 0.05 and **P < 0.01; and individual cell lines are indicated by a different symbol. (D) MA plots of the overall expression on the x axis and log2 fold change on the y axis for every gene. Points colored in red represent genes that were significantly differentially expressed with a false discovery rate α = 0.01. (E) Gene expression heatmap for key genes involved in neural development across all time points and cell lines. (NOVA1Hu/Hu n = 2, two clones from one cell line; NOVA1Ar/Ar n = 2, two clones from one cell line). TPM, transcripts per million. (F) Uniform manifold approximation and projection (UMAP) of 50,418 nuclei from integrating datasets of 1- and 2-month-old cortical organoids. The integrated dataset is colored by four main cell clusters (13,333 nuclei for 1-month NOVA1Hu/Hu, 17,456 nuclei for 1-month NOVA1Ar/Ar, 10,145 nuclei from 2-month NOVA1Hu/Hu, and 9,484 nuclei for 2-month NOVA1Ar/Ar). NPC, neural progenitor cells; Int. progenitors, intermediate progenitors. (G) Dot plots showing cluster-specific gene expression across main cell clusters. See fig. S3 for more gene markers. (H) Bar plots of the proportion of NOVA1Ar/Ar and NOVA1Hu/Hu cell types. Data are shown as mean ± SEM. 1mo, 1 month old; 2mo, 2 month old.
Fig. 4.
Fig. 4.. Global analysis of splicing among different samples.
(A) A plot of the first two principal components from a PCA of cassette inclusion frequency shows that replicates from different cell lines cluster together. Note how NOVA1Ko/Ko cluster differently from the other edited versions. (B) The second principal component positively correlates with NOVA1 expression. (C) Numbers of differential splicing events of different types from comparisons between NOVA1Hu/Hu and NOVA1Ar/Ar cortical organoids at early and late stages of maturation. More differential splicing is found between NOVA1Hu/Hu and NOVA1Ko/Ko than between NOVA1Hu/Hu and NOVA1Ar/Ar, and more differential splicing is found at later stages than at early stages. (D) A set of genes exhibiting alternative splicing changes on the basis of NOVA1 variants at different stages of maturation. N.E. (not expressed) refers to splicing events with insufficient expression for splicing analysis.
Fig. 5.
Fig. 5.. Human and archaic NOVA1 binding profile.
(A) Counts of significantly enriched binding sites (peaks) identified in each genic region indicated (two replicates from one cell line; NOVA1Hu/Hu n = 1 clone, NOVA1Ar/Ar n = 1 clone, NOVA1Ko/Ko n = 1 clone, and NOVA1Ko/Ar n = 1 clone). Significantly enriched peaks are peaks with fold change >4 relative to input and P < 0.001 (chi-square test) in at least one of two replicate experiments. (B) Venn diagram of called peaks for each genotype showing overlap between NOVA1Hu/Hu and NOVA1Ar/Ar binding sites. (C) Top two motifs enriched in HOMER (hypergeometric optimization of motif enrichment) analysis. Motif enrichment of nucleotides in peak regions was calculated relative to background sequences matched for the same genic regions. (D) Normalized read density of input and immunoprecipitation samples for two replicates of NOVA1Hu/Hu and NOVA1Ar/Ar binding events in two target genes: GTF2I and NOVA1. Peaks called are shown in red boxes for each genotype (two replicates from one cell line; NOVA1Hu/Hu n = 1 clone and NOVA1Ar/Ar n = 1 clone).
Fig. 6.
Fig. 6.. Introduction of NOVA1 archaic genetic variant in modern human alters synaptic proteins.
(A) Representative images of electron microscopy of synaptic ultrastructure in cortical organoids with different genotypes. Scale bar, 500 nm. (B) Western blot analysis validated predicted gene expression reduction of synaptic protein markers (NOVA1Hu/Hu SYN1 n = 5, PSD95 n = 6, five clones; NOVA1Ar/Ar SYN1 n = 5, PSD95 n = 6, five clones; NOVA1Ko/Ko n = 1 clone; and NOVA1Ko/Ar n = 1 clone; unpaired t test NOVA1Hu/Hu versus NOVA1Ar/Ar, P = 0.0276 and P = 0.0089). Data are shown as mean ± SEM; individual cell lines are indicated by a different symbol. *P < 0.05; **P < 0.01. (C) Reduction of post- and presynaptic marker colocalization in cortical neurons carrying the NOVA1Ar/Ar variant (47 neurons from three clones of NOVA1Hu/Hu, 61 neurons from three clones of NOVA1Ar/Ar, 28 neurons from two clones of NOVA1Ko/Ko, and 20 neurons from one clone of NOVA1Ko/Ar; ANOVA Kruskal-Wallis test, ***P < 0.001). Data are shown as mean ± SEM; individual cell lines are indicated by a different symbol. Scale bar, 2 μm. (D) Hierarchical clustering by principal components of multiplex coimmunoprecipitation data clustered samples by genotype. The dendrogram is overlaid on a graph of individuals by PC1 and PC2. (E) Heatmap of ANC∩CNA significant interactions, showing the normalized median fluorescent intensity of each interaction in each sample. (F) Dynamic interaction map of protein coassociations shown in (E). Edges connecting protein nodes represent significantly different interactions. Line color and thickness represent the direction and magnitude, respectively, of the difference (one cell line; two clones of NOVA1Hu/Hu and two clones of NOVA1Ar/Ar).
Fig. 7.
Fig. 7.. Introduction of NOVA1 archaic genetic variant in modern human alters neuronal network activity.
(A) Scheme of a cortical organoid plated on a MEA. Scale bar, 200 μm. (B to F) MEA analyses revealed an increase in spontaneous neuronal bursts in NOVA1Ar/Ar compared with NOVA1Hu/Hu cortical organoids (B). Although the number of total spikes does not differ, NOVA1Ar/Ar shows a reduced synchrony index. Data are shown as mean ± SEM (n = 20 MEA wells per genotype); *P < 0.05, two-sided unpaired Student’s t test. After performing spike sorting, the analysis disclosed a wider variability of neurons considering the firing rate (FR) and the CV in NOVA1Ar/Ar cortical organoids, as shown in the probability densities of (C) firing rate and (D) CV and as displayed in (E) 2D distribution and (F) raster plots from three selected regions (yellow: low CV, low FR; green: low CV, high FR; magenta: high CV, low FR). Data are shown as mean ± SEM; ***P < 0.001, Mann-Whitney test.

Comment in

References

    1. Wood B, Collard M, The human genus. Science 284, 65–71 (1999). doi: 10.1126/science.284.5411.65; - DOI - PubMed
    1. Green RE et al., A draft sequence of the Neandertal genome. Science 328, 710–722 (2010). doi: 10.1126/science.1188021; - DOI - PMC - PubMed
    1. Meyer M et al., A high-coverage genome sequence from an archaic Denisovan individual. Science 338, 222–226 (2012). doi: 10.1126/science.1224344; - DOI - PMC - PubMed
    1. Prüfer K et al., The complete genome sequence of a Neanderthal from the Altai Mountains. Nature 505, 43–49 (2014). doi: 10.1038/nature12886; - DOI - PMC - PubMed
    1. Prüfer K et al., A high-coverage Neandertal genome from Vindija Cave in Croatia. Science 358, 655–658 (2017). doi: 10.1126/science.aao1887; - DOI - PMC - PubMed

Publication types

MeSH terms