. 2021 Feb 12;371(6530):eabd9704.
doi: 10.1126/science.abd9704.

Cellular transcriptomics reveals evolutionary identities of songbird vocal circuits

Affiliations

Cellular transcriptomics reveals evolutionary identities of songbird vocal circuits

Bradley M Colquitt et al. Science. .

Abstract

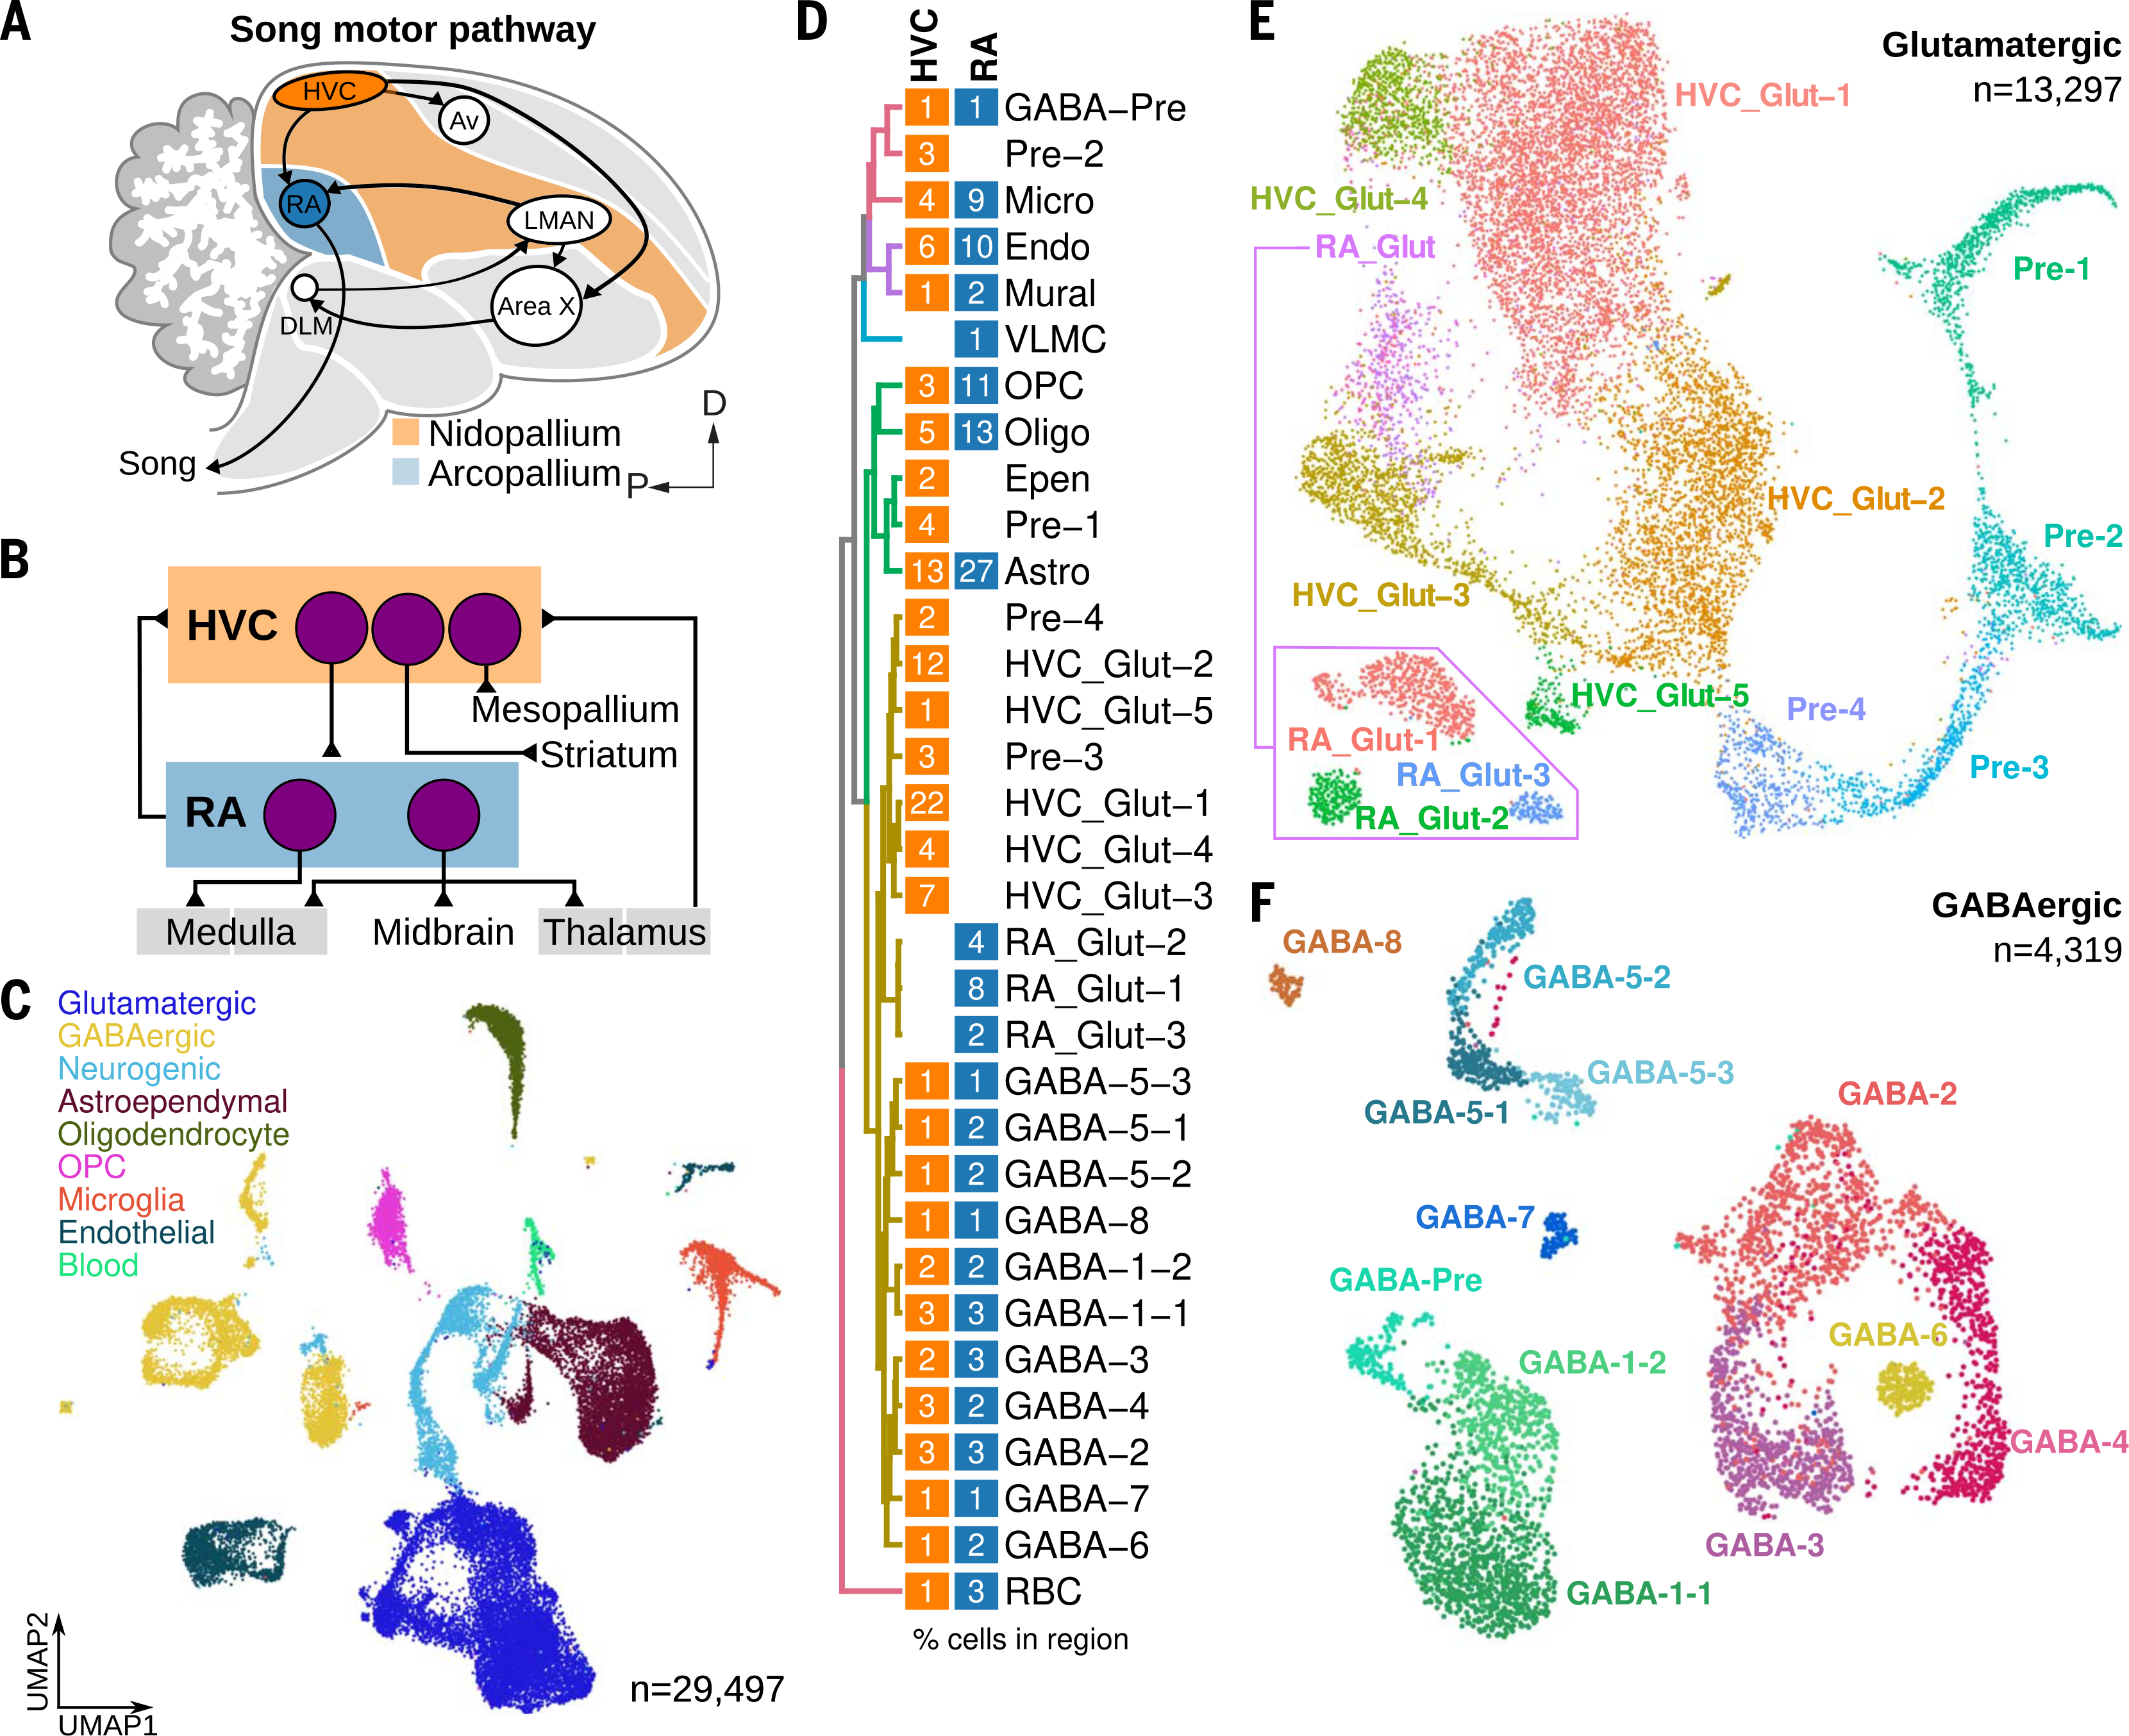
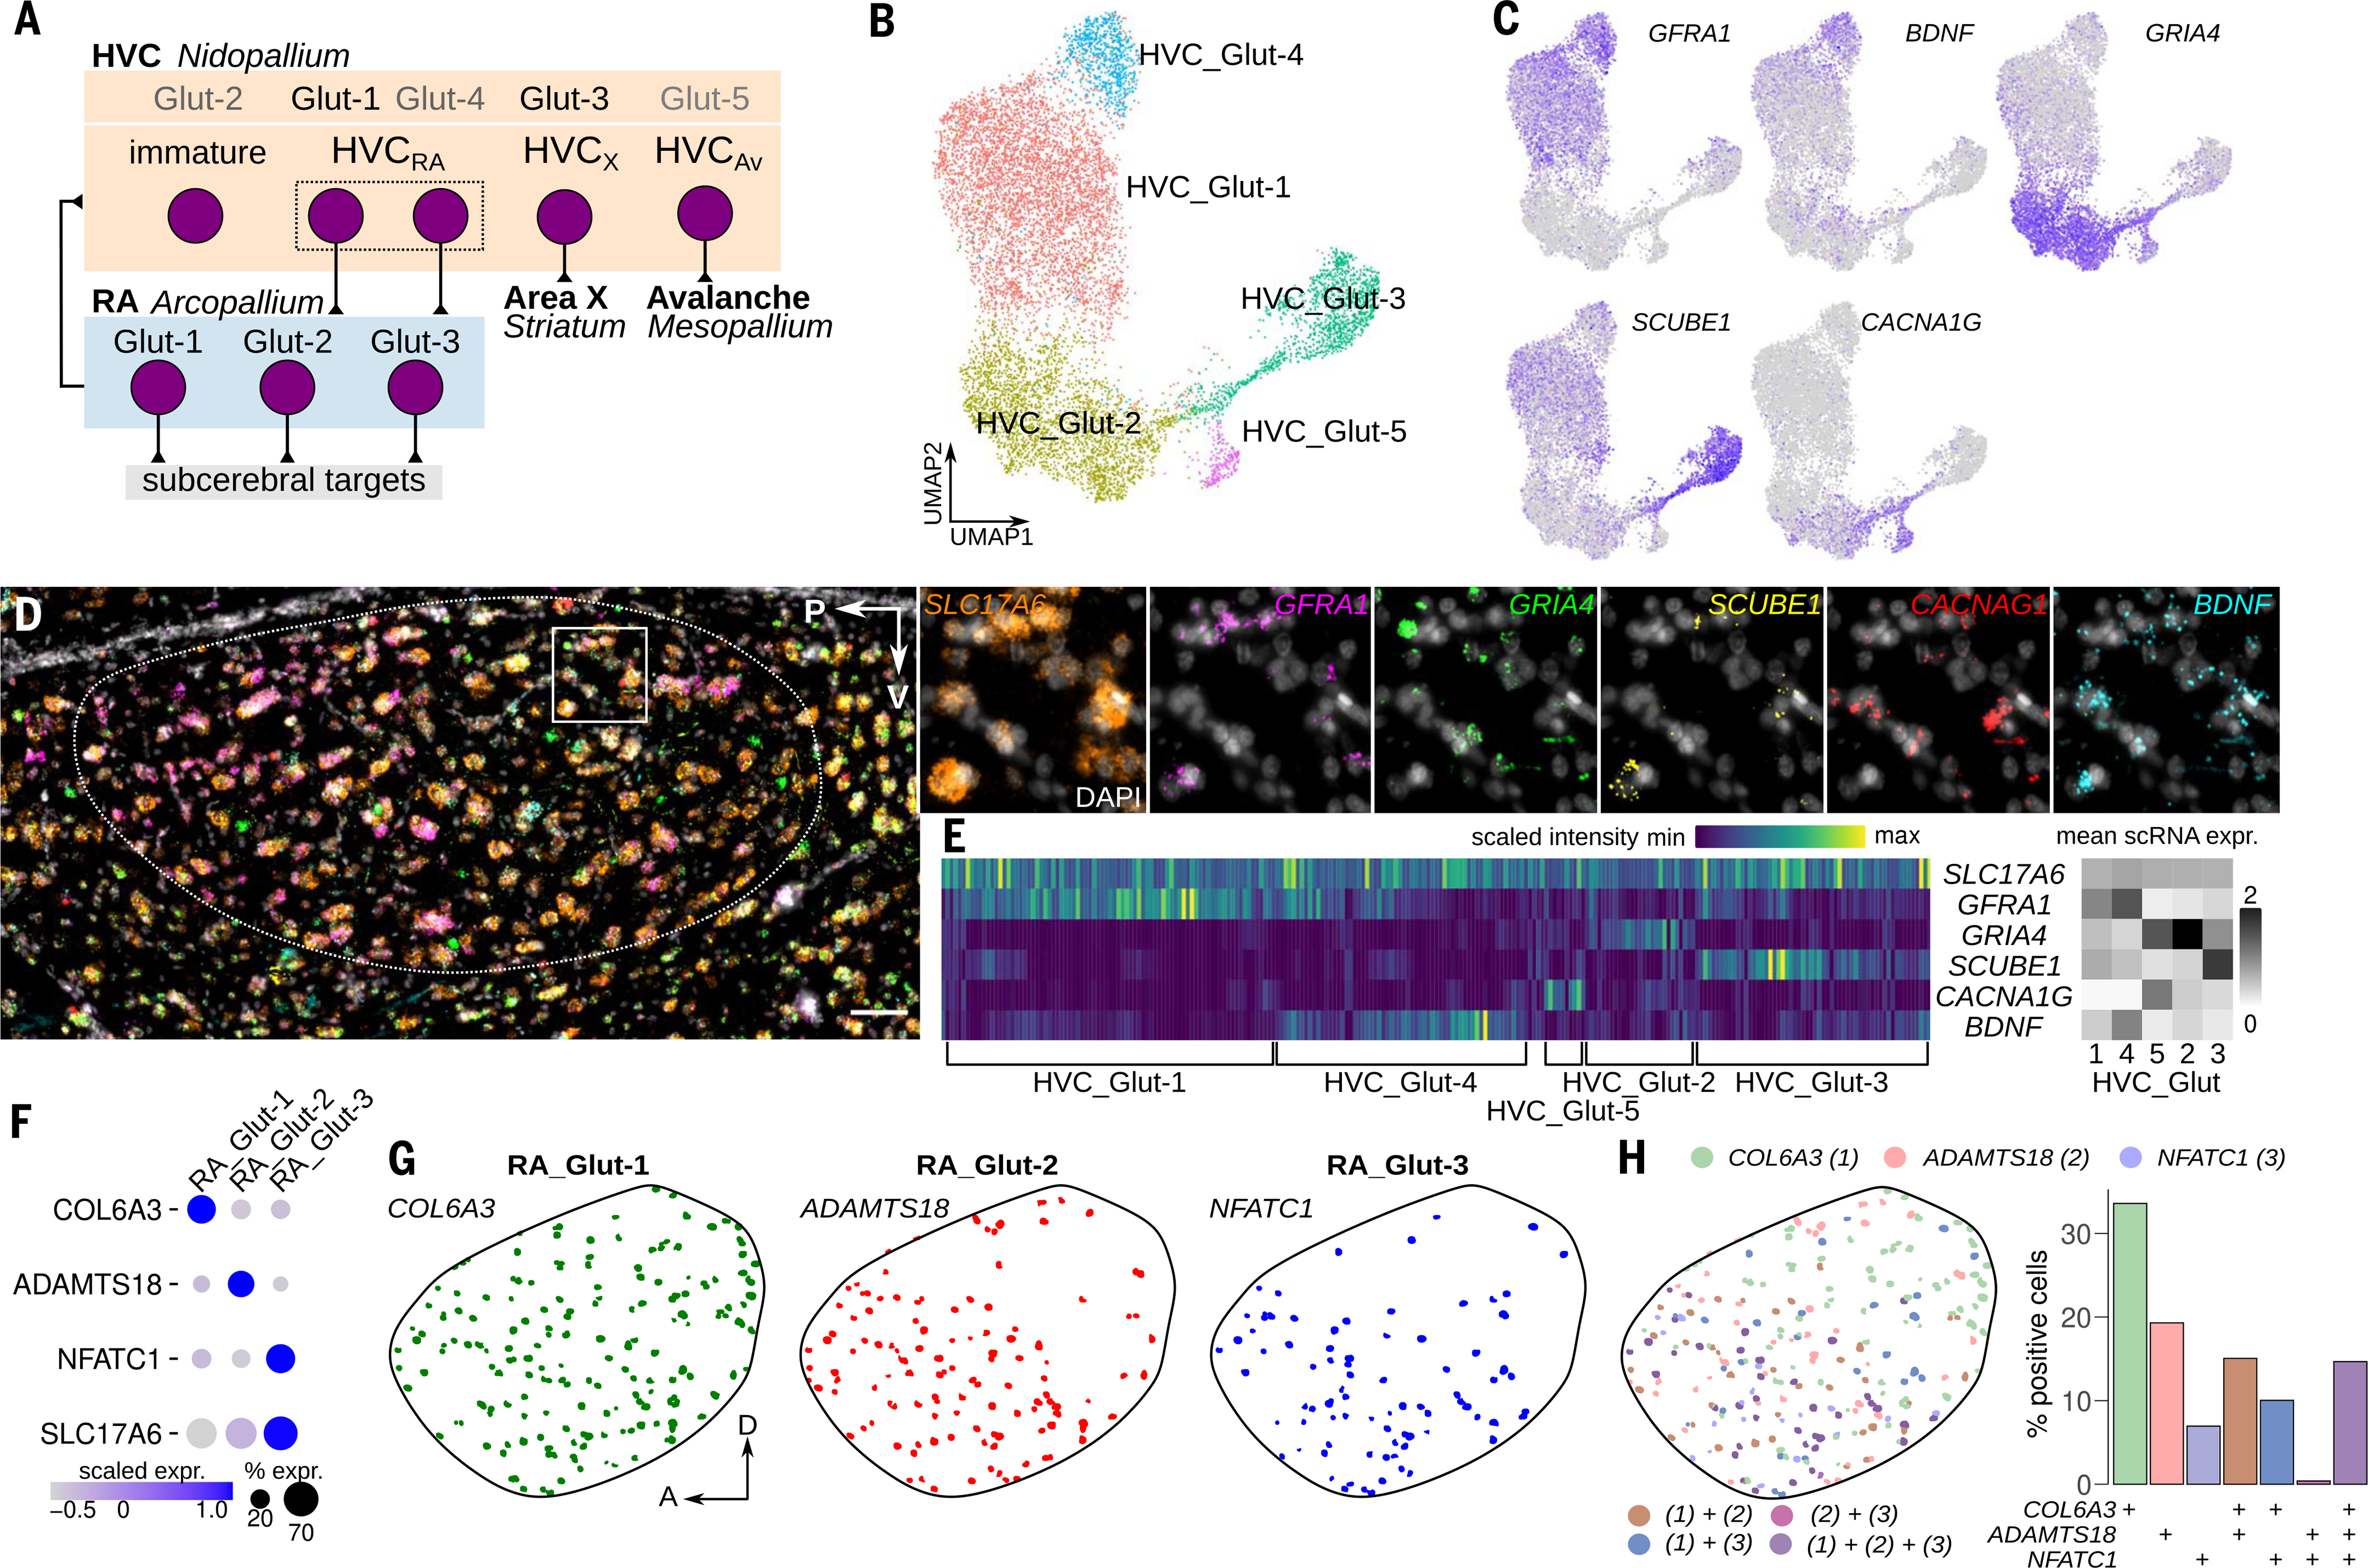
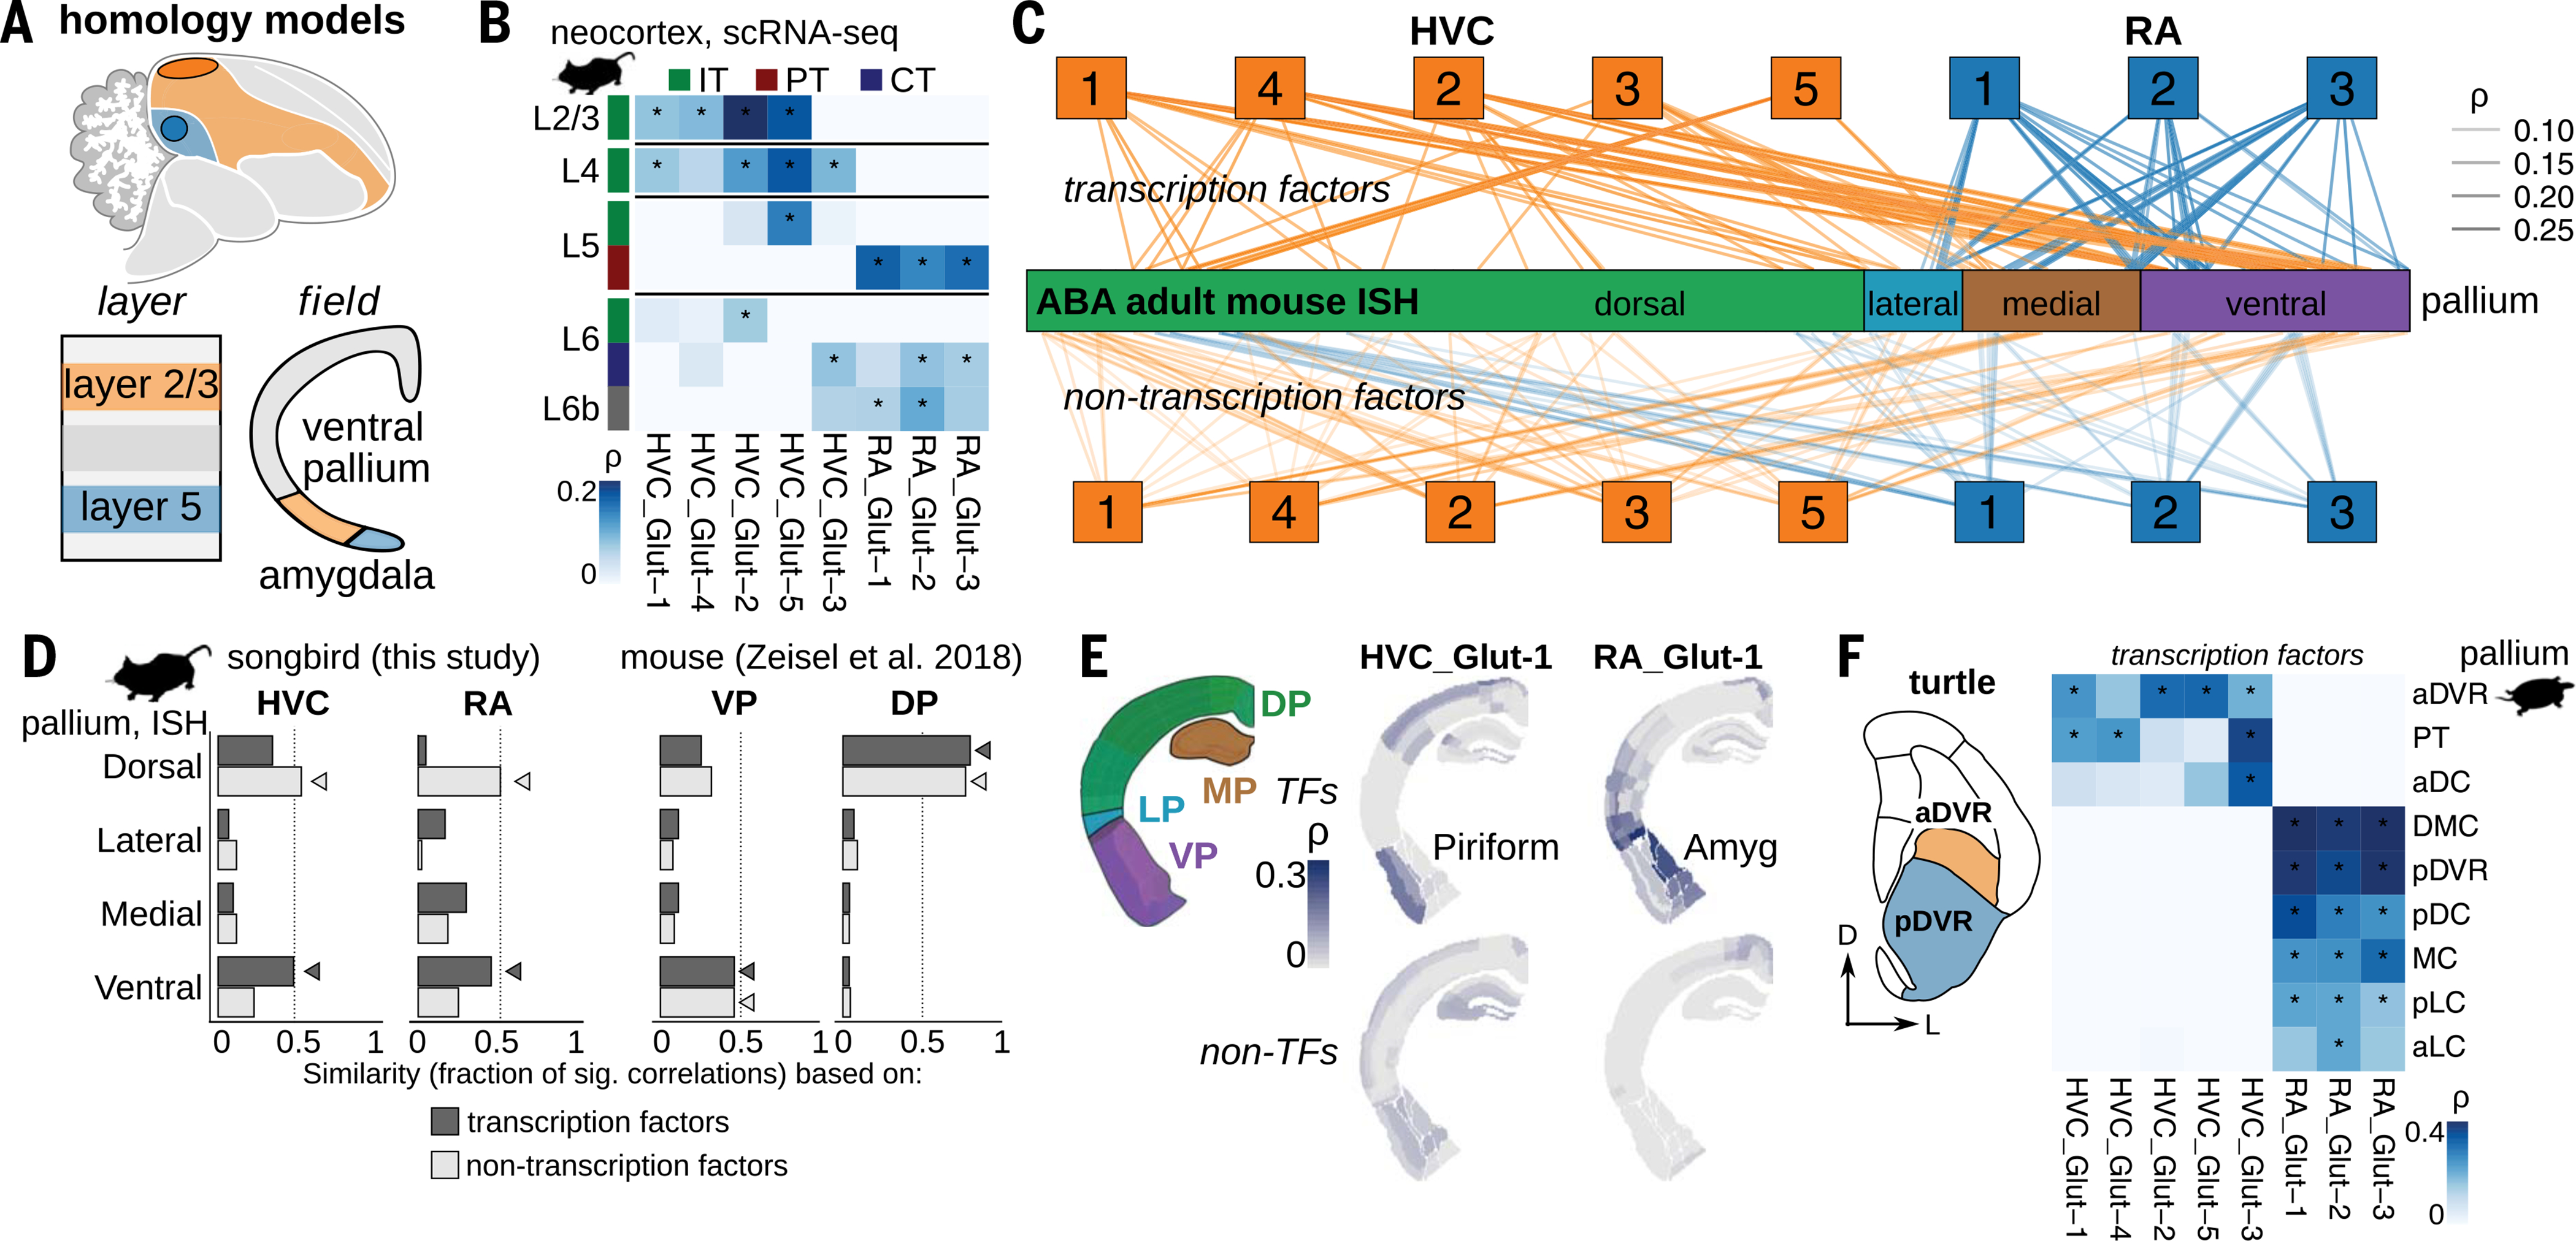
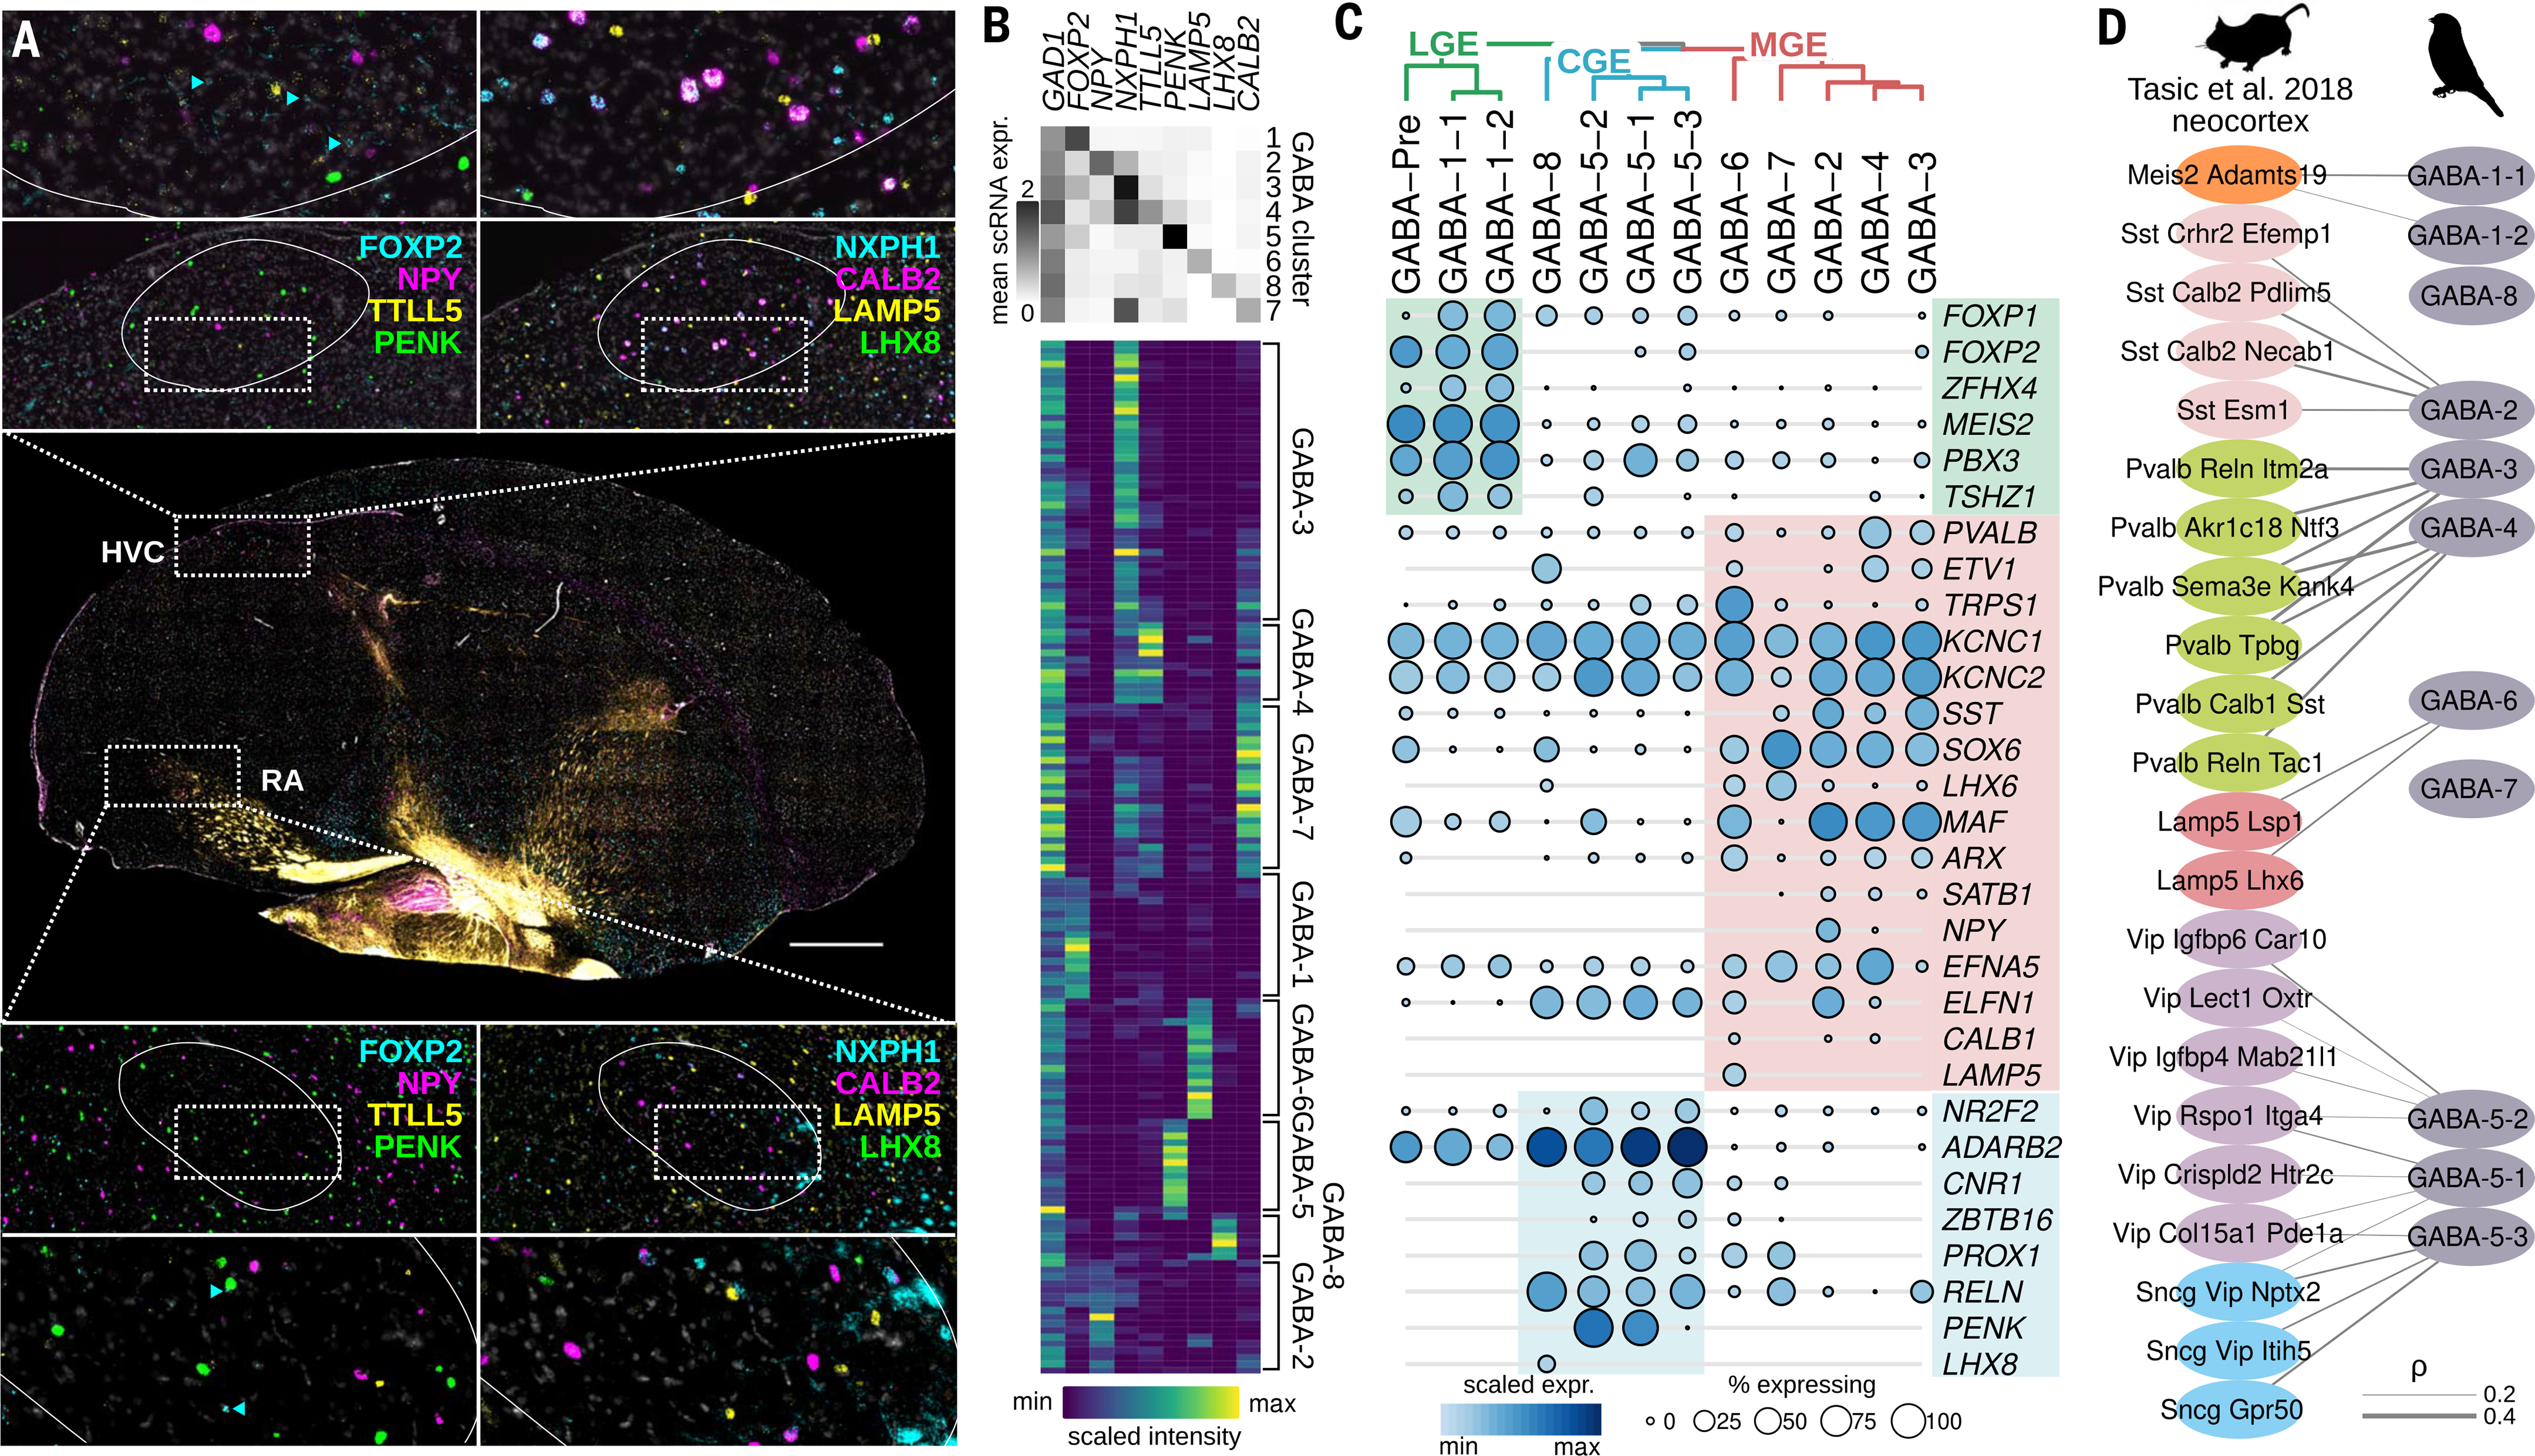
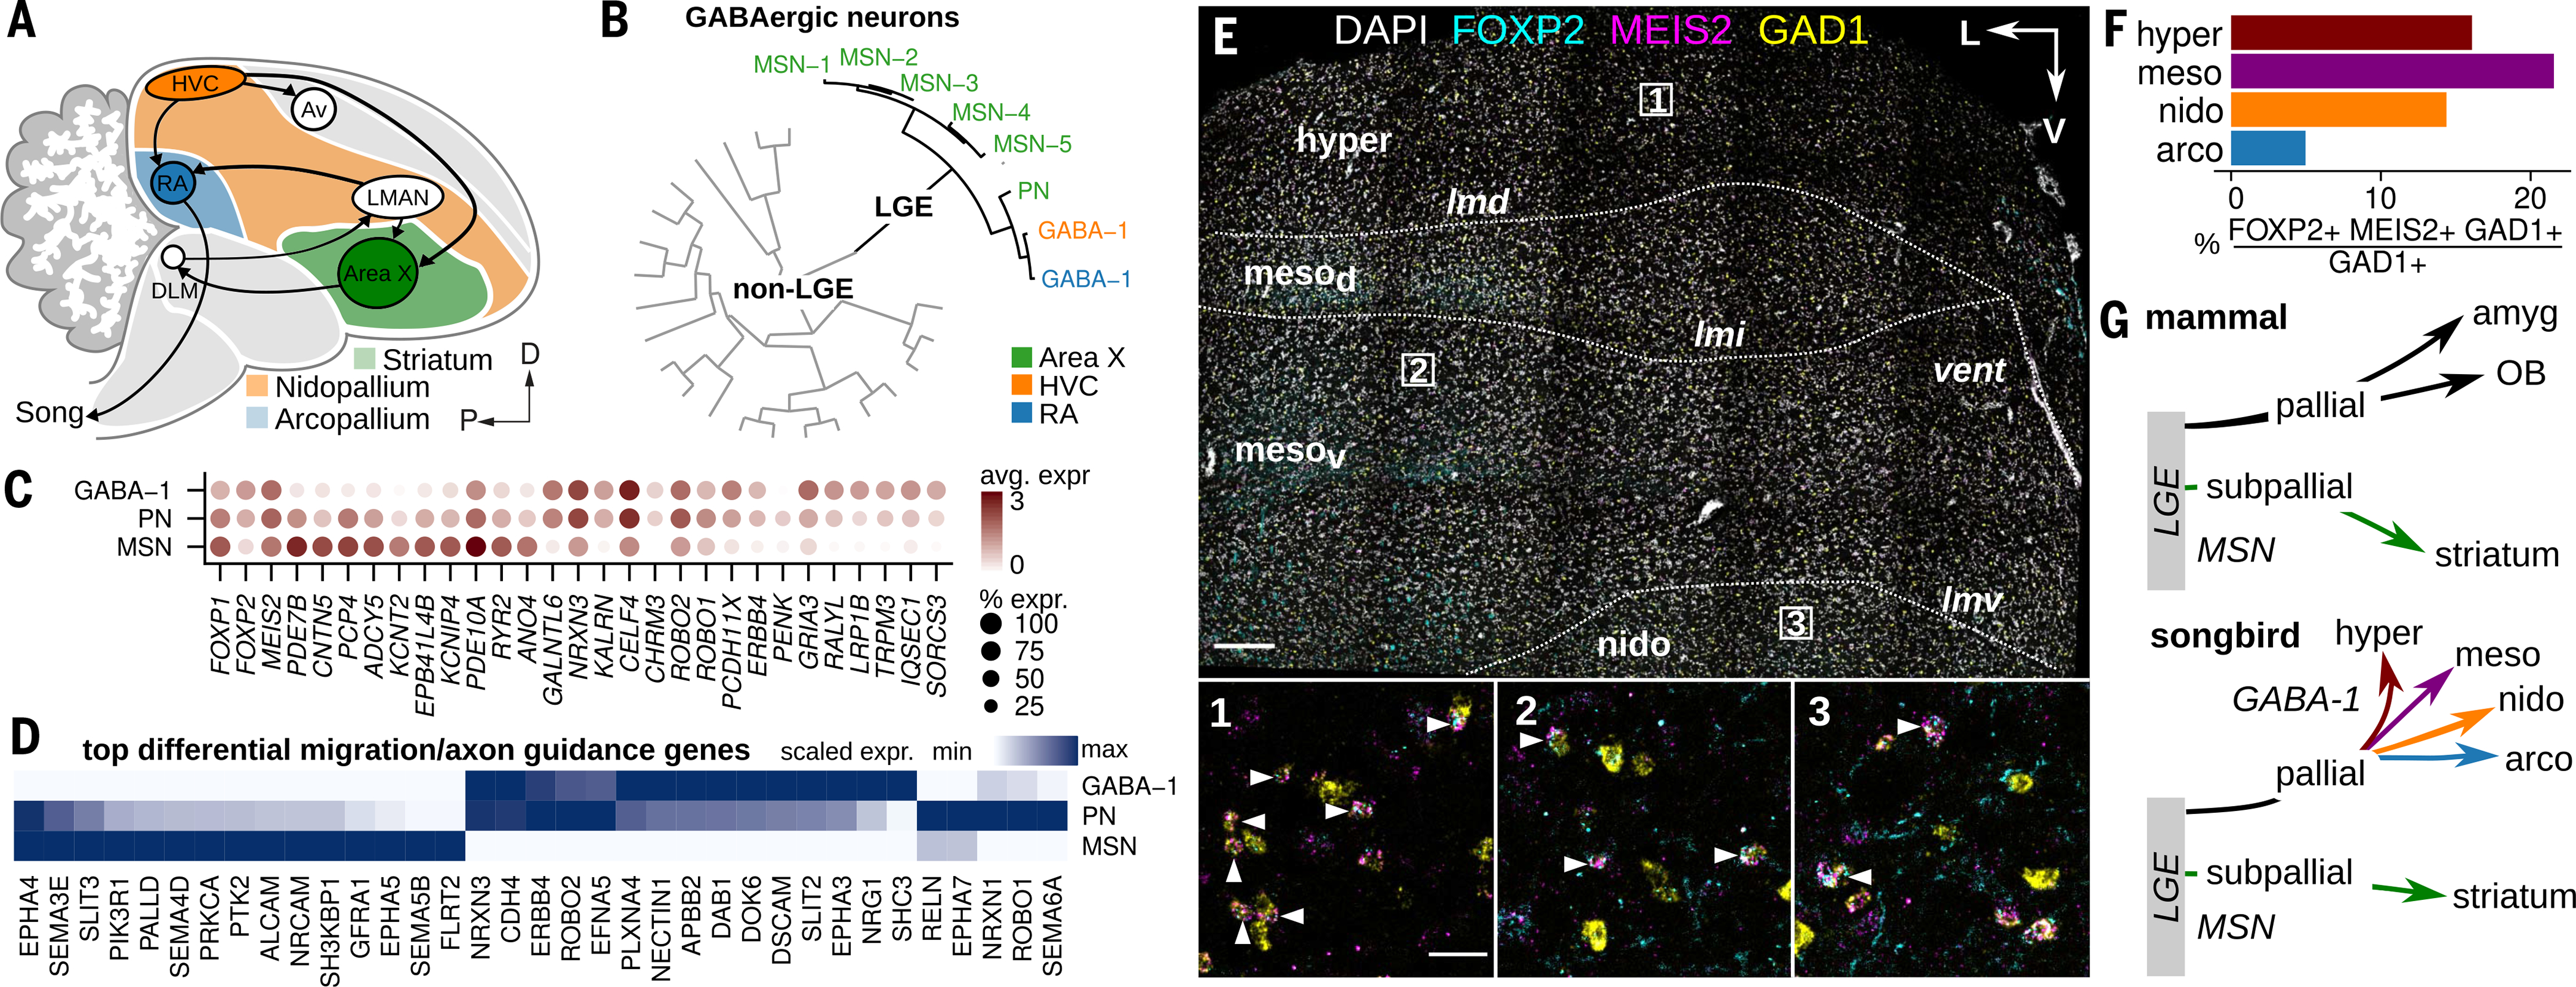
Birds display advanced behaviors, including vocal learning and problem-solving, yet lack a layered neocortex, a structure associated with complex behavior in mammals. To determine whether these behavioral similarities result from shared or distinct neural circuits, we used single-cell RNA sequencing to characterize the neuronal repertoire of the songbird song motor pathway. Glutamatergic vocal neurons had considerable transcriptional similarity to neocortical projection neurons; however, they displayed regulatory gene expression patterns more closely related to neurons in the ventral pallium. Moreover, while γ-aminobutyric acid-releasing neurons in this pathway appeared homologous to those in mammals and other amniotes, the most abundant avian class is largely absent in the neocortex. These data suggest that songbird vocal circuits and the mammalian neocortex have distinct developmental origins yet contain transcriptionally similar neurons.


Conflict of interest statement

Competing interests: The authors declare no competing interests.

Figures

Fig. 1.
Fig. 1.. Cell classes and neuronal diversity in songbird pallial premotor regions.
(A) Schematic highlighting the two forebrain nuclei of the song motor pathway: HVC (orange) and RA (blue). Each nucleus is a specialized substructure located in two large neuroanatomical domains: the nidopallium for HVC, and the arcopallium for RA. D, dorsal; P, posterior. (B) Schematic of the principal known projection classes in HVC and RA and their afferent and efferent connections. (C) UMAP (Uniform Manifold Approximation and Projection) plot of cells combined across species and regions colored by cell-type class. OPC, oligodendrocyte precursor cell. (D) Hierarchical clustering of average cluster expression profiles (see supplementary methods). Blocks correspond to HVC (orange) and RA (blue) and indicate the relative percentage of each cluster in each region. Values were rounded up to allow visualization of rare (<0.5%) but well-defined populations. GABA, GABAergic; Pre, neuronal precursor; Micro, microglia; Endo, endothelial; VLMC, vascular and leptomeningeal cells; Oligo, oligodendrocyte; Epen, ependymal; Astro, astrocyte; Glut, glutamatergic; RBC, red blood cell. (E and F) UMAP plots of (E) glutamatergic neurons (HVC_Glut-1 through HVC_Glut-5 and RA_Glut-1 through RA_Glut-3) and neurogenic lineage (Pre-1 through Pre-4) and (F) GABAergic neurons (GABA-1 through GABA-8) and GABAergic neurogenic lineage (GABA-Pre). Inset in (E) shows three distinct subclusters within RA.
Fig. 2.
Fig. 2.. Diversity of songbird glutamatergic neurons.
(A) Schematic of HVC and RA glutamatergic neuron classes with single-cell cluster assignments. These mappings were made using retrograde tracing combined with in situ hybridization (HVC_Glut-1 to HVCRA and HVC_Glut-3 to HVCX), transcriptional similarity to other classes (HVC_Glut-4 as a putative HVCRA subclass and HVC_Glut-2 as a putative immature neuron class), or relative abundance in the tissue (HVC_Glut-5 to HVCAv). (B) UMAP plot of HVC glutamatergic clusters and mappings to known glutamatergic projection classes. (C) UMAP plots of the expression of five marker genes GFRA1 (HVC_Glut-1/4), BDNF (HVC_Glut-4), GRIA4 (HVC_Glut-2), SCUBE1 (HVC_Glut-3), CACNA1G (HVC_Glut-5). (D) Example sagittal section of HVC (outlined) and signal from a six-channel in situ hybridization assay for HVC glutamatergic marker genes. Scale bar, 50 μm. Boxed region is enlarged at right and is split into single-channel images. (E) Quantification of in situ hybridization signal in SLC17A6-positive cells (n = 243) scaled by the maximum and minimum intensities for each gene. Heatmap columns are organized by hierarchical clustering. Labels below the heatmap indicate assignment of single-cell sequencing clusters to clusters derived from in situ hybridization data. For comparison, grayscale heatmap at right shows mean expression levels for each marker and cell type derived from sequencing. (F) Expression of SLC17A6 and marker genes in sequencing data for neurons from the three RA glutamatergic clusters. (G) Locations of RA glutamatergic clusters within RA, identified using in situ hybridizations against markers genes for each cluster: COL6A3 (RA_Glut-1), ADAMTS18 (RA_Glut-2), and NFATC1 (RA_Glut-3). A, anterior. (H) (Left) Overlaps of individual cell locations, colored by marker genes. (Right) Percentage of positive cells in each marker gene combination.
Fig. 3.
Fig. 3.. Songbird glutamatergic neurons exhibit features of both ventral pallial and neocortical classes.
(A) Alternative models of homology between song motor pathway (SMP) regions in the nidopallium (orange) and arcopallium (blue) and the mammalian pallium. A “nucleus-to-layer” hypothesis (“layer”) argues that these regions are homologous to specific cell types or layers of the mammalian neocortex, while a “pallial field” hypothesis (“field”) proposes that these regions are homologous to derivatives of the mammalian ventral pallium. (B) Spearman correlations between scaled average expression profiles of SMP glutamatergic neurons and mouse neocortical glutamatergic neurons grouped by class (43). IT, intratelencephalic; CT, corticothalamic; PT, pyramidal tract. Negative correlations set to zero. Asterisk indicates shuffled P < 0.05. (C) Correlation analysis between transcription factor (top) and non-transcription factor (bottom) expression profiles in SMP glutamatergic neurons and regional in situ hybridization data across mouse pallial regions (ABA, Allen Brain Atlas). Lines represent Spearman correlations with shuffled P < 0.05. Mouse pallial organization as defined in (88). (D) Fraction of significant correlations (shuffled P < 0.05) between mouse pallial regions and (left) SMP glutamatergic neurons or (right) mouse forebrain glutamatergic neurons (44). Arrowheads indicate the pallial region with the highest similarity for each comparison. (E) Spearman correlations between SMP glutamatergic neurons (HVC_Glut-1 and RA_Glut-1) and adult mouse pallium mapped onto coronal sections from the Adult Mouse ABA. MP/DP/LP/VP, medial/dorsal/lateral/ventral pallium. (F) Hypothesized homologies between subregions of the DVR in turtles and songbirds (12). Schematic is a coronal section from the turtle forebrain [adapted from (49)]. Spearman correlations between scaled average transcription factor expression profiles of SMP glutamatergic neurons and glutamatergic neurons from the turtle pallium, grouped by brain region (49). a/pDC, anterior/posterior dorsal cortex; PT, pallial thickening; (D)MC, (dorsal) medial cortex; a/pLC, anterior/posterior lateral cortex; a/pDVR, anterior/posterior dorsal ventricular ridge. Negative correlations set to zero. Asterisk indicates shuffled P < 0.05.
Fig. 4.
Fig. 4.. Diversity and organization of song motor pathway GABAergic neurons.
(A) In situ hybridization analysis of GAD1 and eight GABAergic subtype marker genes, FOXP2 (GABA-1), NPY (GABA-2), NXPH1 (GABA-3/4), TTLL5 (GABA-4), PENK (GABA-5), LAMP5 (GABA-6), CALB2 (GABA-7), and LHX8 (GABA-8). Shown is a sagittal Bengalese finch brain section with enlargements of HVC and RA. Each song motor pathway region is outlined in the enlarged images. Scale bar, 1 mm. Arrowheads in enlargements indicate examples of FOXP2- positive cells. (B) (Top) Average expression of GABAergic marker genes in single-cell clusters. (Bottom) Quantification of marker gene expression in GAD1-positive neurons from in situ hybridization in HVC and RA (n = 154), scaled by the maximum and minimum intensity values for each gene. Heatmap rows are organized by hierarchical clustering. Labels to the right of the heatmap indicate assignment of single-cell sequencing clusters to clusters derived from in situ hybridization data. (C) Hierarchical clustering and dotplot of songbird GABAergic neuron expression (sequencing data) shows organization by subpallial embryonic domain [markers from (49)]. Shade of dot represents mean expression within cluster, and size of dot represents percentage of cells within cluster expressing a given gene. LGE (lateral ganglionic eminence), green; MGE (medial ganglionic eminence), red; CGE (caudal ganglionic eminence), blue. (D) Correlation analysis between expression profiles of mouse neocortical (43) and song motor pathway GABAergic neurons. Lines represent Spearman correlations, with thickness scaled by correlation strength. Shown are the top four correlations for each comparison that are significant (shuffled P < 0.05) and are greater than 0.2. Labels correspond to the classification scheme used in the original publication.
Fig. 5.
Fig. 5.. Conserved GABAergic neuron identity across amniotes.
(A and B) Seurat anchor-based integration of mouse forebrain (44), turtle forebrain (49), and songbird motor pathway GABAergic neurons. UMAP plots of integrated datasets colored by (A) species and (B) cluster. For clarity, labels are shown only for mouse and finch datasets. OB, olfactory bulb; NGC, neurogliaform cells; MSNs, medium spiny neurons. Labels correspond to the classification schemes used in the original publications. (C and D) Predicted cross-species cluster similarities of songbird GABAergic neurons based on pairwise integration with (C) mouse and (D) turtle GABAergic neuron datasets. SST, somatostatin; Cck, cholecystokinin; PV, parvalbumin; HTR3A, serotonin receptor 3a; VIP, vasoactive intestinal peptide.
Fig. 6.
Fig. 6.. Broad distribution of LGE-derived interneurons in the songbird brain.
(A) Schematic illustrating the location of Area X within the avian striatum (green) in relation to the nidopallium (orange) and arcopallium (blue). (B) Hierarchical clustering of HVC, RA, and Area X GABAergic neuron expression profiles, divided by LGE-class and non-LGE-class neurons. PN, pallidal-like neuron. (C) Expression of top differentially expressed genes in LGE-derived GABAergic classes and three genes associated with striatal GABAergic neurons (FOXP1, FOXP2, and MEIS2). Shade of dot represents mean expression within cluster, and size of dot represents percentage of cells within the cluster expressing that gene. (D) Scaled expression of top differentially expressed axon guidance and neuron migration related genes across avian LGE-class neurons. (E) Three-color in situ hybridization of LGE-marker genes FOXP2 and MEIS2 and GABAergic marker gene GAD1. Shown is a coronal section from the anterior Bengalese finch brain. Major anatomical divisions: hyper, hyperpallium; mesod, dorsal mesopallium; mesov, ventral mesopallium; nido, nidopallium; Lamina: lmd, dorsal mesopallial lamina; lmi, intermediate mesopallial lamina; lmv, ventral mesopallial lamina. Nomenclature is as defined in (13). Scale bar, 200 μm. (Insets) Magnifications of three regions indicated in the main panel. Arrowheads indicate triple-positive cells. Scale bar, 50 μm. (F) Quantification of FOXP2/MEIS2/GAD1 in situ hybridization data, shown as percentage GAD1-positive cells in four pallial domains that coexpress FOXP2 and MEIS2. (G) Comparison of LGE-class GABAergic migration in mammals and songbirds. In mammals, the LGE contributes neurons in the pallial amygdala (intercalated cells), the olfactory bulb (granule and periglomerular interneurons), and subpallial structures such as the striatum (MSNs). Amyg, pallial amygdala.

Comment in

References

    1. Konopka G, Roberts TF, Insights into the neural and genetic basis of vocal communication. Cell 164, 1269–1276 (2016). doi: 10.1016/j.cell.2016.02.039; - DOI - PMC - PubMed
    1. Brainard MS, Doupe AJ, Translating birdsong: Songbirds as a model for basic and applied medical research. Annu. Rev. Neurosci 36, 489–517 (2013). doi: 10.1146/annurev-neuro-060909-152826; - DOI - PMC - PubMed
    1. Striedter GF, Northcutt RG, Brains Through Time: A Natural History of Vertebrates (Oxford Univ. Press, 2020).
    1. Gunturkun O, Bugnyar T, Cognition without cortex. Trends Cogn. Sci 20, 291–303 (2016). doi: 10.1016/j.tics.2016.02.001; - DOI - PubMed
    1. Jarvis ED, Evolution of vocal learning and spoken language. Science 366, 50–54 (2019). doi: 10.1126/science.aax0287; - DOI - PubMed

Publication types