. 2021 Feb 11;12(1):959.
doi: 10.1038/s41467-021-21015-8.

GWAS for autoimmune Addison's disease identifies multiple risk loci and highlights AIRE in disease susceptibility

Collaborators, Affiliations

GWAS for autoimmune Addison's disease identifies multiple risk loci and highlights AIRE in disease susceptibility

Daniel Eriksson et al. Nat Commun. .

Abstract

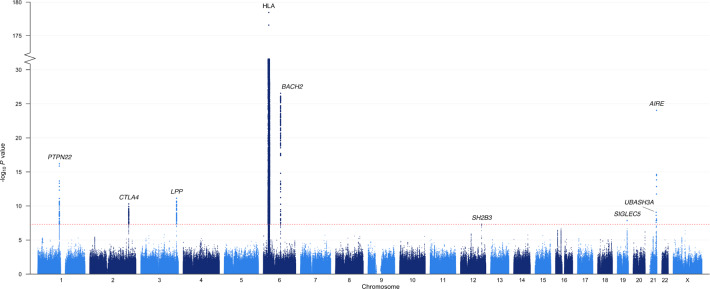
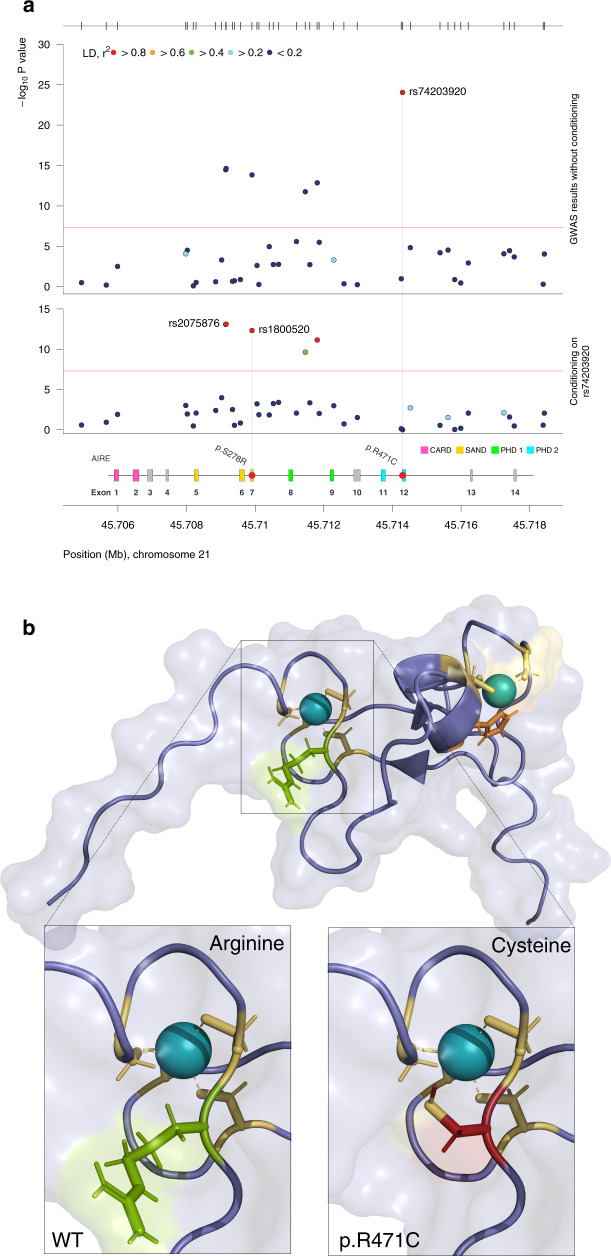
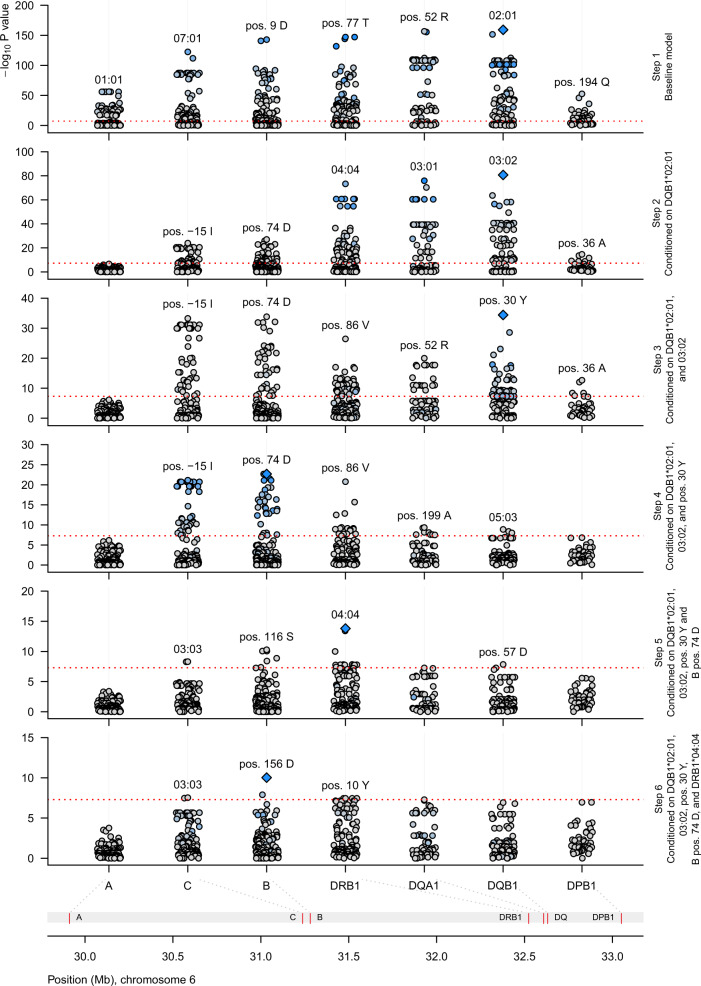
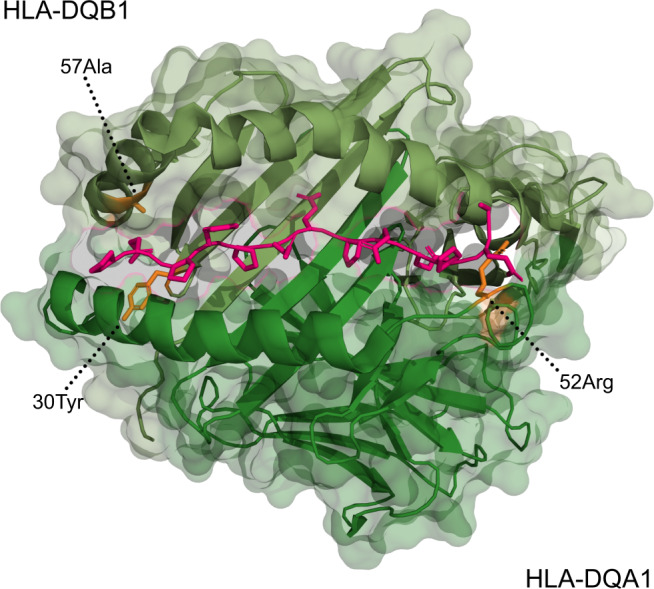
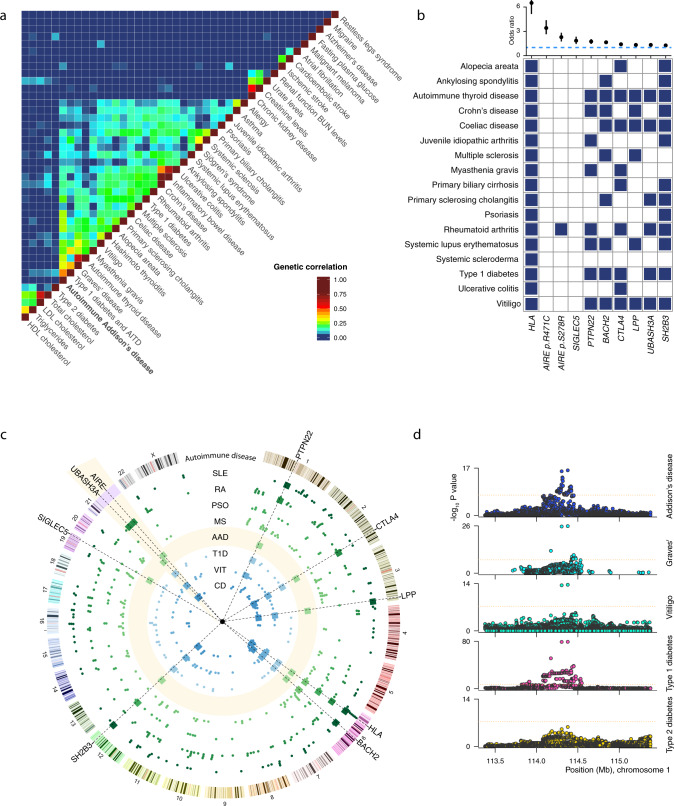
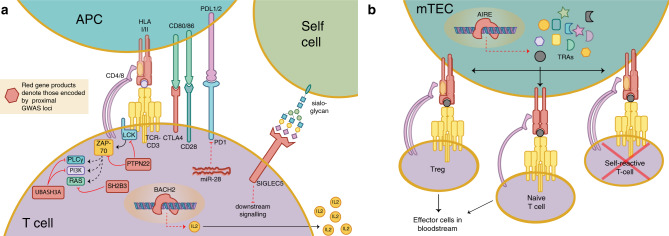
Autoimmune Addison's disease (AAD) is characterized by the autoimmune destruction of the adrenal cortex. Low prevalence and complex inheritance have long hindered successful genetic studies. We here report the first genome-wide association study on AAD, which identifies nine independent risk loci (P < 5 × 10⁻⁸). In addition to loci implicated in lymphocyte function and development shared with other autoimmune diseases such as HLA, BACH2, PTPN22 and CTLA4, we associate two protein-coding alterations in Autoimmune Regulator (AIRE) with AAD. The strongest, p.R471C (rs74203920, OR = 3.4 (2.7-4.3), P = 9.0 × 10⁻²⁵) introduces an additional cysteine residue in the zinc-finger motif of the second PHD domain of the AIRE protein. This unbiased elucidation of the genetic contribution to development of AAD points to the importance of central immunological tolerance, and explains 35-41% of heritability (h2).


Conflict of interest statement

The authors declare no competing interests.

Figures

Fig. 1
Fig. 1. Manhattan plot for the genome-wide association study of autoimmune Addison’s disease with 1223 cases and 4097 controls.
The –log10 P values from logistic regression on the y-axis are plotted against their physical chromosomal position on the x-axis for all SNPs across chromosomes 1–22 and X. Labels correspond to the prioritized or nearest genes. The dotted red bar marks the genome-wide significance level (P ≤ 5 × 10−8). The y-axis has been gapped to include the top SNP in the HLA region.
Fig. 2
Fig. 2. Two coding variants in the Autoimmune Regulator gene (AIRE) are independently associated with autoimmune Addison’s disease.
a GWAS results without (upper panel) and with (lower panel) conditioning, on the top SNP rs74203920. The secondary association peak, including rs1800520, remains equally significant after conditioning reflecting its independent association. The –log10 P values from logistic regression of 1223 cases and 4097 controls are plotted against their physical chromosomal position. The red bars represent the genome-wide significance level (5 × 10−8). b The location and consequences of the coding change p.R471C in the PHD2 domain of AIRE. The additional charge from the cysteine residue (red) is in close proximity to the zinc ion (teal). Arginine is marked in green, histidine in orange, and wildtype (WT) cysteines in yellow.
Fig. 3
Fig. 3. Stepwise regression of the HLA association identifies the major genetic determinants of autoimmune Addison’s disease.
The figure displays the results from the first six steps of regression modeling of the HLA risk effects—alleles and amino acids. Starting with a baseline model comprising sex and five principal components as covariates, we tested every allele and amino acid in turn for association with AAD (Supplementary Note). Additive, recessive, dominant, overdominant, and general variable encodings were compared with likelihood ratio tests and/or Bayesian information criterion. The allele or amino acid residue with most compelling evidence for association was included in the model at every step, and reconsidered at all subsequent steps. Downstream regression models were conditioned on the effects selected from previous models. The y-axes show the –log10 P values from stepwise logistic regressions of 1223 cases and 4097 controls. The dashed horizontal lines indicate genome-wide significance (P < 5 × 10−8). Diamonds mark the most significant effect. Blue color indicates strong linkage disequilibrium (r2) with the most significant effect, gray color indicates no correlation.
Fig. 4
Fig. 4. Associated amino acids in the HLA-DQ heterodimer.
Two amino acids in HLA-DQB1 and one amino acid in HLA-DQA1 were found to be associated with autoimmune Addison’s disease. A tyrosine at the 30th position and an alanine at the 57th position of HLA-DQB1 (top) and an arginine at the 52nd position of HLA-DQA1 (bottom) have been marked in orange. To visualize the binding pocket, a peptide ligand (gliadin) from the original crystal structure has been marked in pink.
Fig. 5
Fig. 5. Shared genetic features.
a Human diseases and traits studied in GWAS were clustered to reveal shared genetic risk factors. Diseases/traits are ordered by unsupervised hierarchical clustering, and color scale indicates genetic correlation. b Loci implicated in autoimmune Addison’s disease in order of decreasing effect size (odds ratio and 95% CI), 1223 cases, and 4097 controls. The horizontal, dashed line marks OR = 1. Blue squares indicate genome-wide significant associations for the diseases and loci/variants, respectively. c Circos plot representing the loci associated with AAD (boxes) and other autoimmune diseases (dots). The AAD track is highlighted in yellow, and the yellow wedge on chromosome 21 is magnified ×15. SLE-systemic lupus erythematosus, RA-rheumatoid arthritis, PSO-psoriasis, MS-multiple sclerosis, T1D-type 1 diabetes, VIT-vitiligo, CD-coeliac disease. d Side-by-side comparison of association statistics at the PTPN22 locus across a selection of autoimmune diseases. AAD statistics were calculated using logistic regression for 1223 cases and 4097 controls.
Fig. 6
Fig. 6. T-cell regulation and AAD GWAS associated regions.
a Graphic representation of selected aspects of T-cell regulation, with gene products implicated by GWAS association proximity in red (antigen-presenting cell, APC). b AIRE activity in medullary thymic epithelial cell (mTEC), promoting expression of tissue-restricted antigens (TRAs) for the education of T cells.

References

    1. Husebye ES, et al. Consensus statement on the diagnosis, treatment and follow-up of patients with primary adrenal insufficiency. J. Intern. Med. 2014;275:104–115. doi: 10.1111/joim.12162. - DOI - PubMed
    1. Takayanagi R, Miura K, Nakagawa H, Nawata H. Epidemiologic study of adrenal gland disorders in Japan. Biomed. Pharmacother. 2000;54(Suppl 1):164s–168s. doi: 10.1016/S0753-3322(00)80036-0. - DOI - PubMed
    1. Olafsson AS, Sigurjonsdottir HA. Increasing prevalence of Addison disease: results from a nationwide study. Endocr. Pract. 2015;22:30–35. doi: 10.4158/EP15754.OR. - DOI - PubMed
    1. Husebye ES, Anderson MS, Kämpe O. Autoimmune polyendocrine syndromes. N. Engl. J. Med. 2018;378:2543–2544. doi: 10.1056/NEJMra1713301. - DOI - PubMed
    1. Winqvist O, Karlsson FA, Kämpe O. 21-Hydroxylase, a major autoantigen in idiopathic Addison’s disease. Lancet. 1992;339:1559–1562. doi: 10.1016/0140-6736(92)91829-W. - DOI - PubMed

Publication types

Substances