. 2021 Feb 11;12(1):943.
doi: 10.1038/s41467-021-21220-5.

Methodological quality of COVID-19 clinical research

Affiliations

Methodological quality of COVID-19 clinical research

Richard G Jung et al. Nat Commun. .

Abstract

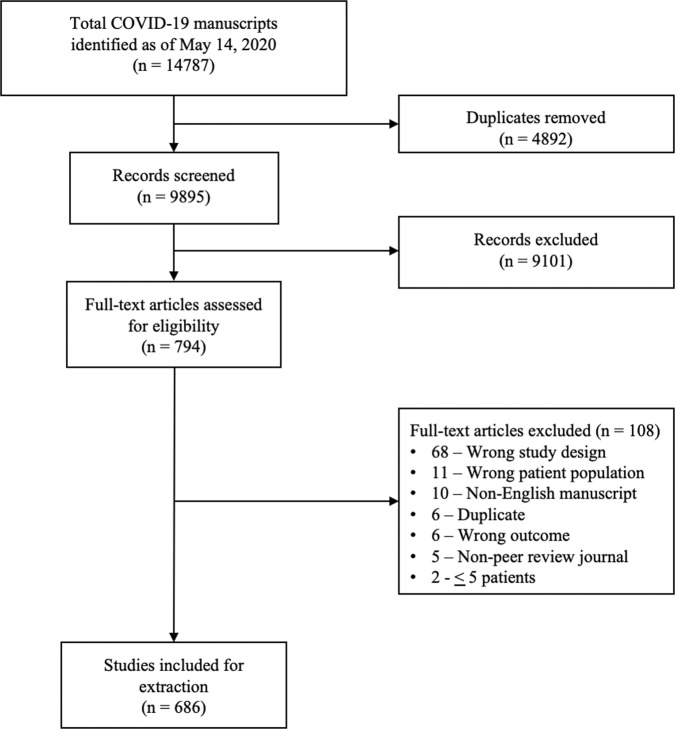
The COVID-19 pandemic began in early 2020 with major health consequences. While a need to disseminate information to the medical community and general public was paramount, concerns have been raised regarding the scientific rigor in published reports. We performed a systematic review to evaluate the methodological quality of currently available COVID-19 studies compared to historical controls. A total of 9895 titles and abstracts were screened and 686 COVID-19 articles were included in the final analysis. Comparative analysis of COVID-19 to historical articles reveals a shorter time to acceptance (13.0[IQR, 5.0-25.0] days vs. 110.0[IQR, 71.0-156.0] days in COVID-19 and control articles, respectively; p < 0.0001). Furthermore, methodological quality scores are lower in COVID-19 articles across all study designs. COVID-19 clinical studies have a shorter time to publication and have lower methodological quality scores than control studies in the same journal. These studies should be revisited with the emergence of stronger evidence.


Conflict of interest statement

B.H. reports funding as a clinical trial investigator from Abbott, Boston Scientific and Edwards Lifesciences outside of the submitted work. The remaining authors declare no competing interests.

Figures

Fig. 1
Fig. 1. Literature search and selection of COVID-19 articles.
A total of 14787 articles were identified and 4892 duplicate articles were removed. Overall, 9895 articles were screened by title and abstract leaving 794 articles for full-text screening. Over 108 articles were excluded, leaving a total of 686 articles that underwent methodological quality assessment.
Fig. 2
Fig. 2. COVID-19 clinical literature quality assessment.
A Distribution of COVID-19 case series studies scored using the Murad tool (n = 380). B Distribution of COVID-19 cohort studies scored using the Newcastle–Ottawa Scale (n = 199). C Distribution of COVID-19 case–control studies scored using the Newcastle–Ottawa Scale (n = 38). D Distribution of COVID-19 diagnostic studies scored using the QUADAS-2 tool (n = 63). In panel D, blue represents low risk of bias and orange represents high risk of bias.
Fig. 3
Fig. 3. Differences in methodological quality scores in COVID-19 by secondary outcomes.
A When stratified by time of acceptance (13.0 days), increased time of acceptance was associated with higher case series score (n = 186 for <13 days and n = 193 for >=13 days; p = 0.02). B Increased time of acceptance was associated with higher NOS cohort score (n = 112 for <13 days and n = 144 for >=13 days; p = 0.003). C No difference in time of acceptance and case–control score was observed (n = 18 for <13 days and n = 27 for >=13 days; p = 0.34). D No difference in time of acceptance and diagnostic risk of bias (QUADAS-2) was observed (n = 43 for <13 days and n = 33 for >=13 days; p = 0.23). E When stratified by impact factor (IF ≥10), high IF was associated with higher case series score (n = 466 for low IF and n = 60 for high IF; p < 0.0001). F High IF was associated with higher NOS cohort score (n = 262 for low IF and n = 68 for high IF; p = 0.01). G No difference in IF and case–control score was observed (n = 62 for low IF and n = 2 for high IF; p = 0.052). H No difference in IF and QUADAS-2 was observed (n = 101 for low IF and n = 2 for high IF; p = 0.93). I When stratified by geographical region, no difference in geographical region and case series score was observed (n = 276 Asia/Oceania, n = 135 Americas, and n = 143 Europe/Africa; p = 0.10). J Geographical region was associated with differences in cohort score (n = 177 Asia/Oceania, n = 81 Americas, and n = 89 Europe/Africa; p = 0.01). K No difference in geographical region and case–control score was observed (n = 37 Asia/Oceania, n = 13 Americas, and n = 14 Europe/Africa; p = 0.81). L No difference in geographical region and QUADAS-2 was observed (n = 49 Asia/Oceania, n = 28 Americas, and n = 28 Europe/Africa; p = 0.34). In panels AD, orange represents lower median time of acceptance and blue represents high median time of acceptance. In panels EH, red is low impact factor and blue is high impact factor. In panels IL, orange represents Asia/Oceania, blue represents Americas, and brown represents Europe. Differences in distributions were analysed by two-sided Kruskal–Wallis test. Differences in diagnostic risk of bias were quantified by Chi-squares test. p < 0.05 was considered statistically significant.
Fig. 4
Fig. 4. Differences in methodological quality scores in COVID-19 compared to historical control articles.
A Time to acceptance was reduced in COVID-19 articles compared to control articles (13.0 [IQR, 5.0–25.0] days vs. 110.0 [IQR, 71.0–156.0] days, n = 347 for COVID-19 and n = 414 for controls; p < 0.0001). B When compared to historical control articles, COVID-19 articles were associated with lower case series score (n = 277 for COVID-19 and n = 277 for controls; p < 0.0001). C COVID-19 articles were associated with lower NOS cohort score compared to historical control articles (n = 174 for COVID-19 and n = 174 for controls; p < 0.0001). D COVID-19 articles were associated with lower NOS case–control score compared to historical control articles (n = 32 for COVID-19 and n = 32 for controls; p = 0.003). E COVID-19 articles were associated with higher diagnostic risk of bias (QUADAS-2) compared to historical control articles (n = 53 for COVID-19 and n = 53 for controls; p = 0.02). For panel A, boxplot captures 5, 25, 50, 75 and 95% from the first to last whisker. Orange represents COVID-19 articles and blue represents control articles. Two-sided Mann–Whitney U-test was conducted to evaluate differences in time to acceptance between COVID-19 and control articles. Differences in study quality scores were evaluated by two-sided Kruskal–Wallis test. Differences in diagnostic risk of bias were quantified by Chi-squares test. p < 0.05 was considered statistically significant.

References

    1. Chen Q, Allot A, Lu Z. Keep up with the latest coronavirus research. Nature. 2020;579:193. doi: 10.1038/d41586-020-00694-1. - DOI - PubMed
    1. Mahase, E. Covid-19: 146 researchers raise concerns over chloroquine study that halted WHO trial. BMJ10.1136/bmj.m2197 (2020). - PubMed
    1. Chalmers I, Glasziou P. Avoidable waste in the production and reporting of research evidence. Lancet. 2009;374:86–89. doi: 10.1016/S0140-6736(09)60329-9. - DOI - PubMed
    1. Burns PB, Rohrich RJ, Chung KC. The levels of evidence and their role in evidence-based medicine. Plast. Reconstr. Surg. 2011;128:305–310. doi: 10.1097/PRS.0b013e318219c171. - DOI - PMC - PubMed
    1. Alexander PE, et al. COVID-19 coronavirus research has overall low methodological quality thus far: case in point for chloroquine/hydroxychloroquine. J. Clin. Epidemiol. 2020;123:120–126. doi: 10.1016/j.jclinepi.2020.04.016. - DOI - PMC - PubMed

Publication types

Grants and funding

LinkOut - more resources