. 2021 Feb 11;12(1):964.
doi: 10.1038/s41467-020-20877-8.

Rare genetic variants affecting urine metabolite levels link population variation to inborn errors of metabolism

Collaborators, Affiliations

Rare genetic variants affecting urine metabolite levels link population variation to inborn errors of metabolism

Yurong Cheng et al. Nat Commun. .

Erratum in

Abstract

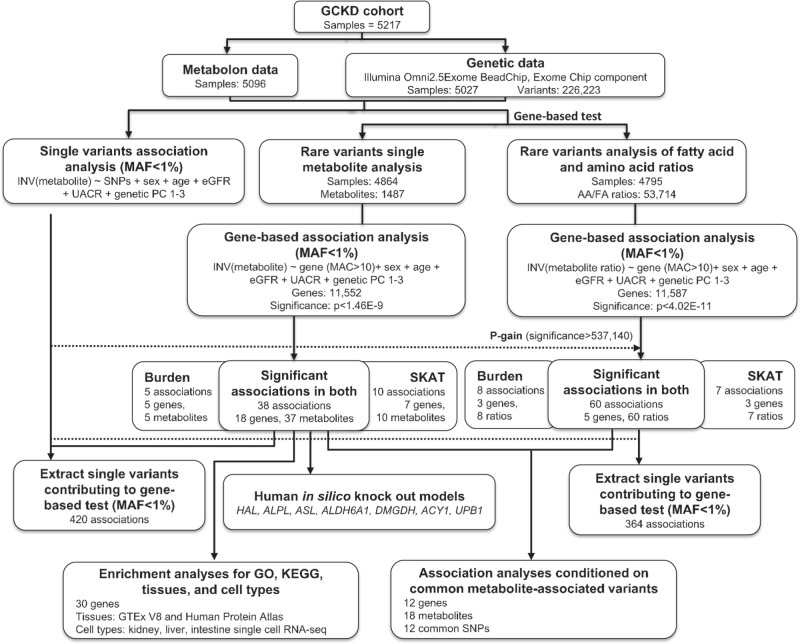
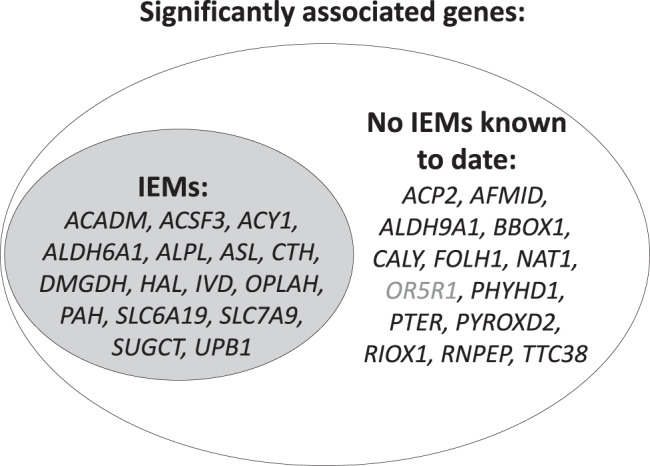
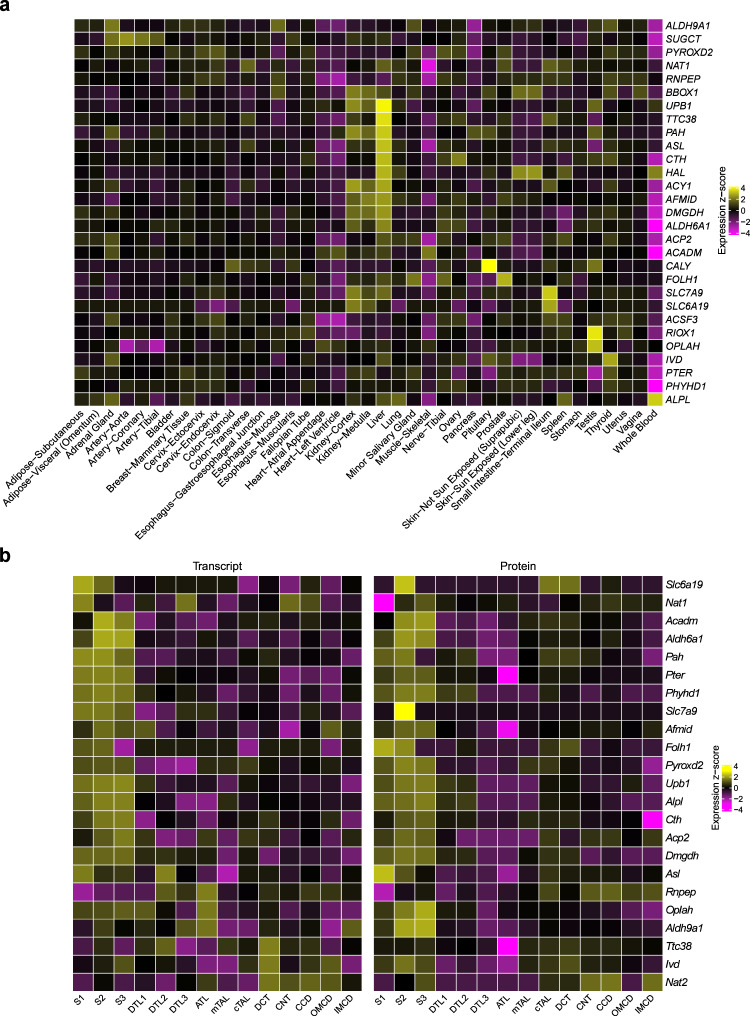
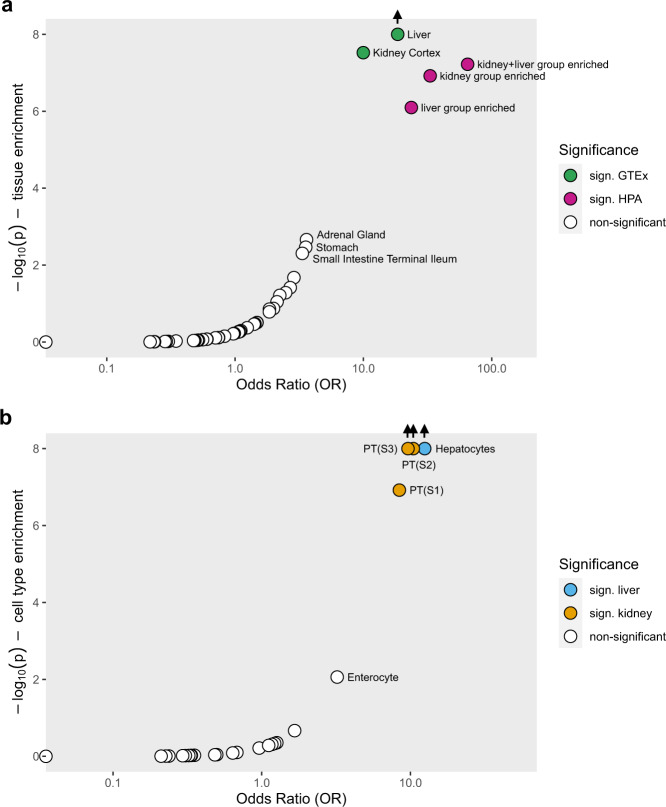
Metabolite levels in urine may provide insights into genetic mechanisms shaping their related pathways. We therefore investigate the cumulative contribution of rare, exonic genetic variants on urine levels of 1487 metabolites and 53,714 metabolite ratios among 4864 GCKD study participants. Here we report the detection of 128 significant associations involving 30 unique genes, 16 of which are known to underlie inborn errors of metabolism. The 30 genes are strongly enriched for shared expression in liver and kidney (odds ratio = 65, p-FDR = 3e-7), with hepatocytes and proximal tubule cells as driving cell types. Use of UK Biobank whole-exome sequencing data links genes to diseases connected to the identified metabolites. In silico constraint-based modeling of gene knockouts in a virtual whole-body, organ-resolved metabolic human correctly predicts the observed direction of metabolite changes, highlighting the potential of linking population genetics to modeling. Our study implicates candidate variants and genes for inborn errors of metabolism.


Conflict of interest statement

J.M. and D.F.F. are full time employees of Bayer AG, Division Pharma. All remaining authors declare no competing interests.

Figures

Fig. 1
Fig. 1. Rare variant analysis workflow.
The GCKD study enrolled 5,217 patients with moderate CKD. Non-targeted metabolite identification and quantification were conducted from urine samples using the Metabolon HD4 platform. Genotyping was performed with the Illumina Omni2.5Exome Chip. After quality control and data cleaning, genotypes of 226,233 exome chip variants and 1487 metabolites and 53,714 ratios of fatty acids and amino acids were analyzed for 4864 and 4795 patients, respectively. A burden test and the sequence kernel association test (SKAT) were carried out for each gene and each metabolite or metabolite ratio using the seqMeta R package (Methods). Carrier status of variants with minor allele frequency <1% and likely to be functional (splicing, nonsynonymous, stop gain, and stoploss) was evaluated. We used an additive genetic model and adjusted for sex, age, eGFR, UACR, and principal components. Statistical significance was defined using a Bonferroni correction and set at 1.46E−09 (single metabolites) and 4.02E-11 (ratios). Ratio results were further filtered by a p-gain of >537,140 to select ratios that carry information beyond its single metabolites (Methods). The same model was applied to obtain single variant association results for the variants included in the gene-based tests. In silico knockout models to validate findings were generated in a Virtual Metabolic Human. Enrichment analyses of significant genes were carried out using GO terms, KEGG pathways, and gene expression data from tissues and cell types. Conditional analyses were carried out to assess the effect of nearby common metabolite-associated variants on the findings from this study. MAF: minor allele frequency.
Fig. 2
Fig. 2. Effect size on metabolite levels (Y-axis) versus frequency (X-axis) of rare, putative damaging variants included in gene-based tests.
The symbols depict the effect of each variant that contributed to an aggregate association signal on the level of each significantly associated metabolite. Variants associated with more than one metabolite are therefore included for each metabolite because their associated effects can differ. The Y-axis represents the variants’ effects on inverse normal transformed metabolite levels; one unit represents one standard deviation. Color-coding and marker shape represent the consequence of 218 variants in the 26 metabolite-associated genes: white circle (nonsynonymous), cyan square (splice), orange triangle (stop-gain/loss).
Fig. 3
Fig. 3. Effect size on metabolite levels (Y-axis) versus rare variant carrier status (X-axis).
Argininosuccinate levels are displayed by ASL rare variant carrier status (a) and levels of phenylalanine, tyrosine and their ratio for PAH rare variant carrier status (b). The Y axis represents metabolite levels after inverse normal transformation (INV), which allows for comparisons across metabolites. Units correspond to standard deviations. The symbol color indicates observed rare variant carrier status, and symbol shape variant consequence. The box ranges from the 25th to the 75th percentile of transformed metabolite levels, the median is indicated by a line, and whiskers end at the last observed value within 1.5*(interquartile range) away from the box. Sample sizes: n = 4863 individuals for argininosuccinate; n = 4839 individuals for phenylalanine, phenylalanine/tyrosine ratio and tyrosine.
Fig. 4
Fig. 4. Venn diagram of the involvement of identified genes in inborn errors of metabolism (IEMs).
All of the known IEMs are recessively inherited. Genes for which no IEMs are yet identified represent candidate genes in individuals with extreme levels of the implicated metabolites. Gray font is used for OR5R1 because of the extended linkage disequilibrium in the region extending to FOLH1, which may therefore not represent an independent signal.
Fig. 5
Fig. 5. Enrichment analyses highlight specific tissues and cell types in which the identified genes are highly expressed.
Human tissues (a) as well as rat micro-dissected kidney tubule cell types (b) were evaluated. Tissues are based on GTEx Project data V8, transcriptome data of kidney tubule cell types on the publication by Lee et al. and proteome data of same cell types on the publication by Limbutara et al.. a Gene expression levels are from 39 non-brain tissues from GTEx V8. Presented values are the mean of log10-transformed Transcript Per Million (TPM) of samples in each tissue. Only 29 genes are displayed because OR5R1 is not included in GTEx V8. b S1, first segment of proximal tubule; S2, second segment of proximal tubule; S3, third segment of proximal tubule; DTL1, descending thin limb type 1 (short-looped nephron); DTL2, descending thin limb type 2 (long-looped nephron); DTL3, descending thin limb type 3 (long-looped nephron); ATL, ascending thin limb; mTAL, medullary thick ascending limb; cTAL, cortical thick ascending limb; DCT, distal convoluted tubule; CNT, connecting tubule; CCD, cortical collecting duct; OMCD, outer medullary collecting duct; IMCD, inner medullary collecting duct. Presented values are the mean of log10-transformed TPM of samples in each cell type. There was no rat homolog for SUGCT; NAT1 has two homologues (NAT1 and NAT2). ACSF3, ACY1, BBOX1, CALY, HAL, OR5R1, and RIOX1 were not included in the transcriptome dataset. Source data are provided as a Source Data file.
Fig. 6
Fig. 6. Enrichment analysis of the 30 significantly associated genes in human tissues and cell types.
Enrichment analyses were performed across 39 human tissues represented in GTEx Project V8, and in liver, kidney and both liver and kidney from the Human Protein Atlas (HPA) (a); and across cell types from kidney, liver and gut based on single-cell RNA-sequencing data (b). Source data are provided as a Source Data file.

References

    1. Pearson H. Meet the human metabolome. Nature. 2007;446:8. - PubMed
    1. Wishart DS, et al. HMDB: the Human Metabolome Database. Nucleic Acids Res. 2007;35:D521–D526. - PMC - PubMed
    1. Wishart DS, et al. HMDB 4.0: the human metabolome database for 2018. Nucleic Acids Res. 2018;46:D608–D617. - PMC - PubMed
    1. Noronha A, et al. The Virtual Metabolic Human database: integrating human and gut microbiome metabolism with nutrition and disease. Nucleic Acids Res. 2019;47:D614–D624. - PMC - PubMed
    1. McCarty DJ, Hollander JL. Identification of urate crystals in gouty synovial fluid. Ann. Intern. Med. 1961;54:452–460. - PubMed

Publication types