. 2021 Feb 11;11(1):3599.
doi: 10.1038/s41598-021-83138-8.

MUTYH is associated with hepatocarcinogenesis in a non-alcoholic steatohepatitis mouse model

Affiliations

MUTYH is associated with hepatocarcinogenesis in a non-alcoholic steatohepatitis mouse model

Hiroki Sakamoto et al. Sci Rep. .

Abstract

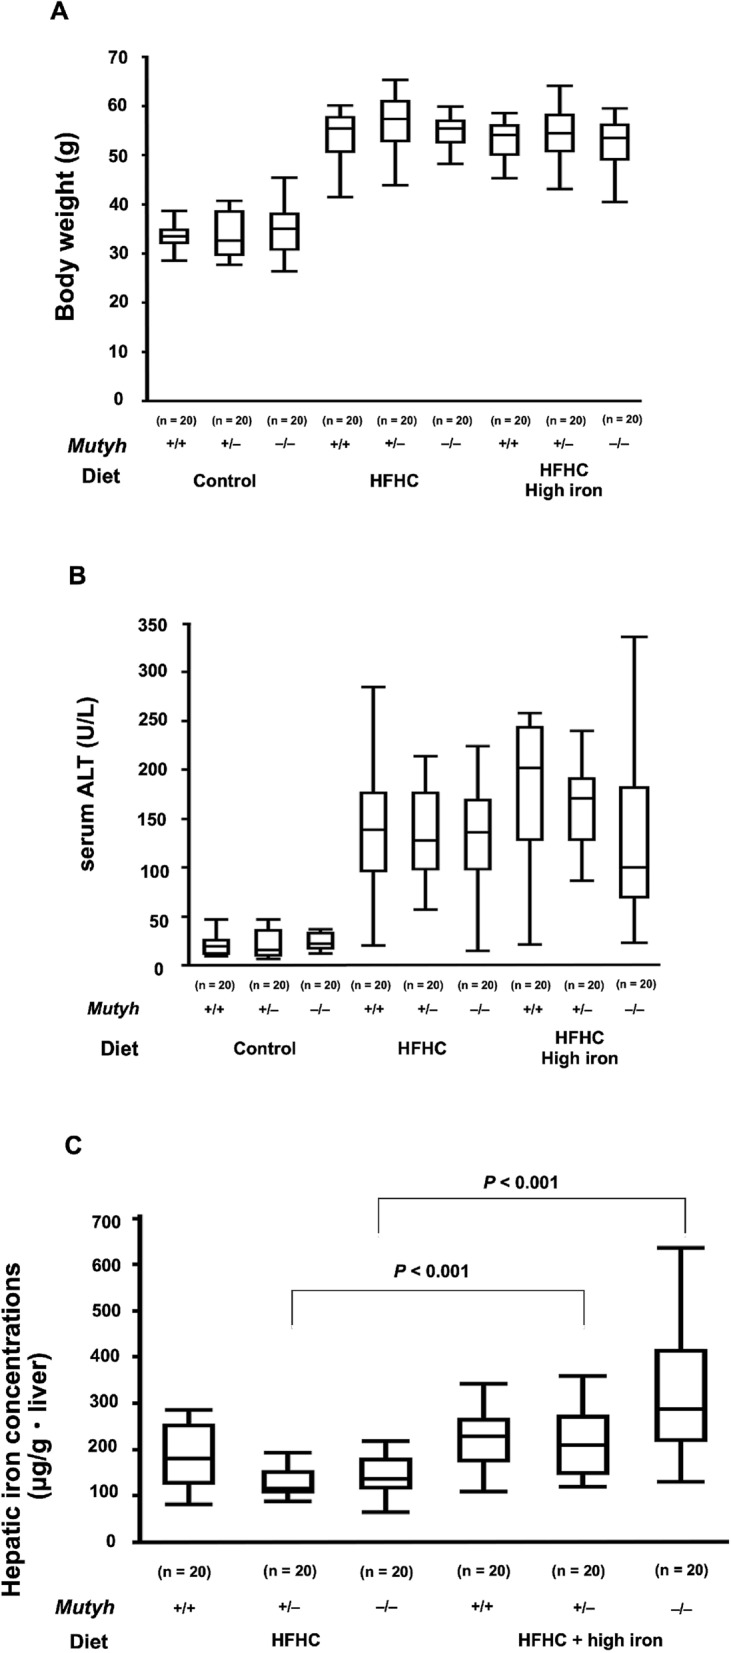
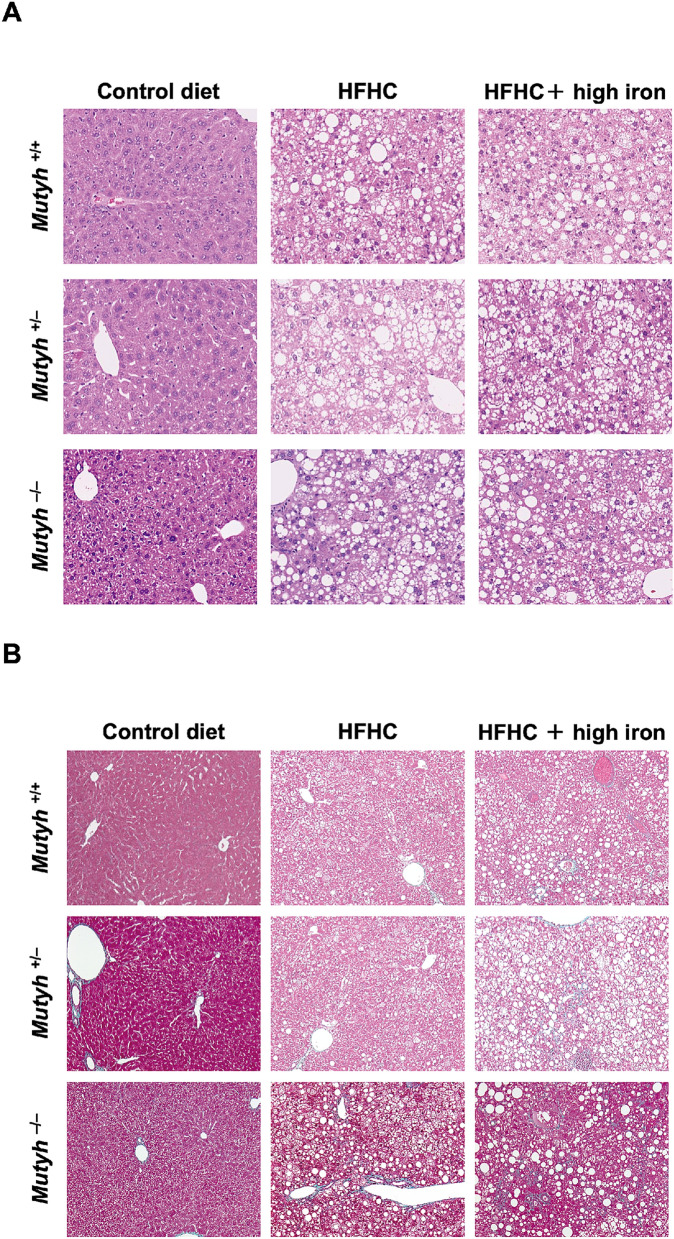
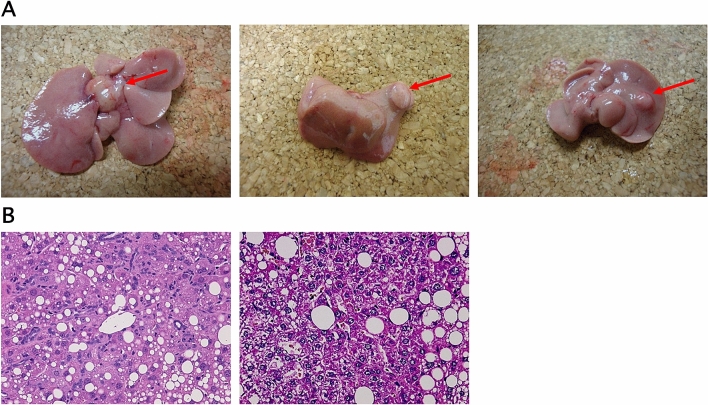
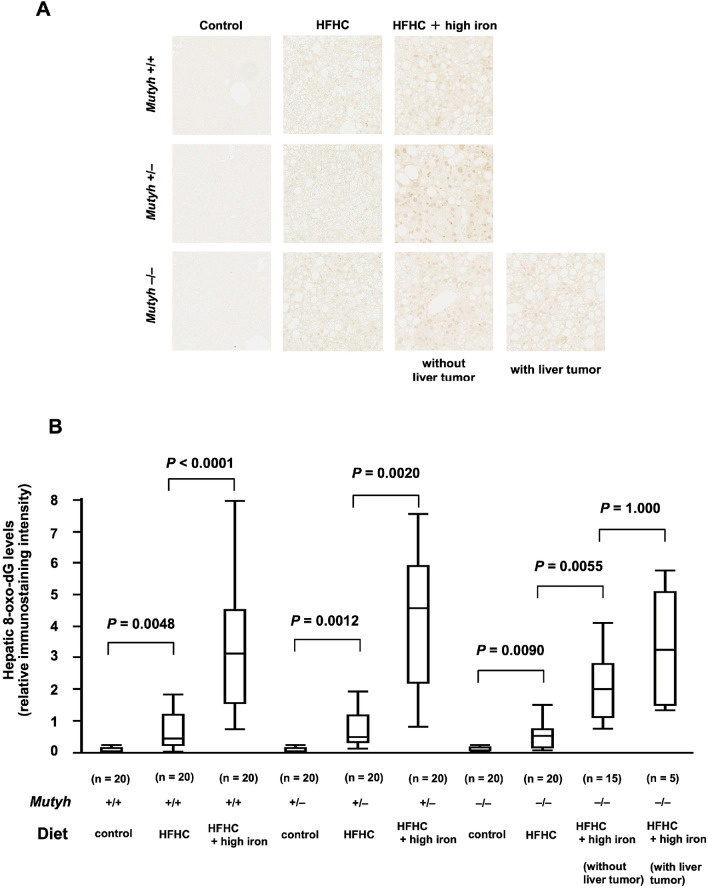
Non-alcoholic steatohepatitis (NASH)-related HCC is associated with oxidative stress. However, the mechanisms underlying the development of NASH-related HCC is unclear. MUTYH is one of the enzymes that is involved in repair of oxidative DNA damage. The aim of this study was to investigate the association between MUTYH and NASH-related hepatocarcinogenesis. MUTYH wild-type (Mutyh+/+), heterozygous (Mutyh+/-), and MUTYH-null (Mutyh-/-) mice were fed a high-fat high-cholesterol (HFHC) diet or HFHC + high iron diet (20 mice per group) for 9 months. Five of 20 Mutyh-/- mice fed an HFHC + high iron diet developed liver tumors, and they developed more liver tumors than other groups (especially vs. Mutyh+/+ fed an HFHC diet, P = 0.0168). Immunohistochemical analysis revealed significantly higher accumulation of oxidative stress markers in mice fed an HFHC + high iron diet. The gene expression profiles in the non-tumorous hepatic tissues were compared between wild-type mice that developed no liver tumors and MUTYH-null mice that developed liver tumors. Gene Set Enrichment Analysis identified the involvement of the Wnt/β-catenin signaling pathway and increased expression of c-Myc in MUTYH-null liver. These findings suggest that MUTYH deficiency is associated with hepatocarcinogenesis in patients with NASH with hepatic iron accumulation.


Conflict of interest statement

The authors declare no competing interests.

Figures

Figure 1
Figure 1
(A) Body weights, (B) serum ALT and (C) hepatic iron concentrations. Body weights (A) and serum ALT (B) are significantly higher in the groups fed with an HFHC diet (the HFHC diet group and the HFHC + high iron diet group) than the control group (A): Mutyh+/+, HFHC diet group vs. Mutyh+/+, control diet group; P < 0.001, Mutyh+/−, HFHC diet group vs. Mutyh+/−, control diet group ; P < 0.001, Mutyh−/−, HFHC diet group vs. Mutyh−/−, control diet group; P = 0.002, Mutyh+/+, HFHC + high iron diet group vs. Mutyh+/+, HFHC diet group; P = 0.0925, MUTYH+/−, HFHC + high iron diet group vs. Mutyh+/−, HFHC diet group; P = 0.5256, Mutyh−/−, HFHC + high iron diet group vs. Mutyh−/−, HFHC diet group; P = 0.8564) (B): Mutyh+/+, HFHC diet group vs. Mutyh+/+, control diet group; P < 0.001, Mutyh+/−, HFHC diet group vs. Mutyh+/−, control diet group ; P = 0.0082, Mutyh−/−, HFHC diet group vs. Mutyh−/−, control diet group ; P < 0.001, Mutyh+/+, HFHC + high iron diet group vs. Mutyh+/+, HFHC diet group ; P = 0.0232, Mutyh+/−, HFHC + high iron diet group vs. Mutyh+/−, HFHC diet group ; P = 0.0613, Mutyh−/−, HFHC + high iron diet group vs. Mutyh−/−, HFHC diet group ; P = 0.7415). Hepatic iron concentrations (C) are significantly higher in the high iron diet groups of mice with genotypes of Mutyh+/− and Mutyh−/− (Mutyh+/+, HFHC + high iron diet group vs. Mutyh+/+, HFHC diet group; P = 0.3359, Mutyh+/−, HFHC + high iron diet group vs. Mutyh+/−, HFHC diet group; P < 0.001, Mutyh−/−, HFHC + high iron diet group vs. Mutyh−/−, HFHC diet group; P < 0.0001). Data are shown as box plots for each group of mice. Median values are shown by the line within the box. The bottom and top edges of the boxes represent the 25th and 75th percentiles, respectively. ALT, alanine aminotransferase; HFHC, high-fat high-carbohydrate.
Figure 2
Figure 2
(A) Liver section (H&E × 100). In the groups fed an HFHC diet, prominent hepatic steatosis is seen associated with inflammatory infiltration and hepatocyte ballooning, regardless of a high-iron diet. No difference was seen between the genotypes. (B) Liver section (Masson trichrome stain × 100). In groups fed an HFHC diet, mild fibrosis was seen around the central veins, portal veins, and hepatocytes. HFHC, high-fat high-carbohydrate; H&E, hematoxylin & eosin.
Figure 3
Figure 3
Mutyh−/− mice fed an HFHC + high iron diet developed liver tumors. (A) Arrows indicate liver tumors. Gross liver appearance of Mutyh−/− mice fed an HFHC + high iron diet, showing single tumor foci at the time of necropsy. (B) Liver tumor sections (H&E × 100). HFHC, high-fat high-carbohydrate; H&E, hematoxylin & eosin.
Figure 4
Figure 4
Liver sections stained with 4-HNE stain. (A) The intensity of 4-HNE immunostaining was scored from 0 to 3; 0 no staining, 1 mild (punctuated labeling), 2 moderate (dense labeling in a few cells), 3 strong (dense and homogenous labeling in numerous cells). At least five random fields were examined for each sample and the average of the scores was determined as the 4-HNE index. (B) The 4-HNE stain index. The index was significantly higher in the HFHC diet groups than the control diet group (Mutyh+/+, HFHC diet group vs. Mutyh+/+, control diet group; P = 0.438, Mutyh+/−, HFHC diet group vs. Mutyh+/−, control diet group; P = 0.0441, Mutyh−/−, HFHC diet group vs. Mutyh−/−, control diet group; P = 0.0424) and significantly higher in the HFHC + high-iron diet groups than the HFHC diet groups (Mutyh+/+, HFHC + high-iron diet group vs. Mutyh+/+, HFHC diet group; P = 0.0033, Mutyh+/−, HFHC + high-iron diet group vs. Mutyh+/−, HFHC diet group; P < 0.0001, Mutyh−/−, HFHC + high-iron diet group vs. Mutyh−/−, HFHC diet group; P = 0.0013). There was no significant difference in the index according to the presence or absence of tumor development (P = 1.000). Data analysed with a Kruskal–Wallis test followed by Dunn–Bonferroni test. For all data analysis P < 0.05 considered significant. Data are shown as box plots for each group of mice. Median values are shown by the line within the box. The bottom and top edges of the boxes represent the 25th and 75th percentiles, respectively. HFHC, high-fat high-carbohydrate; 4-HNE, 4-hydroxynonenal.
Figure 5
Figure 5
Liver sections stained with anti-8-oxo-dG antibody. (A) Immunostaining of mouse livers with anti-8-oxo-dG antibody. (B) Semiquantative score of 8-oxo-dG immunostaining. Scores were significantly higher in the HFHC diet groups than the control diet groups (Mutyh+/+, HFHC diet group vs. Mutyh+/+, control diet group; P = 0.0048, Mutyh+/−, HFHC diet group vs. Mutyh+/−, control diet group; P = 0.0012, Mutyh−/−, HFHC diet group vs. Mutyh−/−, control diet group; P = 0.0090) and significantly higher in the HFHC + high-iron diet groups than the HFHC diet groups (Mutyh+/+, HFHC + high-iron diet group vs. Mutyh+/+, HFHC diet group; P < 0.0001, Mutyh+/−, HFHC + high-iron diet group vs. Mutyh+/−, HFHC diet group; P = 0.0020, Mutyh−/−, HFHC + high-iron diet group vs. Mutyh−/−, HFHC diet group; P = 0.0055). There was no significant difference in the index according to the presence or absence of tumor development (P = 1.000). Data analysed with a Kruskal–Wallis test followed by Dunn–Bonferroni test. For all data analysis P < 0.05 considered significant. Data are shown as box plots for each group of mice. Median values are shown by the line within the box. The bottom and top edges of the boxes represent the 25th and 75th percentiles, respectively. HFHC, high-fat high-carbohydrate; 8-oxo-dG, 8-Hydroxy-2d-deoxyguanosine.
Figure 6
Figure 6
Expression of Myc mRNA in non-tumorous hepatic tissue of each groups evaluated by qRT-PCR. Increased Myc expression in non-tumorous hepatic tissue of MUTYH-null mice with an HFHC + high-iron diet with liver tumor. Data are the mean of five samples. Error bars represent the SD. * Indicates a significant change (P = 0.0318).

References

    1. Younossi ZM, et al. Global epidemiology of nonalcoholic fatty liver disease—Meta-analytic assessment of prevalence, incidence, and outcomes. Hepatology. 2016;64:73–84. doi: 10.1002/hep.28431. - DOI - PubMed
    1. Yki-Järvinen H. Non-alcoholic fatty liver disease as a cause and a consequence of metabolic syndrome. Lancet Diabetes Endocrinol. 2014;2:901–910. doi: 10.1016/S2213-8587(14)70032-4. - DOI - PubMed
    1. McPherson S, et al. Evidence of NAFLD progression from steatosis to fibrosing-steatohepatitis using paired biopsies: Implications for prognosis and clinical management. J. Hepatol. 2015;62:1148–1155. doi: 10.1016/j.jhep.2014.11.034. - DOI - PubMed
    1. Ascha MS, et al. The incidence and risk factors of hepatocellular carcinoma in patients with nonalcoholic steatohepatitis. Hepatology. 2010;51:1972–1978. doi: 10.1002/hep.23527. - DOI - PubMed
    1. Toyokuni S. Oxidative stress as an iceberg in carcinogenesis and cancer biology. Arch. Biochem. Biophys. 2016;595:46–49. doi: 10.1016/j.abb.2015.11.025. - DOI - PubMed

Publication types

MeSH terms