. 2021 Feb 11;11(1):3560.
doi: 10.1038/s41598-021-82687-2.

Experimental demonstration of novel beam characterization using a polarizable X-band transverse deflection structure

Affiliations

Experimental demonstration of novel beam characterization using a polarizable X-band transverse deflection structure

B Marchetti et al. Sci Rep. .

Abstract

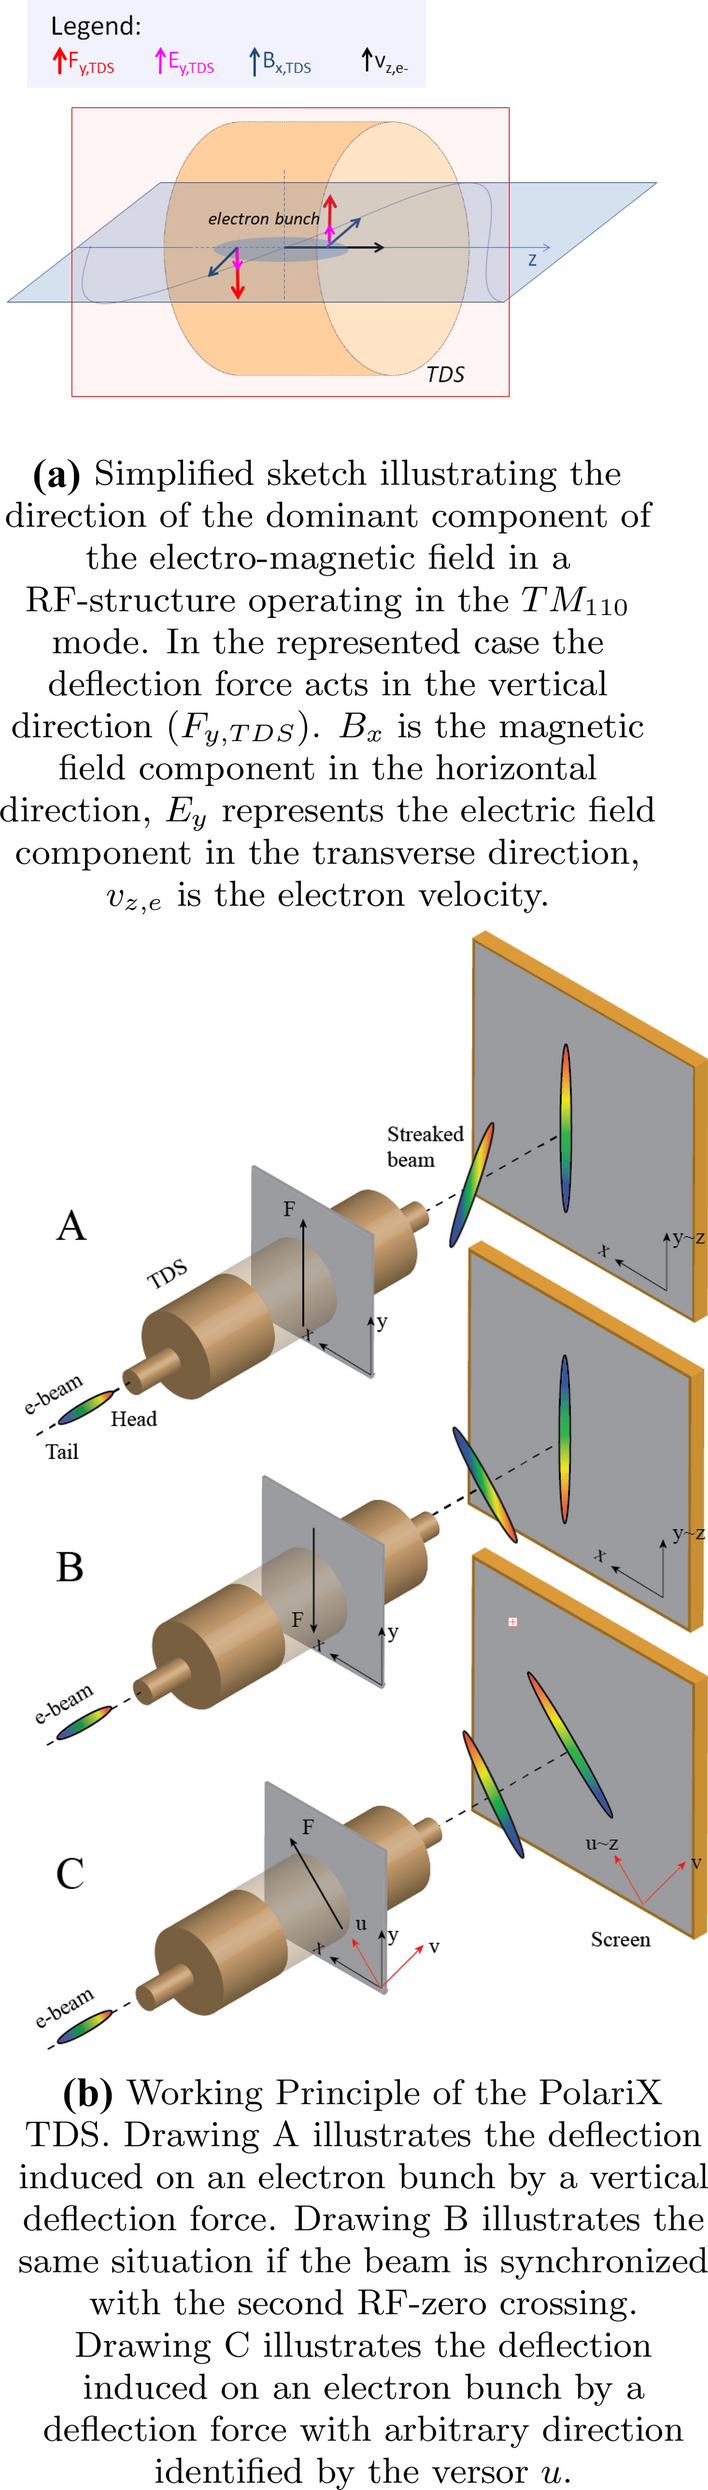
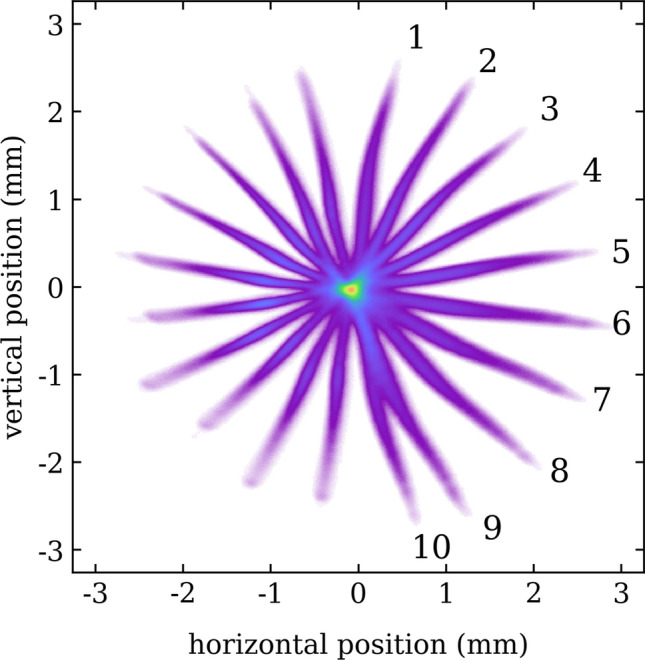
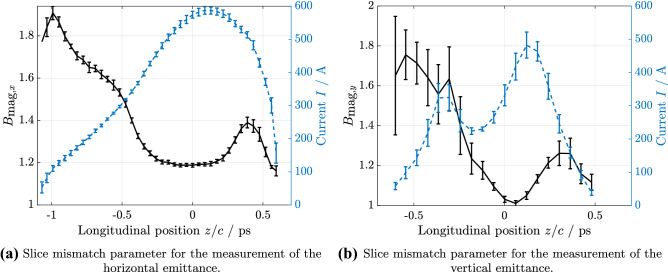
The PolariX TDS (Polarizable X-Band Transverse Deflection Structure) is an innovative TDS-design operating in the X-band frequency-range. The design gives full control of the streaking plane, which can be tuned in order to characterize the projections of the beam distribution onto arbitrary transverse axes. This novel feature opens up new opportunities for detailed characterization of the electron beam. In this paper we present first measurements of the Polarix TDS at the FLASHForward beamline at DESY, including three-dimensional reconstruction of the charge-density distribution of the bunch and slice emittance measurements in both transverse directions. The experimental results open the path toward novel and more extensive beam characterization in the direction of multi-dimensional-beam-phase-space reconstruction.


Conflict of interest statement

The authors declare no competing interests.

Figures

Figure 1
Figure 1
The PolariX TDS.
Figure 2
Figure 2
FLASH beamline layout with the three coexisting beamlines: FLASH1, FLASH2 and FLASHForward. A schematic layout of the PolariX-TDS diagnostics beamline is shown inside the dashed box with gray background. The quadrupoles upstream of the TDS are used to scan the phase advance in the slice emittance measurement. Screen stations marked with A and B correspond to 11FLFXTDS (slice emittance screen) and 8FLFDUMP (longitudinal phase space screen) respectively.
Figure 3
Figure 3
Streaked beam at multiple angles. The figure shows a composition where 10 pictures of streaked beam visualized at 11FLFXTDS have been combined. Each image has been taken for a different set-point of the RF phase shifter, as shown in Supplementary Movie 1. The profiles have been artificially centered and overlapped taking as reference the center of charge of the distributions for a better visualization of the variable angle of streaking.
Figure 4
Figure 4
Normalized slice emittance. The errorbars indicate one standard deviation.
Figure 5
Figure 5
Three-dimensional charge density reconstruction. Reconstruction results from two different sets of experimental data. The 3D render was done with PyVista, which is a python implementation of VTK. The normalization to the beam total charge value has been done after having set to 0 the voxels with negative values, constituting the halo of the figure and arising from noise of the reconstruction algorithm.
Figure 6
Figure 6
Centroids (dark blue points) and orientation of the x–y correlation (light blue arrows) in the longitudinal slices of the electron bunch calculated from the beam reconstructed in Fig. 5b. The slices have length of 31 fs and increasing running number scrolling from the head to the tail the beam distribution.
Figure 7
Figure 7
Sample sliced beam images on screen. The beam is streaked in the given direction by the PolariX TDS. For the analysis, the beam is divided into slices (green lines) around the centroid (green cross). The centroid positions within each slice are calculated using the rms method (black stars) and the center of a Gaussian fit (red diamonds).
Figure 8
Figure 8
Slice mismatch parameters for the emittance measurements.
Figure 9
Figure 9
Algorithm for the tomographic reconstruction. The scheme illustrates schematically the conceptual steps performed in the data analysis of the images of the streaked beam to obtain a 3D reconstruction of the charge density distribution of the bunch.

References

    1. Pellegrini C, Marinelli A, Reiche S. The physics of x-ray free-electron lasers. Rev. Mod. Phys. 2016;88:015006. doi: 10.1103/RevModPhys.88.015006. - DOI
    1. Katsouleas TC, Wilks S, Chen P, Dawson J, Su J. Beam loading in plasma accelerators. Part. Accel. 1987;22:81.
    1. Whittum DH, Sharp WM, Yu SS, Lampe M, Joyce G. Electron-hose instability in the ion-focused regime. Phys. Rev. Lett. 1991;67:991. doi: 10.1103/PhysRevLett.67.991. - DOI - PubMed
    1. Wiedemann H. Particle Accelerator Physics. New York: Springer; 2007.
    1. Cathey B, Cousineau S, Aleksandrov A, Zhukov A. First six dimensional phase space measurement of an accelerator beam. Phys. Rev. Lett. 2018;121:064804. doi: 10.1103/PhysRevLett.121.064804. - DOI - PubMed

LinkOut - more resources