

Mangrove tree (Avicennia marina): insight into chloroplast genome evolutionary divergence and its comparison with related species from family Acanthaceae
- PMID: 33574434
- PMCID: PMC7878759
- DOI: 10.1038/s41598-021-83060-z
Mangrove tree (Avicennia marina): insight into chloroplast genome evolutionary divergence and its comparison with related species from family Acanthaceae
Abstract
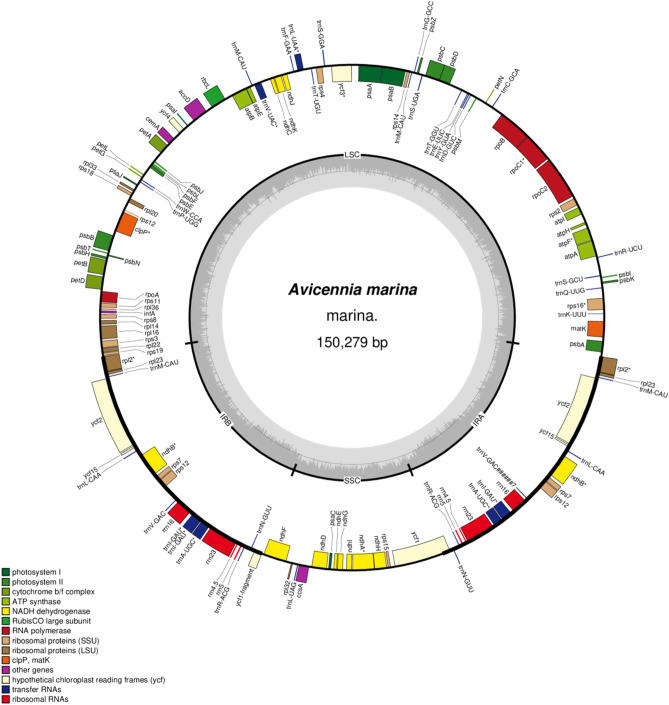
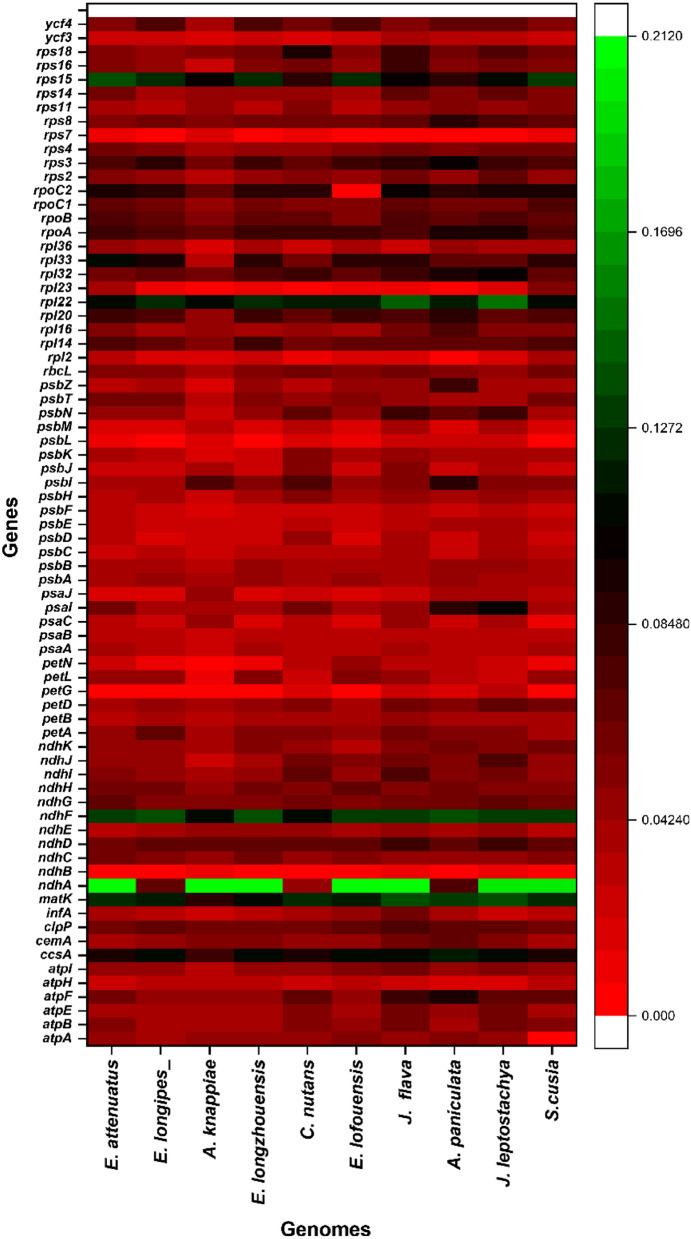
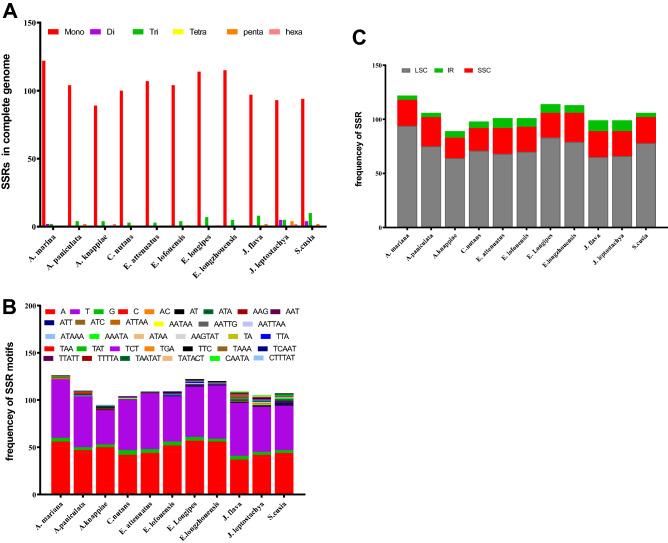
Avicennia marina (family Acanthaceae) is a halotolerant woody shrub that grows wildly and cultivated in the coastal regions. Despite its importance, the species suffers from lack of genomic datasets to improve its taxonomy and phylogenetic placement across the related species. Here, we have aimed to sequence the plastid genome of A. marina and its comparison with related species in family Acanthaceae. Detailed next-generation sequencing and analysis showed a complete chloroplast genome of 150,279 bp, comprising 38.6% GC. Genome architecture is quadripartite revealing large single copy (82,522 bp), small single copy (17,523 bp), and pair of inverted repeats (25,117 bp). Furthermore, the genome contains 132 different genes, including 87 protein-coding genes, 8 rRNA, 37 tRNA genes, and 126 simple sequence repeats (122 mononucleotide, 2 dinucleotides, and 2 trinucleotides). Interestingly, about 25 forward, 15 reversed and 14 palindromic repeats were also found in the A. marina. High degree synteny was observed in the pairwise alignment with related genomes. The chloroplast genome comparative assessment showed a high degree of sequence similarity in coding regions and varying divergence in the intergenic spacers among ten Acanthaceae species. The pairwise distance showed that A. marina exhibited the highest divergence (0.084) with Justicia flava and showed lowest divergence with Aphelandra knappiae (0.059). Current genomic datasets are a valuable resource for investigating the population and evolutionary genetics of family Acanthaceae members' specifically A. marina and related species.
Conflict of interest statement
The authors declare no competing interests.
Figures


References
-
- Faridah-Hanum I, et al. Development of a comprehensive mangrove quality index (MQI) in Matang Mangrove: assessing mangrove ecosystem health. Ecol. Ind. 2019;102:103–117. doi: 10.1016/j.ecolind.2019.02.030. - DOI
-
- Spalding M. World Atlas of Mangroves. New York: Routledge; 2010.
-
- Himes-Cornell A, Grose SO, Pendleton L. Mangrove ecosystem service values and methodological approaches to valuation: where do we stand? Front. Mar. Sci. 2018;5:376. doi: 10.3389/fmars.2018.00376. - DOI
-
- Wu Y, Ricklefs RE, Huang Z, Zan Q, Yu S. Winter temperature structures mangrove species distributions and assemblage composition in China. Glob. Ecol. Biogeogr. 2018;27:1492–1506. doi: 10.1111/geb.12826. - DOI
-
- Das SS, Das S, Ghosh P. Phylogenetic relationships among the mangrove species of Acanthaceae found in Indian Sundarban, as revealed by RAPD analysis. Adv. Appl. Sci. Res. 2015;6:179–184.
MeSH terms
LinkOut - more resources
Full Text Sources
Other Literature Sources
Miscellaneous
