

Ultraviolet absorption of contaminants in water
- PMID: 33574493
- PMCID: PMC7878760
- DOI: 10.1038/s41598-021-83322-w
Ultraviolet absorption of contaminants in water
Abstract
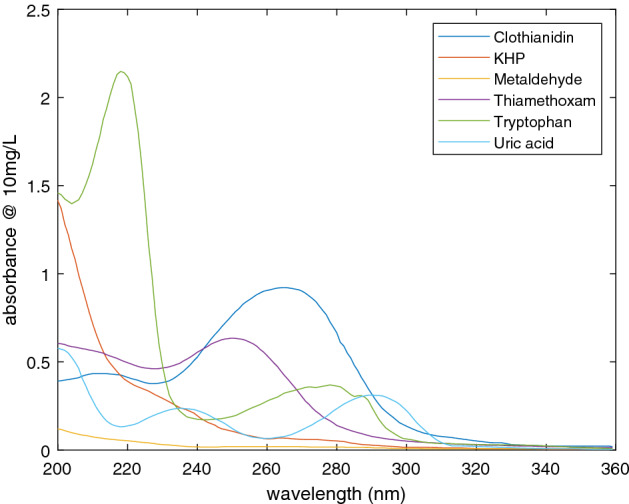
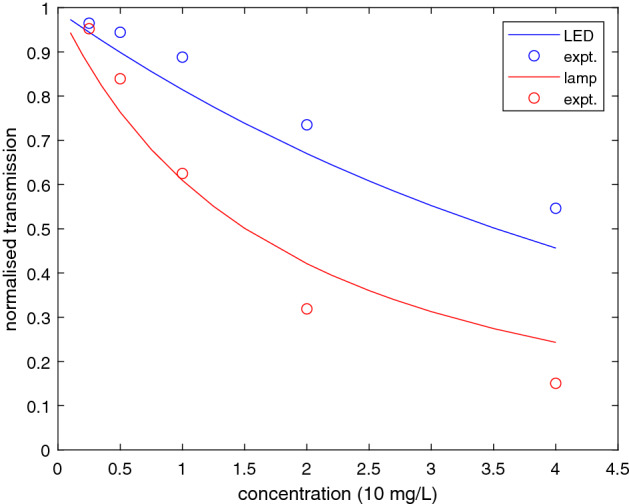
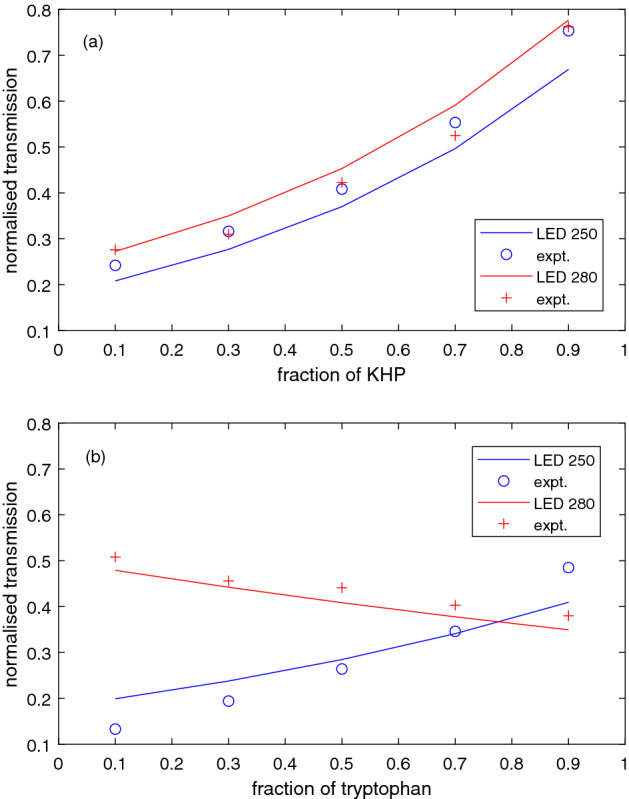
Contaminants in water were studied using ultraviolet absorption with light emitting diode and deuterium lamp sources, and a thresholding detector. The absorption spectra of potassium hydrogen pthalate, clothianidin, tryptophan, thiamethoxam, uric acid and metaldehyde were obtained in the range 200-360 nm. Only metaldehyde was not suitable for detection in this range. For the other contaminants, and mixtures of pairs of compounds, the transmitted signal could be approximately described with a simple spectral model of the source-absorption-detector system. Combined measurements at two wavelengths could allow relative concentrations in certain mixtures to be determined, and real-time absorption measurements were demonstrated in a flume.
Conflict of interest statement
The authors declare no competing interests.
Figures


Similar articles
-
Dual-wavelength light-emitting diode-based ultraviolet absorption detector for nano-flow capillary liquid chromatography.J Chromatogr A. 2017 Nov 10;1523:242-247. doi: 10.1016/j.chroma.2017.07.097. Epub 2017 Aug 1. J Chromatogr A. 2017. PMID: 28818326
-
White LEDs as broad spectrum light sources for spectrophotometry: demonstration in the visible spectrum range in a diode-array spectrophotometric detector.Electrophoresis. 2010 Nov;31(22):3737-44. doi: 10.1002/elps.201000341. Electrophoresis. 2010. PMID: 21077241
-
Photodegradation of clothianidin and thiamethoxam in agricultural soils.Environ Sci Pollut Res Int. 2018 Nov;25(31):31318-31325. doi: 10.1007/s11356-018-3121-9. Epub 2018 Sep 7. Environ Sci Pollut Res Int. 2018. PMID: 30194578
-
Molecular absorption measurements with an optical fibre coupled array of ultra-violet light-emitting diodes.Anal Chim Acta. 2017 Sep 15;986:95-100. doi: 10.1016/j.aca.2017.07.007. Epub 2017 Jul 12. Anal Chim Acta. 2017. PMID: 28870329
-
Sources, pathways, and relative risks of contaminants in surface water and groundwater: a perspective prepared for the Walkerton inquiry.J Toxicol Environ Health A. 2002 Jan 11;65(1):1-142. doi: 10.1080/152873902753338572. J Toxicol Environ Health A. 2002. PMID: 11809004 Review.
Cited by
-
Application of Excimer Lamp in Quantitative Detection of SF6 Decomposition Component SO2.Sensors (Basel). 2021 Dec 7;21(24):8165. doi: 10.3390/s21248165. Sensors (Basel). 2021. PMID: 34960259 Free PMC article.
-
Hydrogel gratings with patterned analyte responsive dyes for spectroscopic sensing.RSC Adv. 2021 Dec 17;11(63):40197-40204. doi: 10.1039/d1ra08610c. eCollection 2021 Dec 13. RSC Adv. 2021. PMID: 35494120 Free PMC article.
-
Colorimetric Chemosensor for Cu2+ and Fe3+ Based on a meso-Triphenylamine-BODIPY Derivative.Sensors (Basel). 2023 Aug 7;23(15):6995. doi: 10.3390/s23156995. Sensors (Basel). 2023. PMID: 37571777 Free PMC article.
-
Rapid and selective quantitative colourimetric analysis of nitrite in water using a S-Nitrosothiol based method.Water Res X. 2024 Oct 11;25:100265. doi: 10.1016/j.wroa.2024.100265. eCollection 2024 Dec 1. Water Res X. 2024. PMID: 39497788 Free PMC article.
-
Tunable hydrogel networks by varying secondary structures of hydrophilic peptoids provide viable 3D cell culture platforms for hMSCs.Biomater Sci. 2025 Jun 10;13(12):3380-3394. doi: 10.1039/d5bm00433k. Biomater Sci. 2025. PMID: 40354141 Free PMC article.
References
-
- Schwarzenbach RP, Egli T, Hofstetter TB, von Gunten U, Wehrli B. Global water pollution and human health. In: Gadgil A, Liverman DM, editors. Annual Review of Environment and Resources. 2010. pp. 109–136.
-
- Pietrzak D, Kania J, Malina G, Kmiecik E, Wator K. Pesticides from the EU first and second watch lists in the water environment. Clean Soil Air Water. 2019 doi: 10.1002/clen.201800376. - DOI
-
- de Souza RM, et al. Occurrence, impacts and general aspects of pesticides in surface water: A review. Process Saf. Environ. Prot. 2020;135:22–37. doi: 10.1016/j.psep.2019.12.035. - DOI
Publication types
LinkOut - more resources
Full Text Sources
Other Literature Sources
