

Secondary analyses of global datasets: do obesity and physical activity explain variation in diabetes risk across populations?
- PMID: 33574565
- PMCID: PMC8081659
- DOI: 10.1038/s41366-021-00764-y
Secondary analyses of global datasets: do obesity and physical activity explain variation in diabetes risk across populations?
Abstract
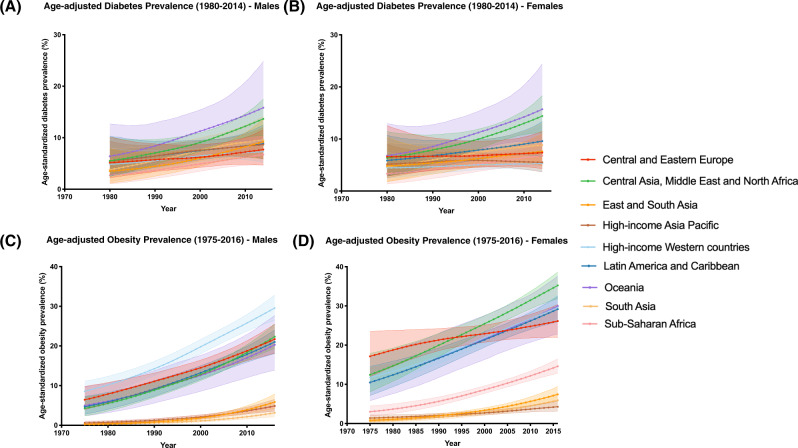
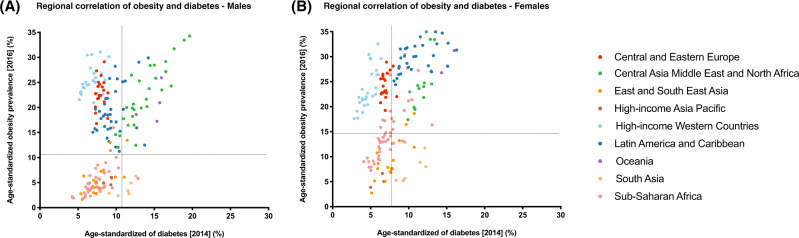
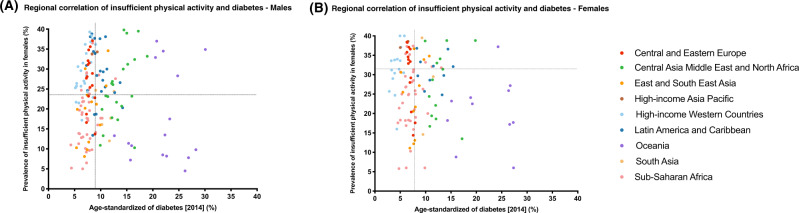
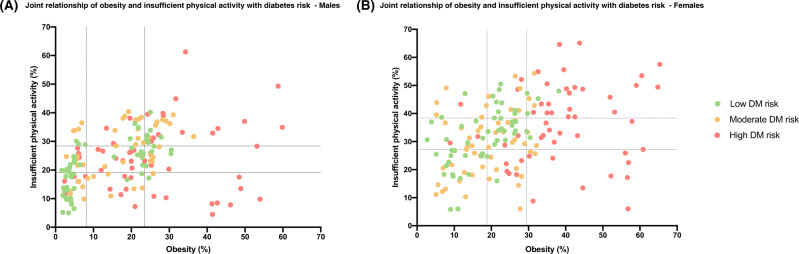
Type 2 diabetes rates vary significantly across geographic regions. These differences are sometimes assumed to be entirely driven by differential distribution of environmental triggers, including obesity and insufficient physical activity (IPA). In this review, we discuss data which conflicts with this supposition. We carried out a secondary analysis of publicly available data to unravel the relative contribution of obesity and IPA towards diabetes risk across different populations. We used sex-specific, age-standardized estimates from Non-Communicable Disease Risk Factor Collaboration (NCD-RisC) on diabetes (1980-2014) and obesity (1975-2016) rates, in 200 countries, and from WHO on IPA rates in 168 countries in the year 2016. NCD-RisC and WHO organized countries into nine super-regions. All analyses were region- and sex-specific. Although obesity has been increasing since 1975 in every part of the world, this was not reflected in a proportional increase in diabetes rates in several regions, including Central and Eastern Europe, and High-income western countries region. Similarly, the association of physical inactivity with diabetes is not homogeneous across regions. Countries from different regions across the world could have very similar rates of diabetes, despite falling on opposite ends of IPA rate spectrum. The combined effect of obesity and IPA on diabetes risk was analyzed at the worldwide and country level. The overall findings highlighted the larger impact of obesity on disease risk; low IPA rates do not seem to be protective of diabetes, when obesity rates are high. Despite that, some countries deviate from this overall observation. Sex differences were observed across all our analyses. Overall, data presented in this review indicate that different populations, while experiencing similar environmental shifts, are apparently differentially subject to diabetes risk. Sex-related differences observed suggest that males and females are either subject to different risk factor exposures or have different responses to them.
Conflict of interest statement
The authors declare that they have no conflict of interest.
Figures
References
-
- King H, Rewers M. Global estimates for prevalence of diabetes mellitus and impaired glucose tolerance in adults. WHO Ad Hoc Diabetes Reporting Group. Diabetes Care. 1993;16:157–77. - PubMed
-
- Joslin EP. The prevention of diabetes mellitus. J of the Am Med Assoc. 1921;76:79–84.
-
- Colditz GA, Willett WC, Stampfer MJ, Manson JE, Hennekens CH, Arky RA, et al. Weight as a risk factor for clinical diabetes in females. Am J Epidemiol. 1990;132:501–13. - PubMed
-
- Cassano PA, Rosner B, Vokonas PS, Weiss ST. Obesity and body fat distribution in relation to the incidence of non-insulin-dependent diabetes mellitus. A prospective cohort study ofmales in the normative aging study. Am J Epidemiol. 1992;136:1474–86. - PubMed
-
- Chan JM, Rimm EB, Colditz GA, Stampfer MJ, Willett WC. Obesity, fat distribution, and weight gain as risk factors for clinical diabetes in males. Diabetes Care. 1994;17:961–9. - PubMed
Publication types
MeSH terms
Grants and funding
- BB_/Biotechnology and Biological Sciences Research Council/United Kingdom
- MR/S03658X/1/MRC_/Medical Research Council/United Kingdom
- MR/S019669/1/MRC_/Medical Research Council/United Kingdom
- MR/M013138/1/MRC_/Medical Research Council/United Kingdom
- MR/M013138/2/MRC_/Medical Research Council/United Kingdom
LinkOut - more resources
Full Text Sources
Other Literature Sources
Medical
