. 2021 Feb;27(2):333-343.
doi: 10.1038/s41591-020-01223-3. Epub 2021 Feb 11.

The gut microbiome modulates the protective association between a Mediterranean diet and cardiometabolic disease risk

Affiliations

The gut microbiome modulates the protective association between a Mediterranean diet and cardiometabolic disease risk

Dong D Wang et al. Nat Med. 2021 Feb.

Abstract

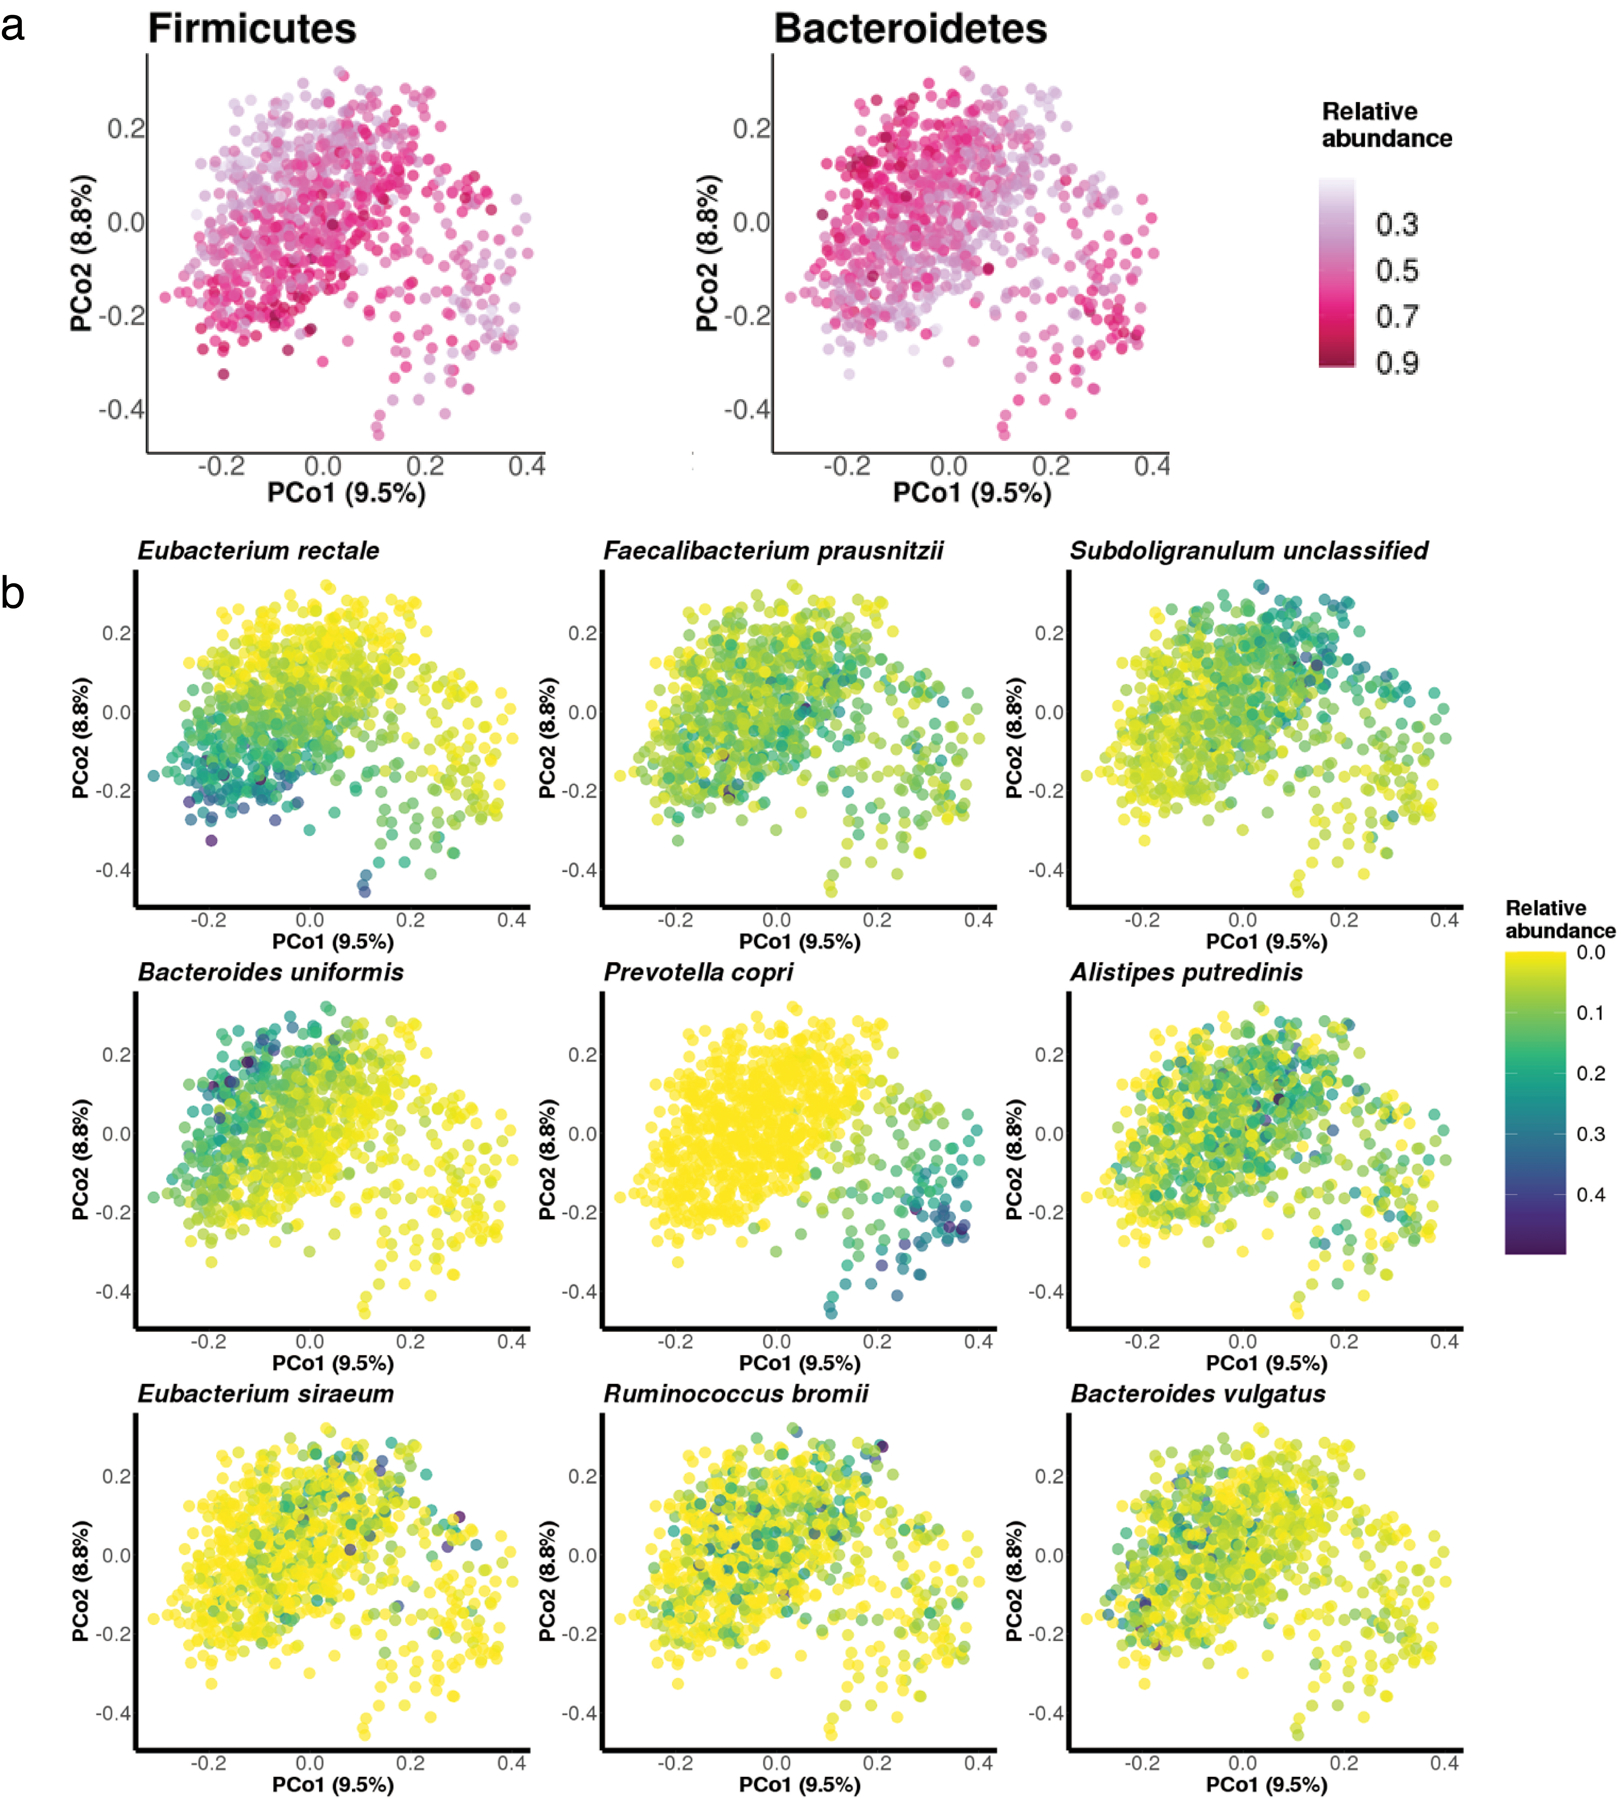
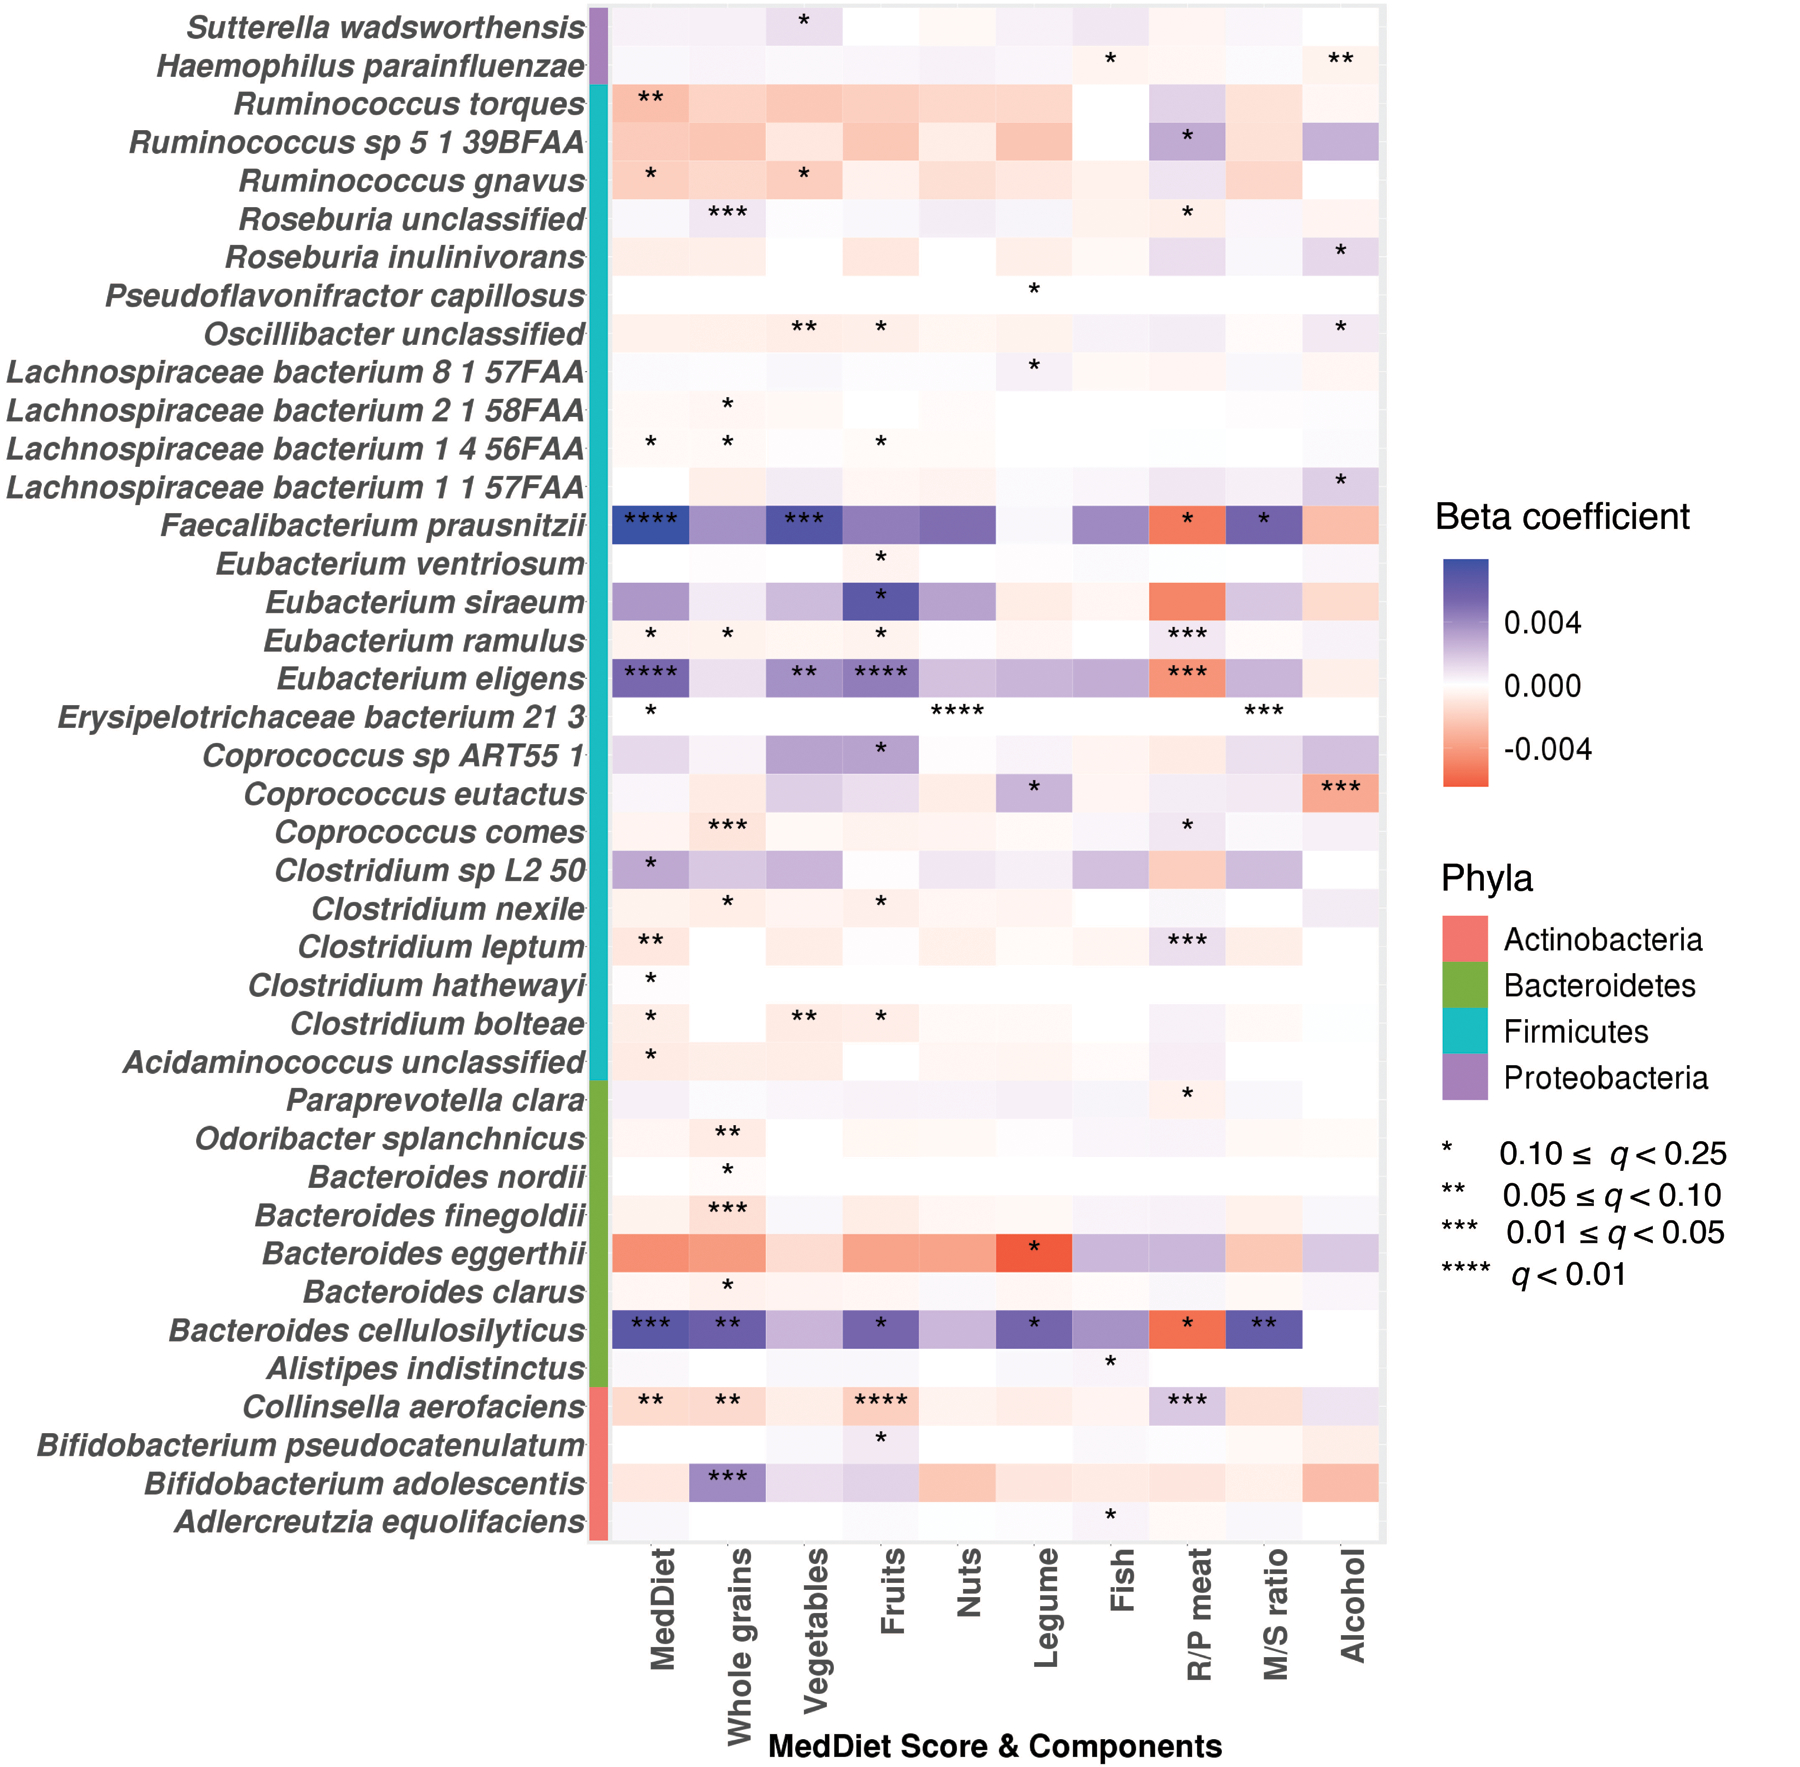
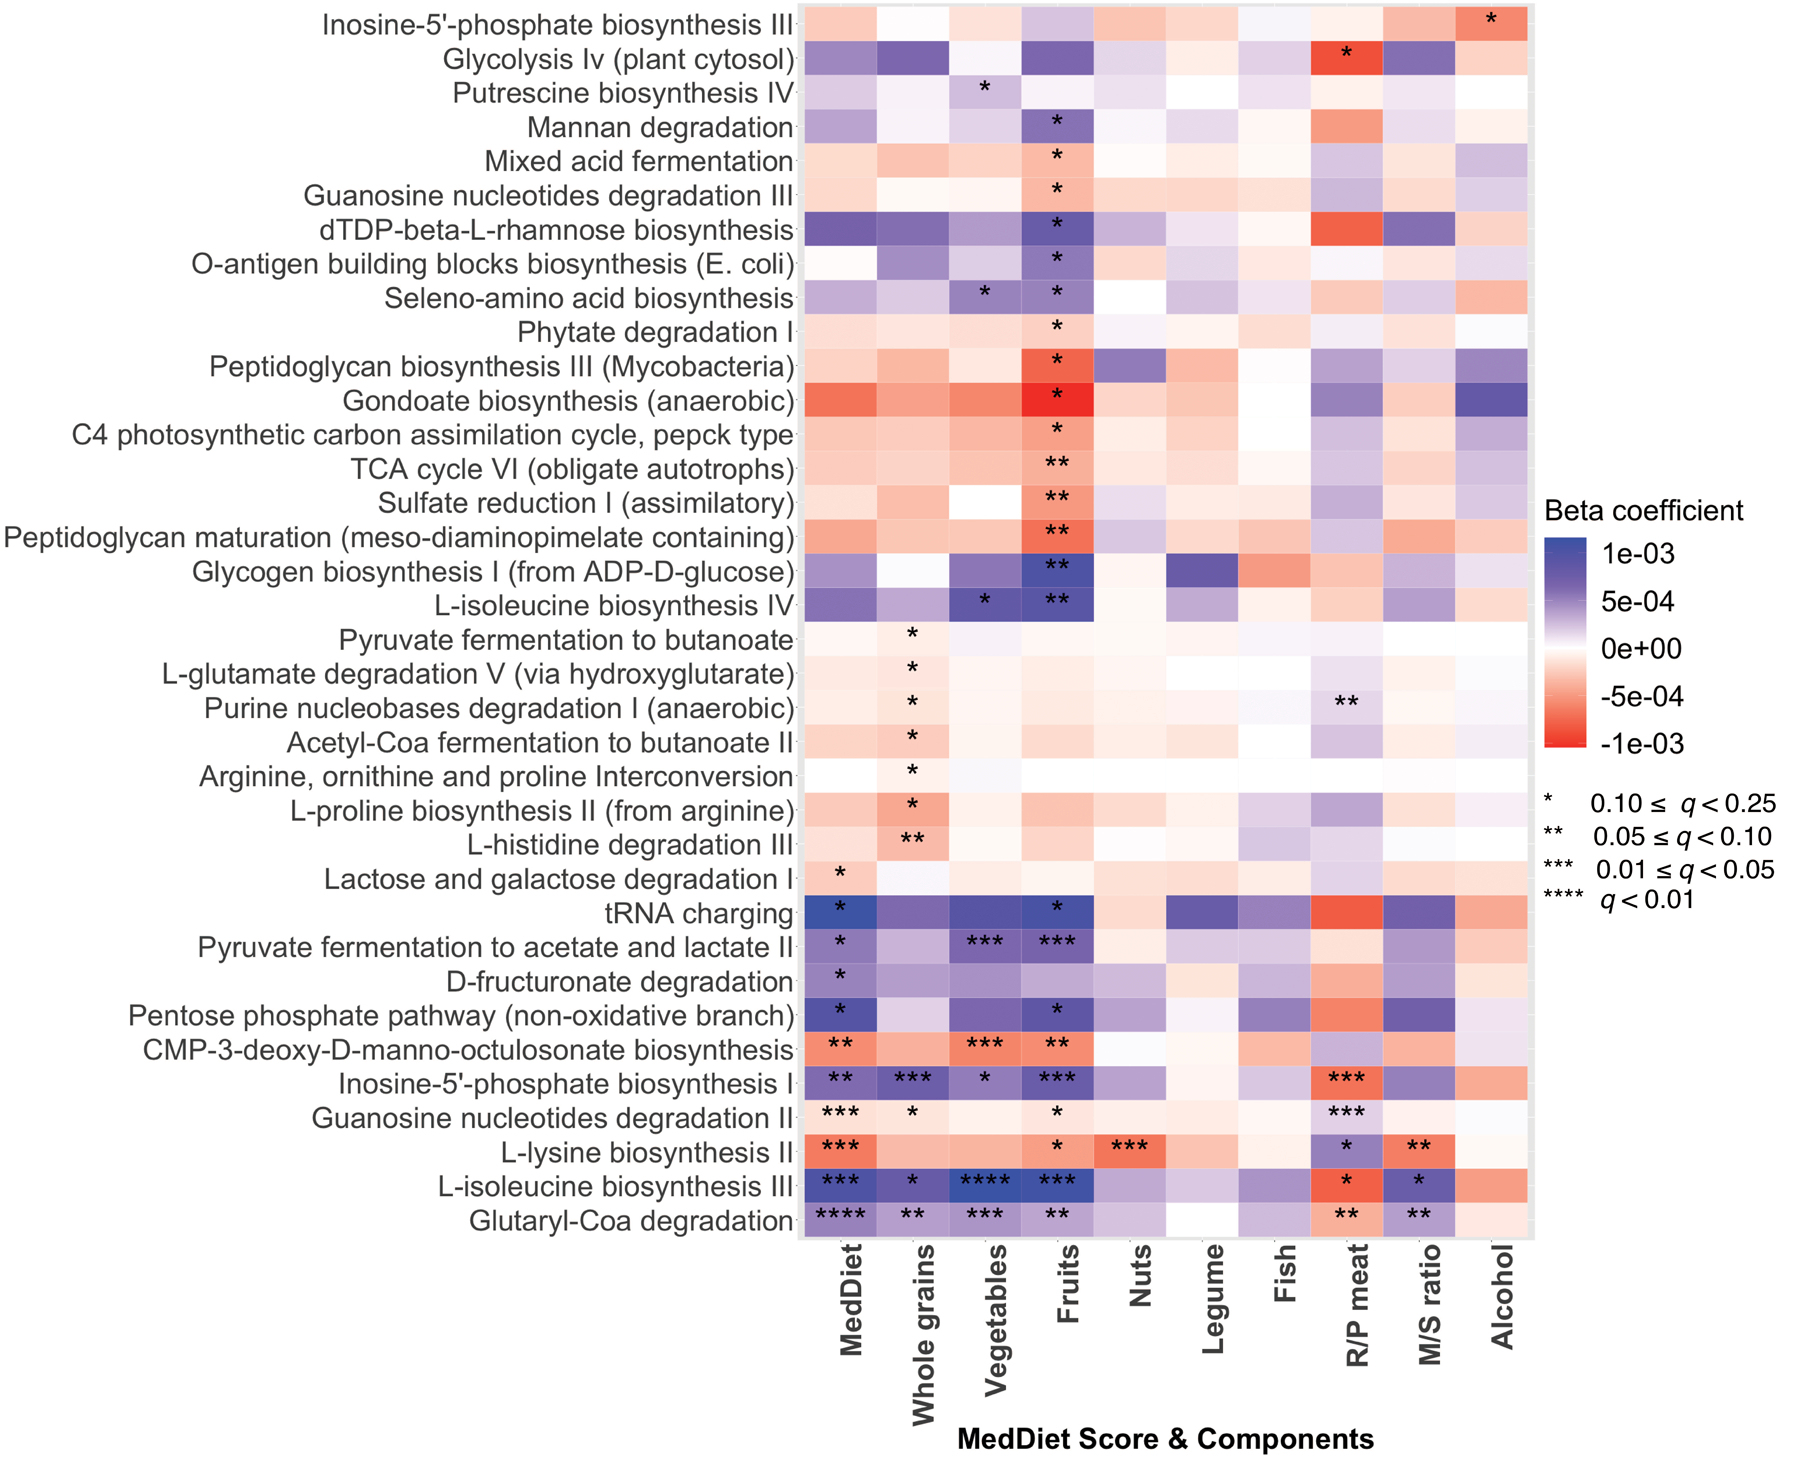
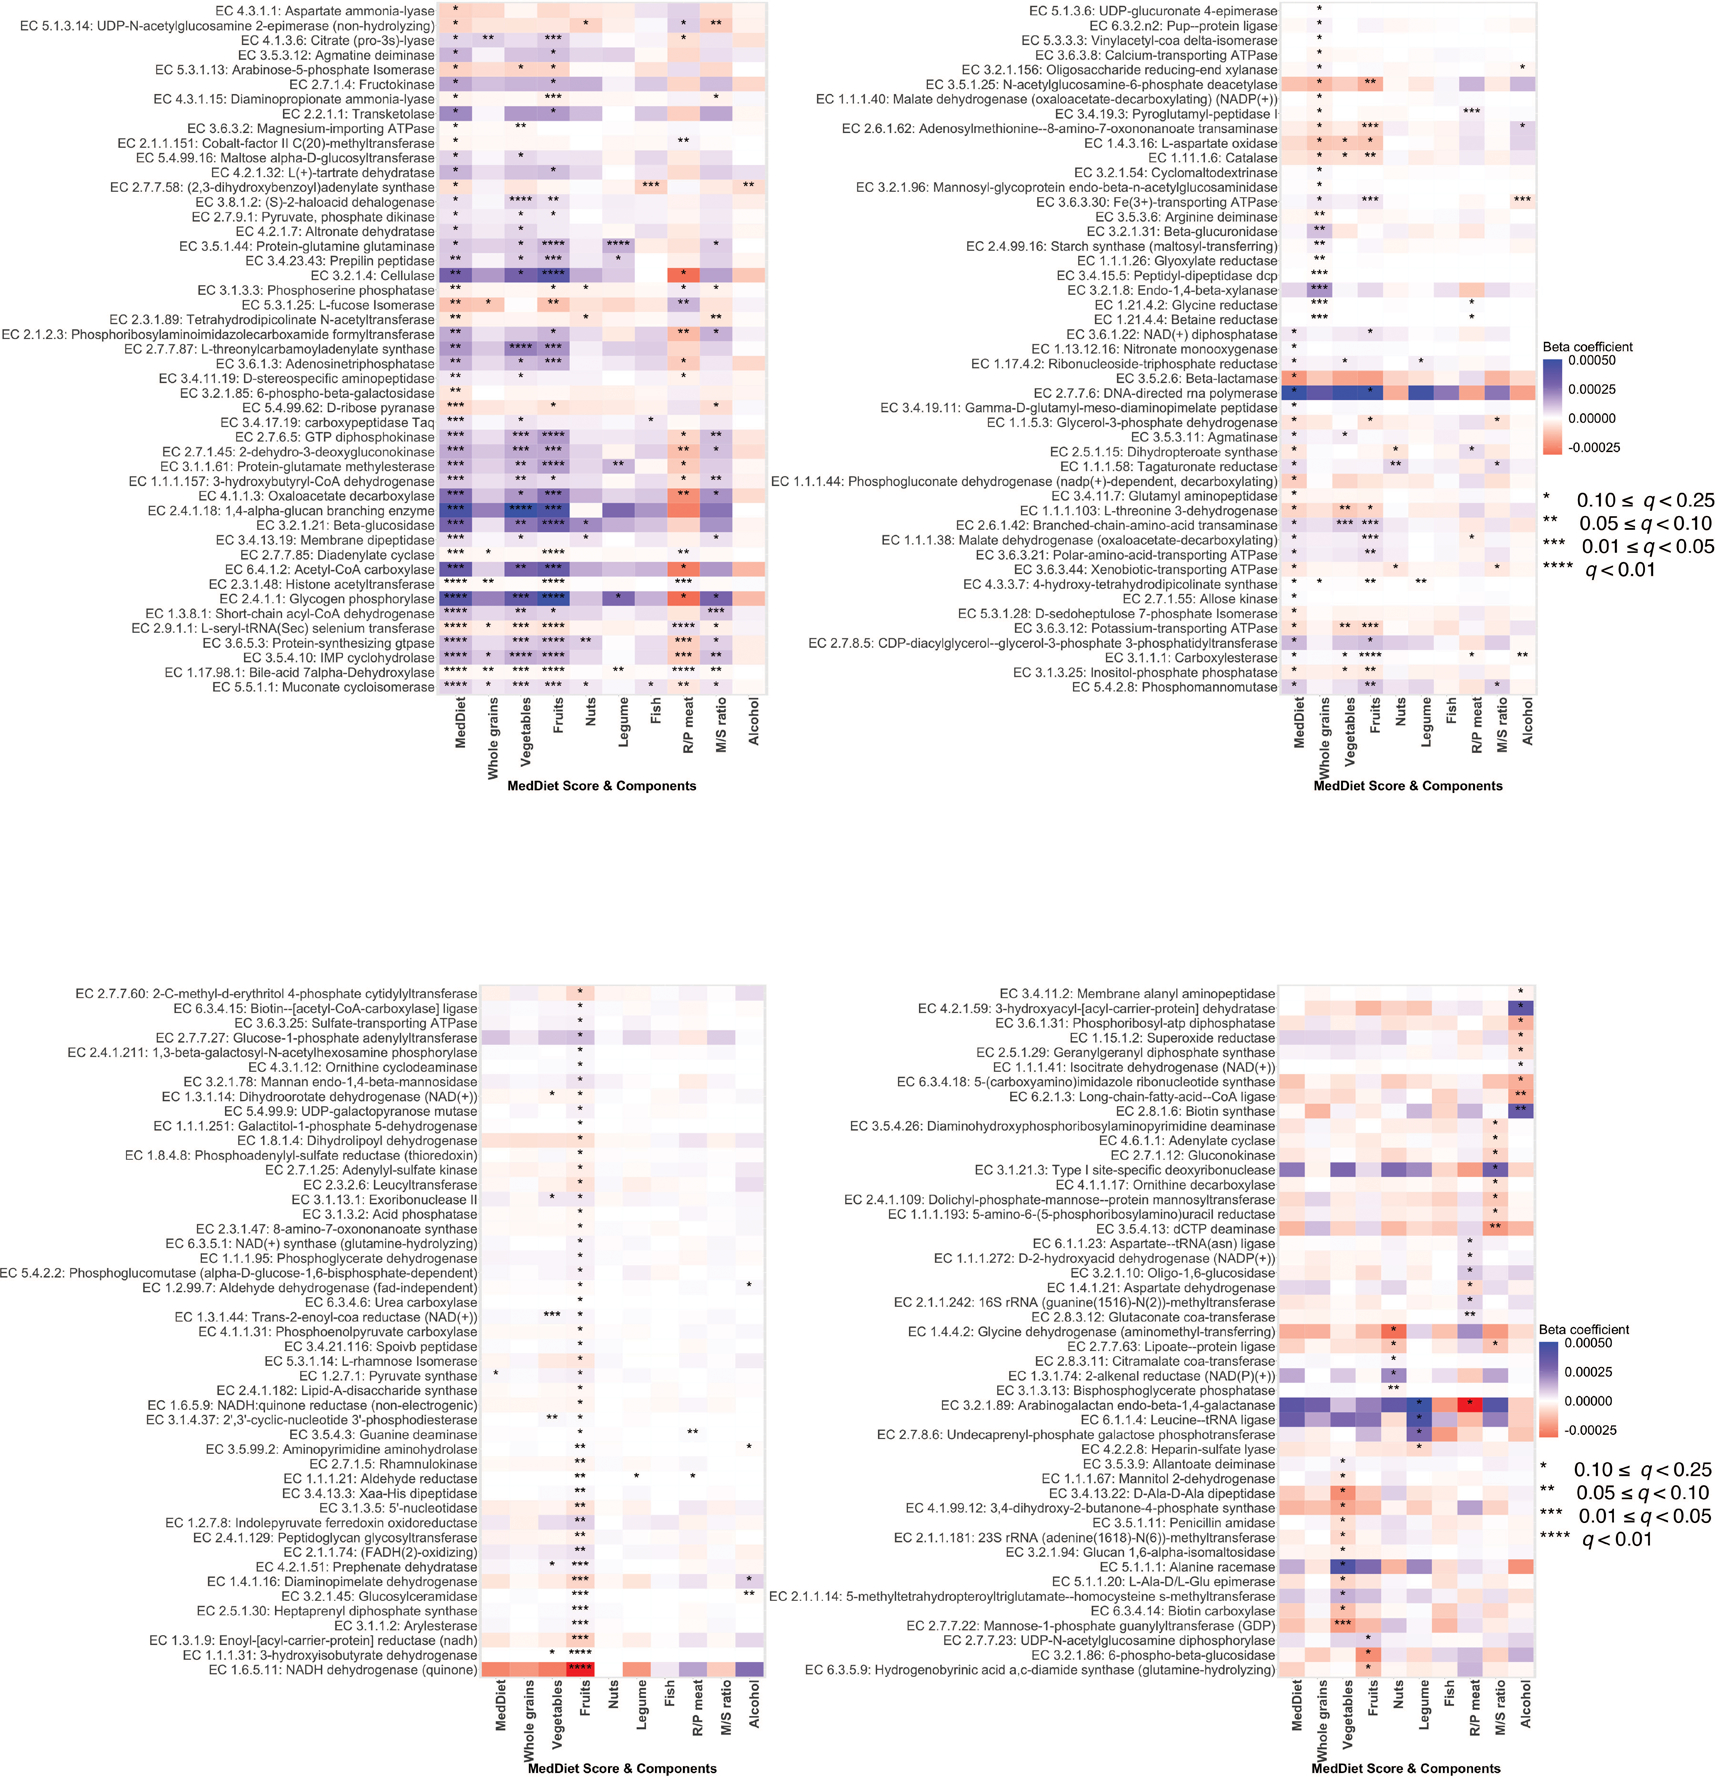
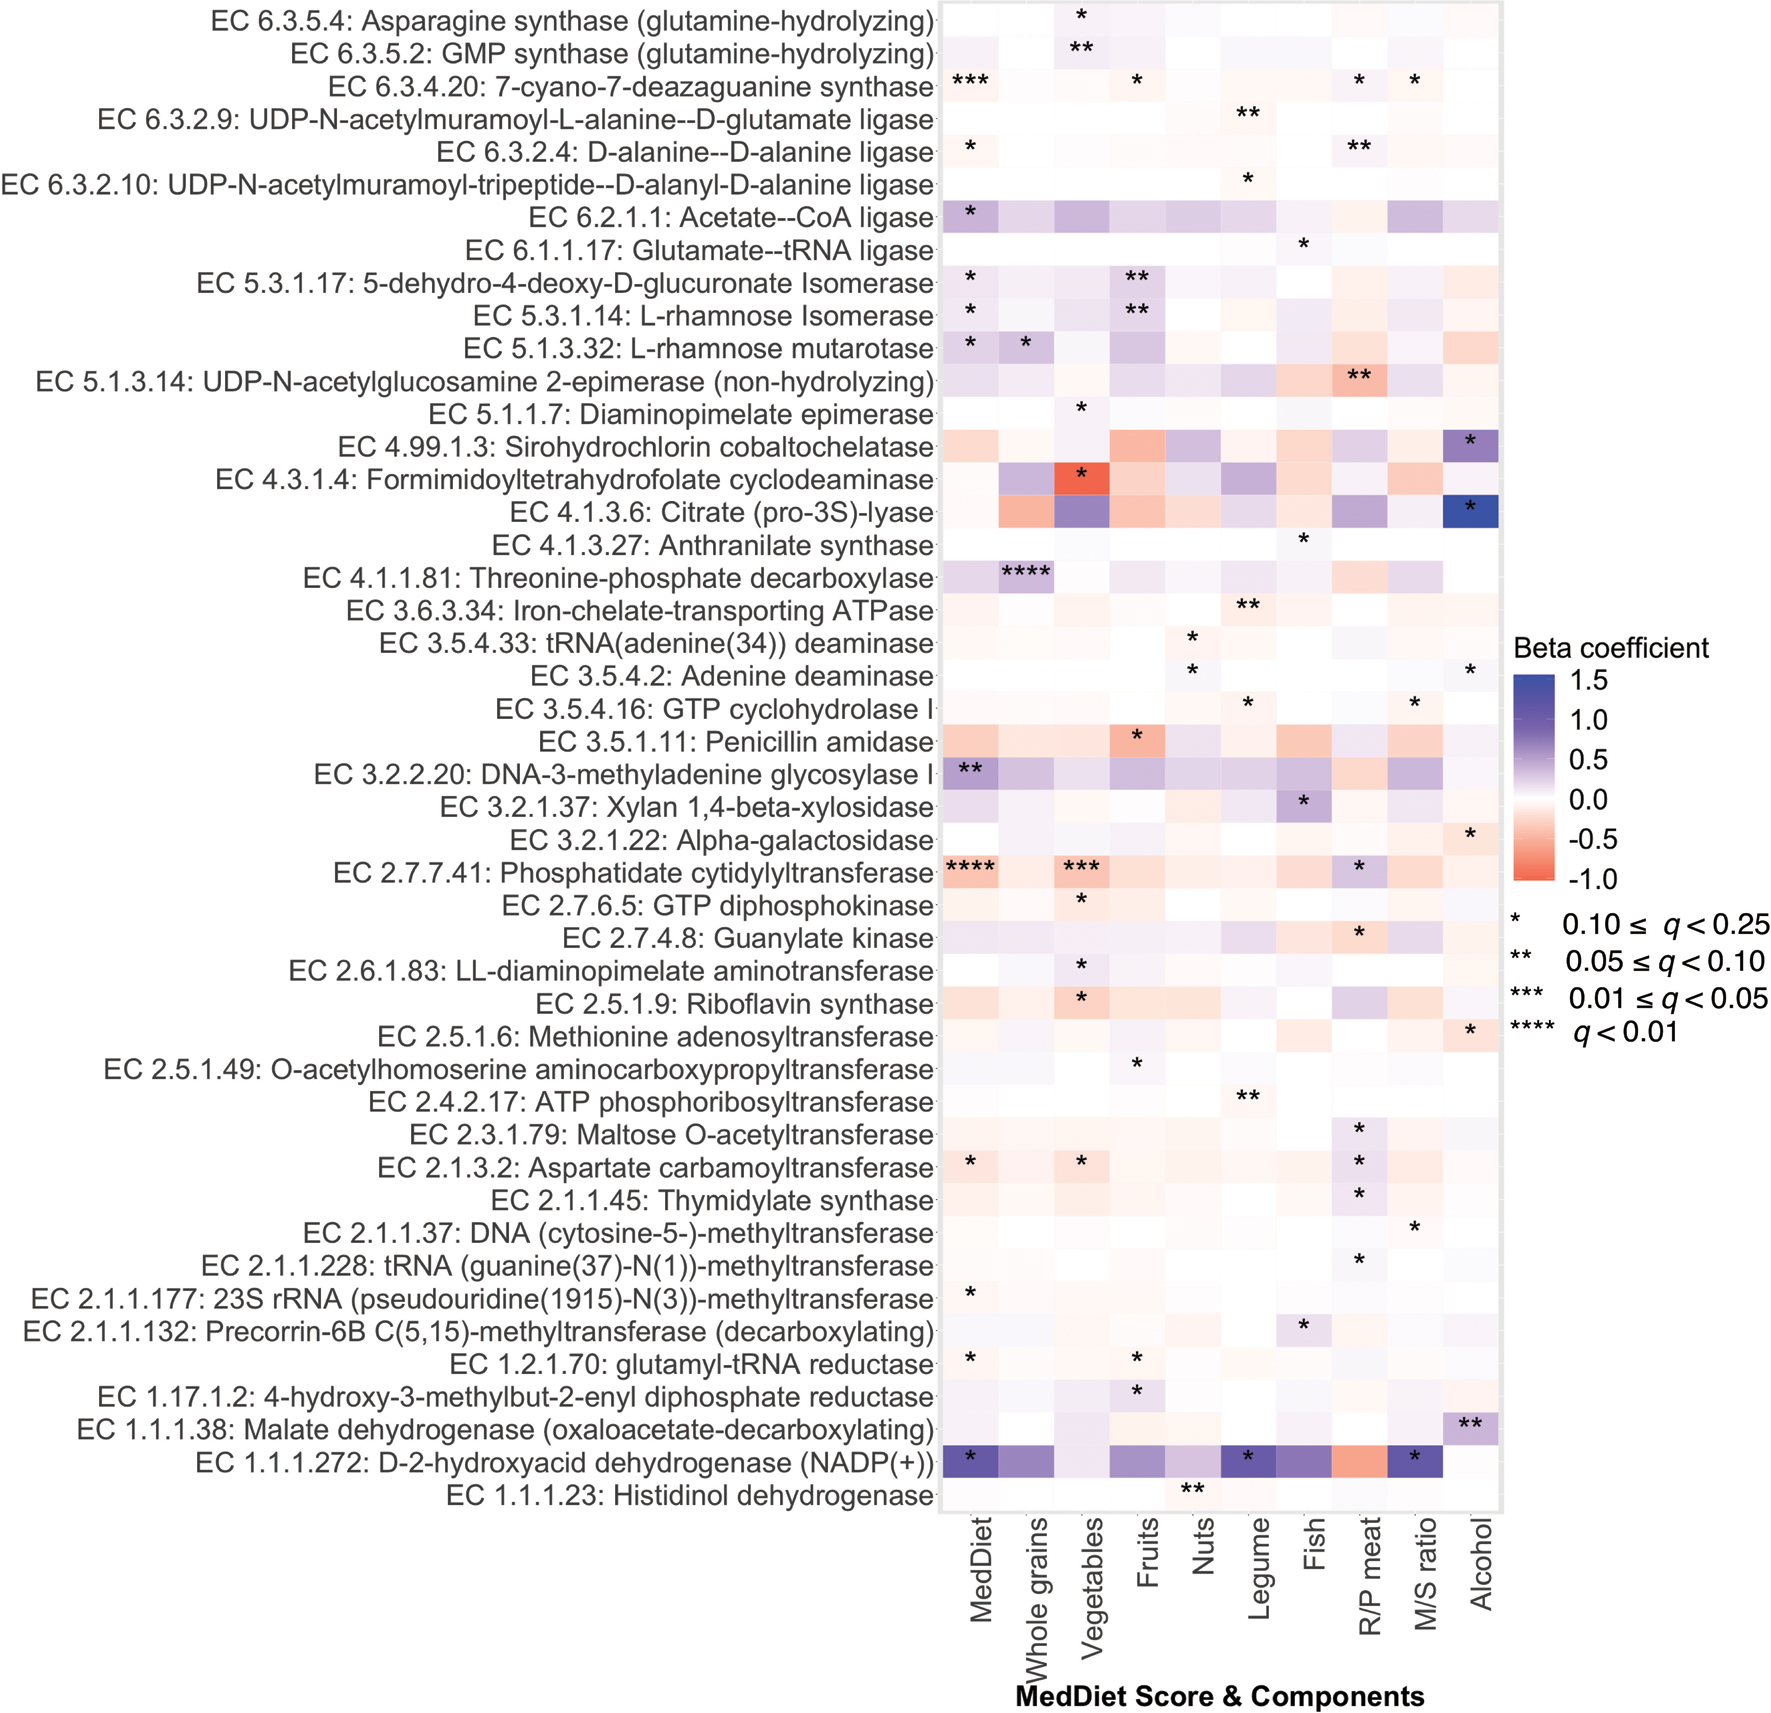
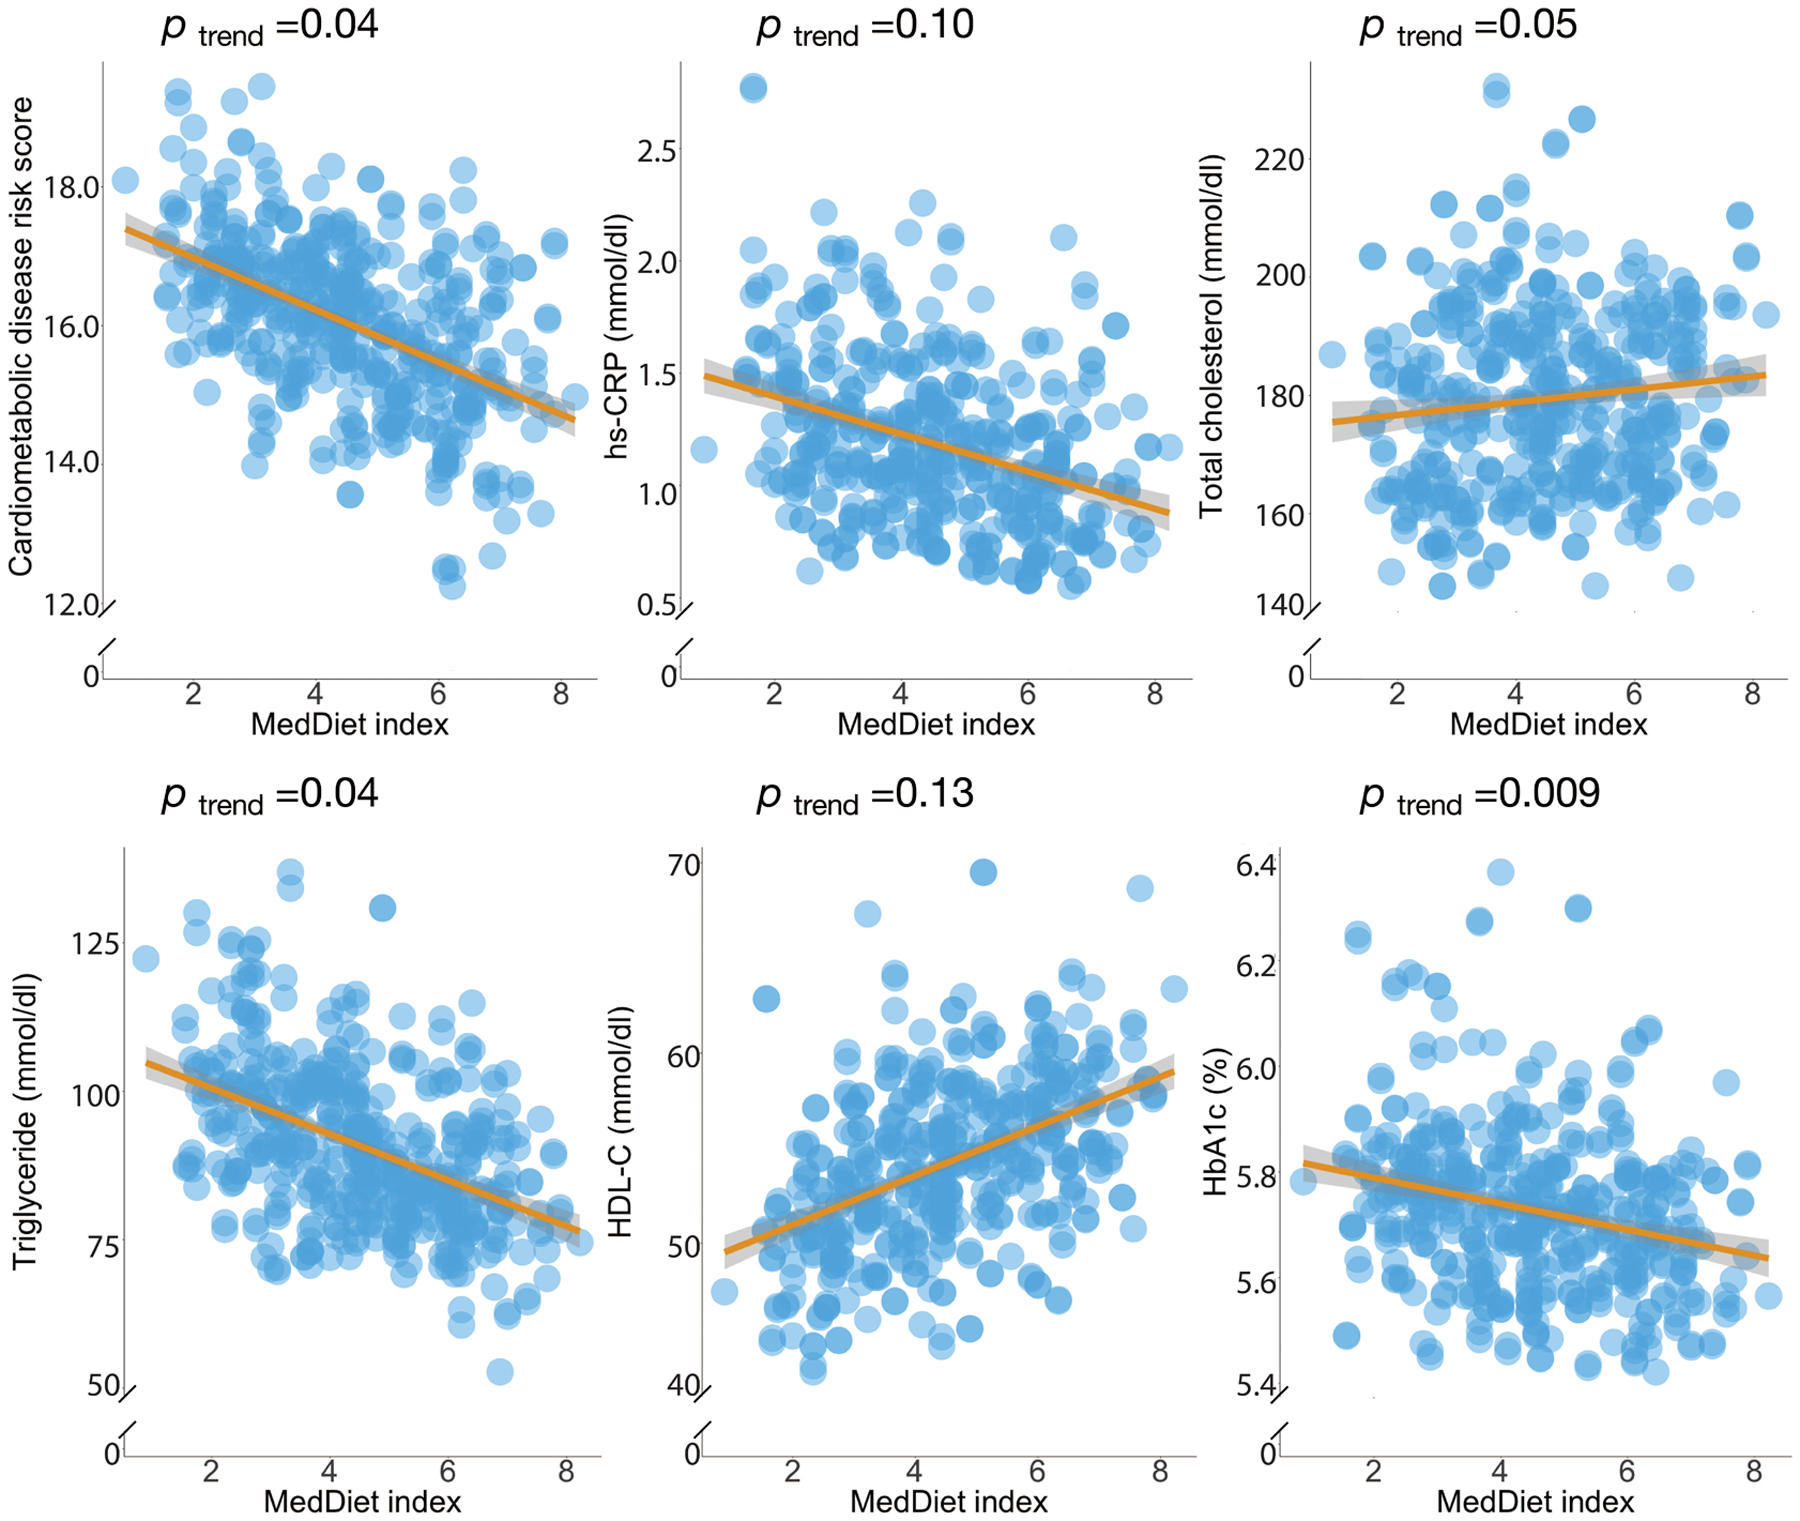
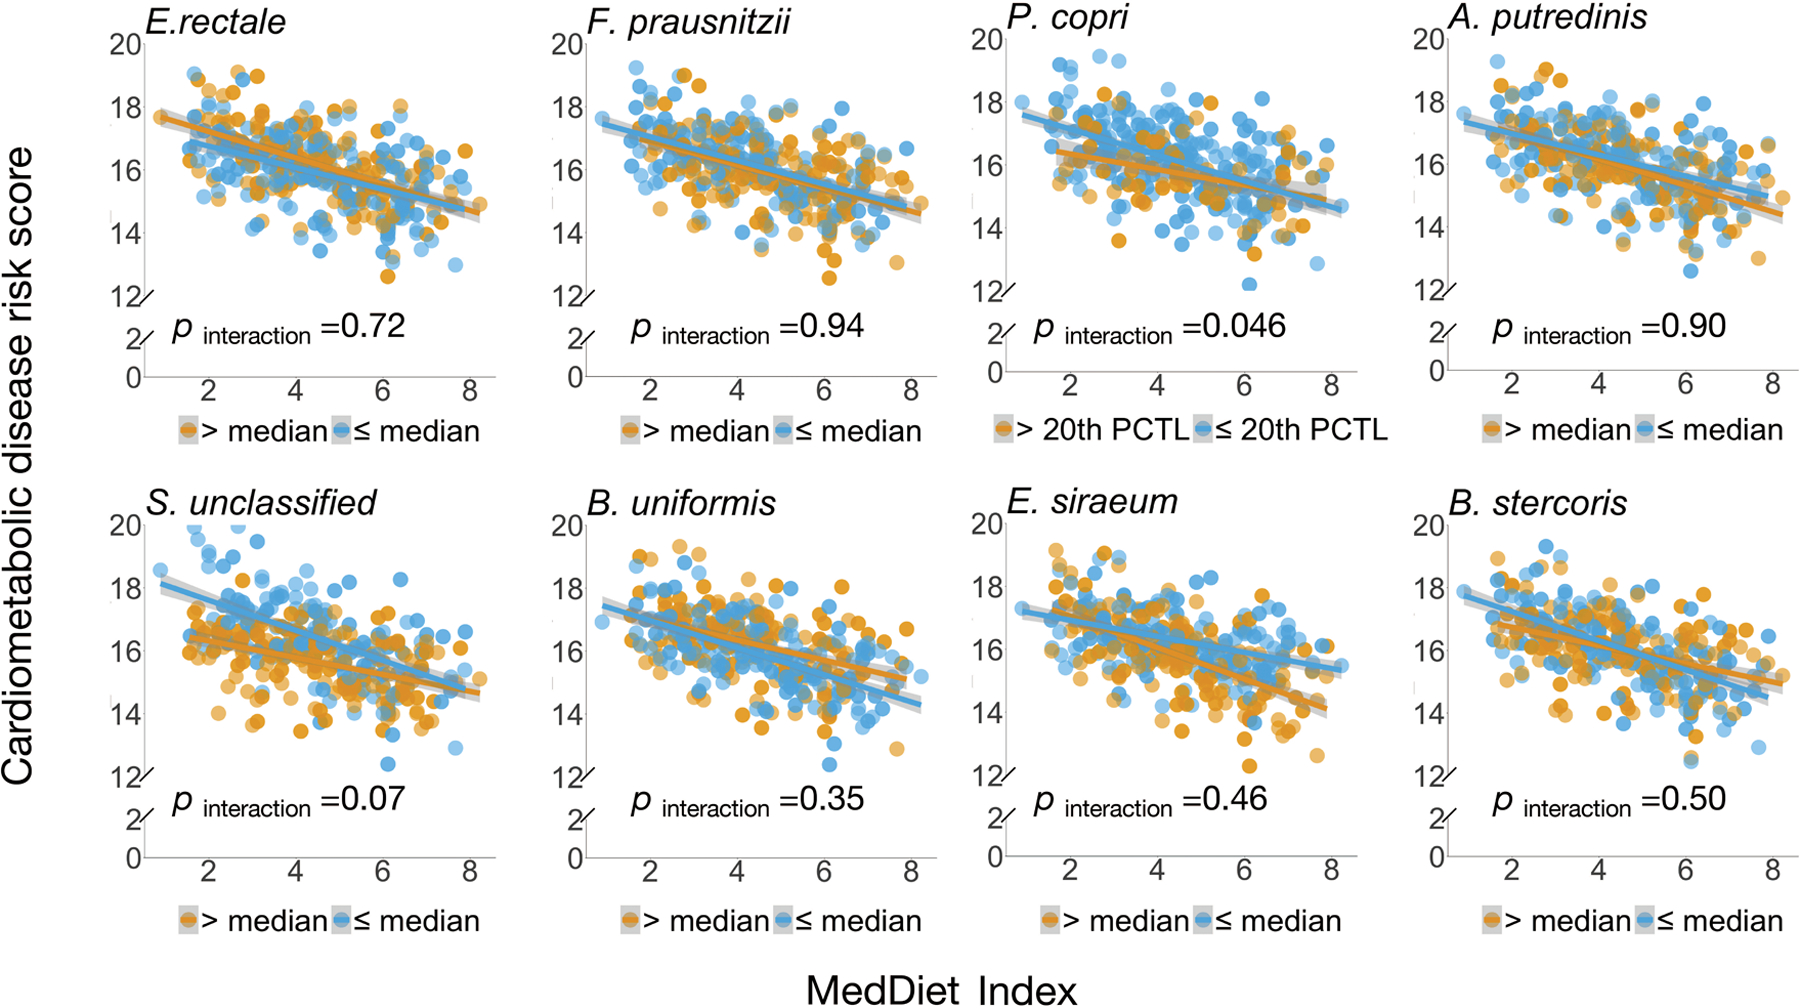
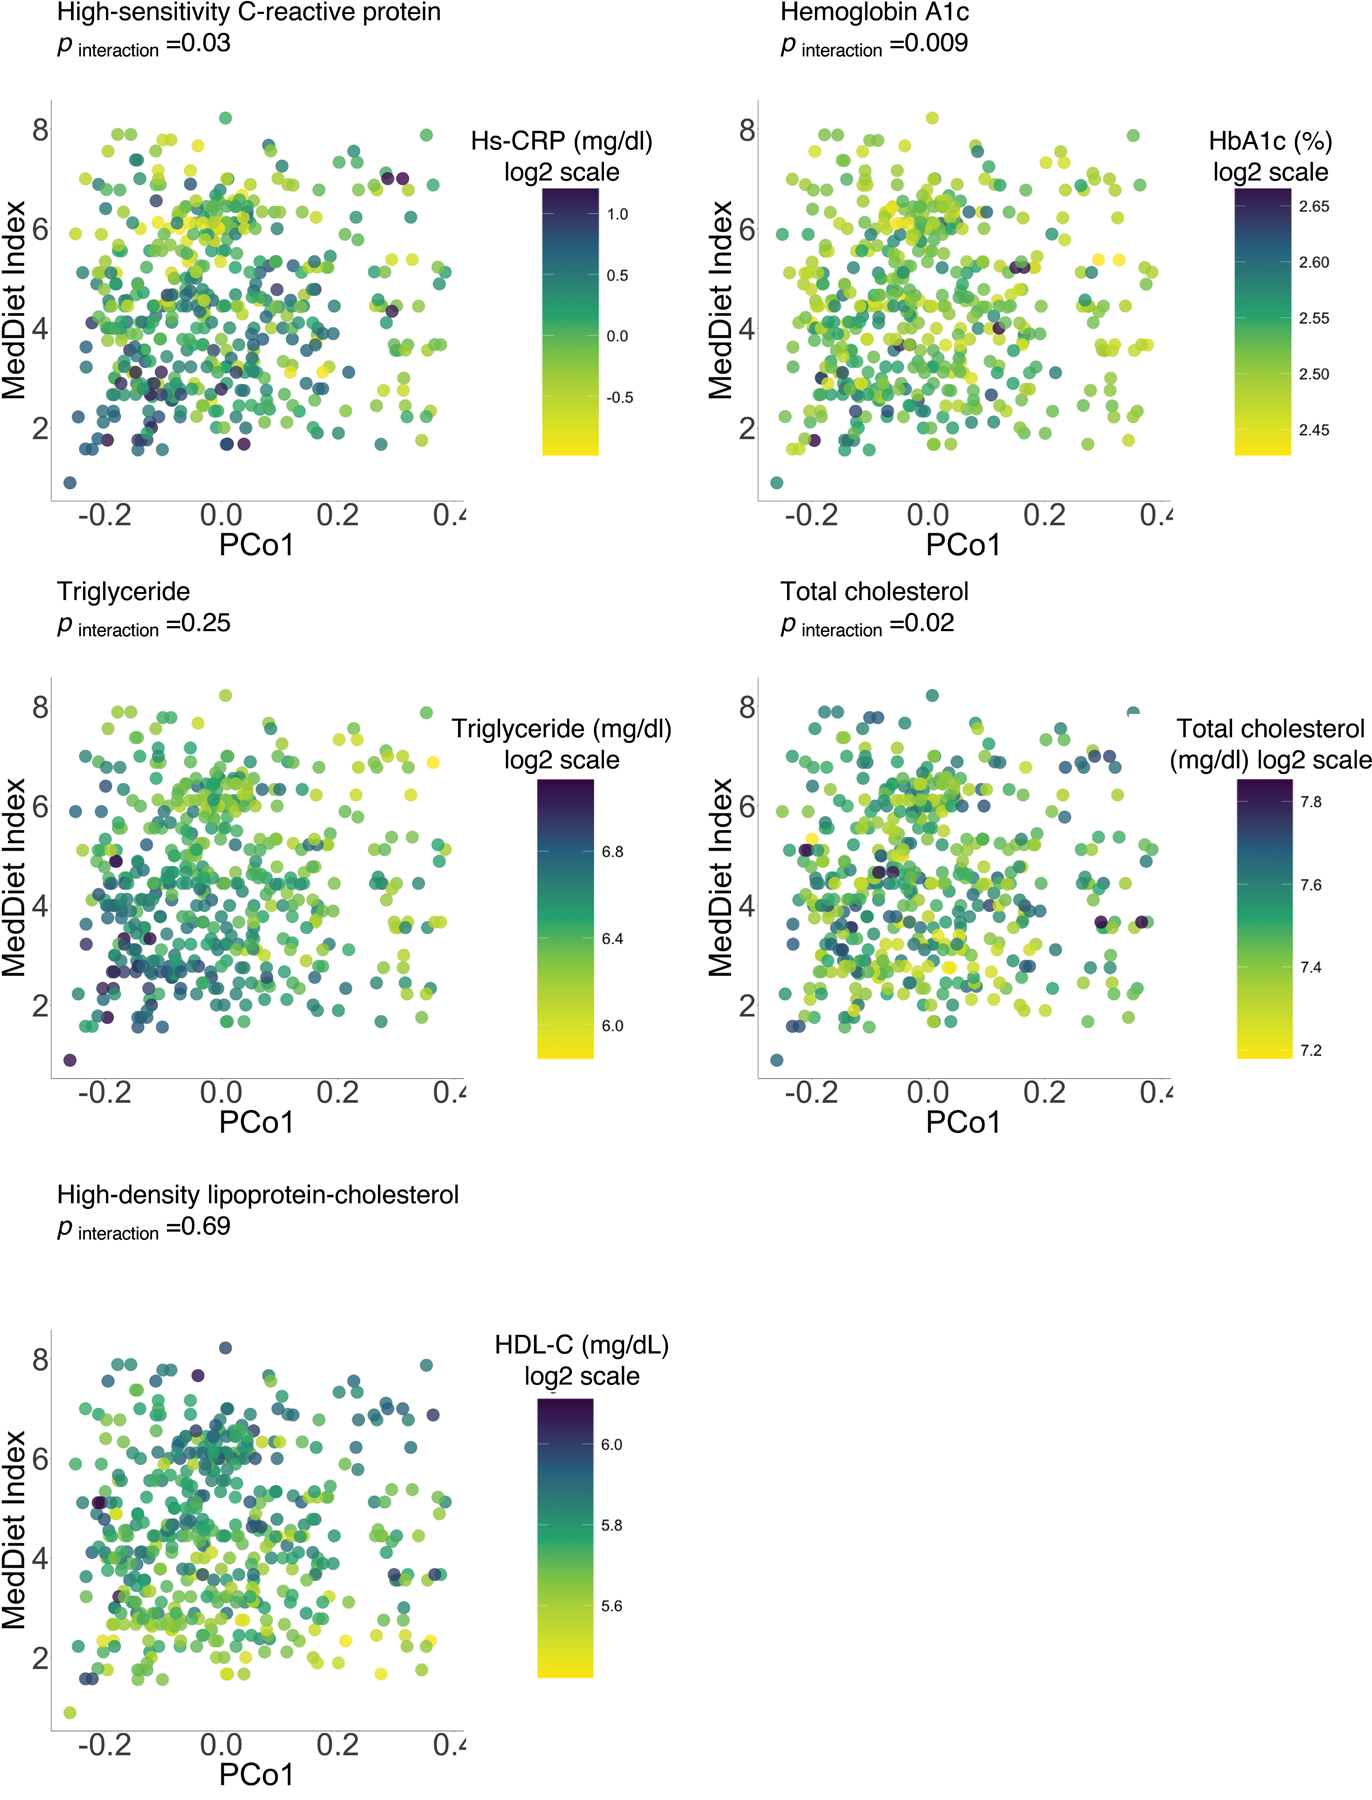
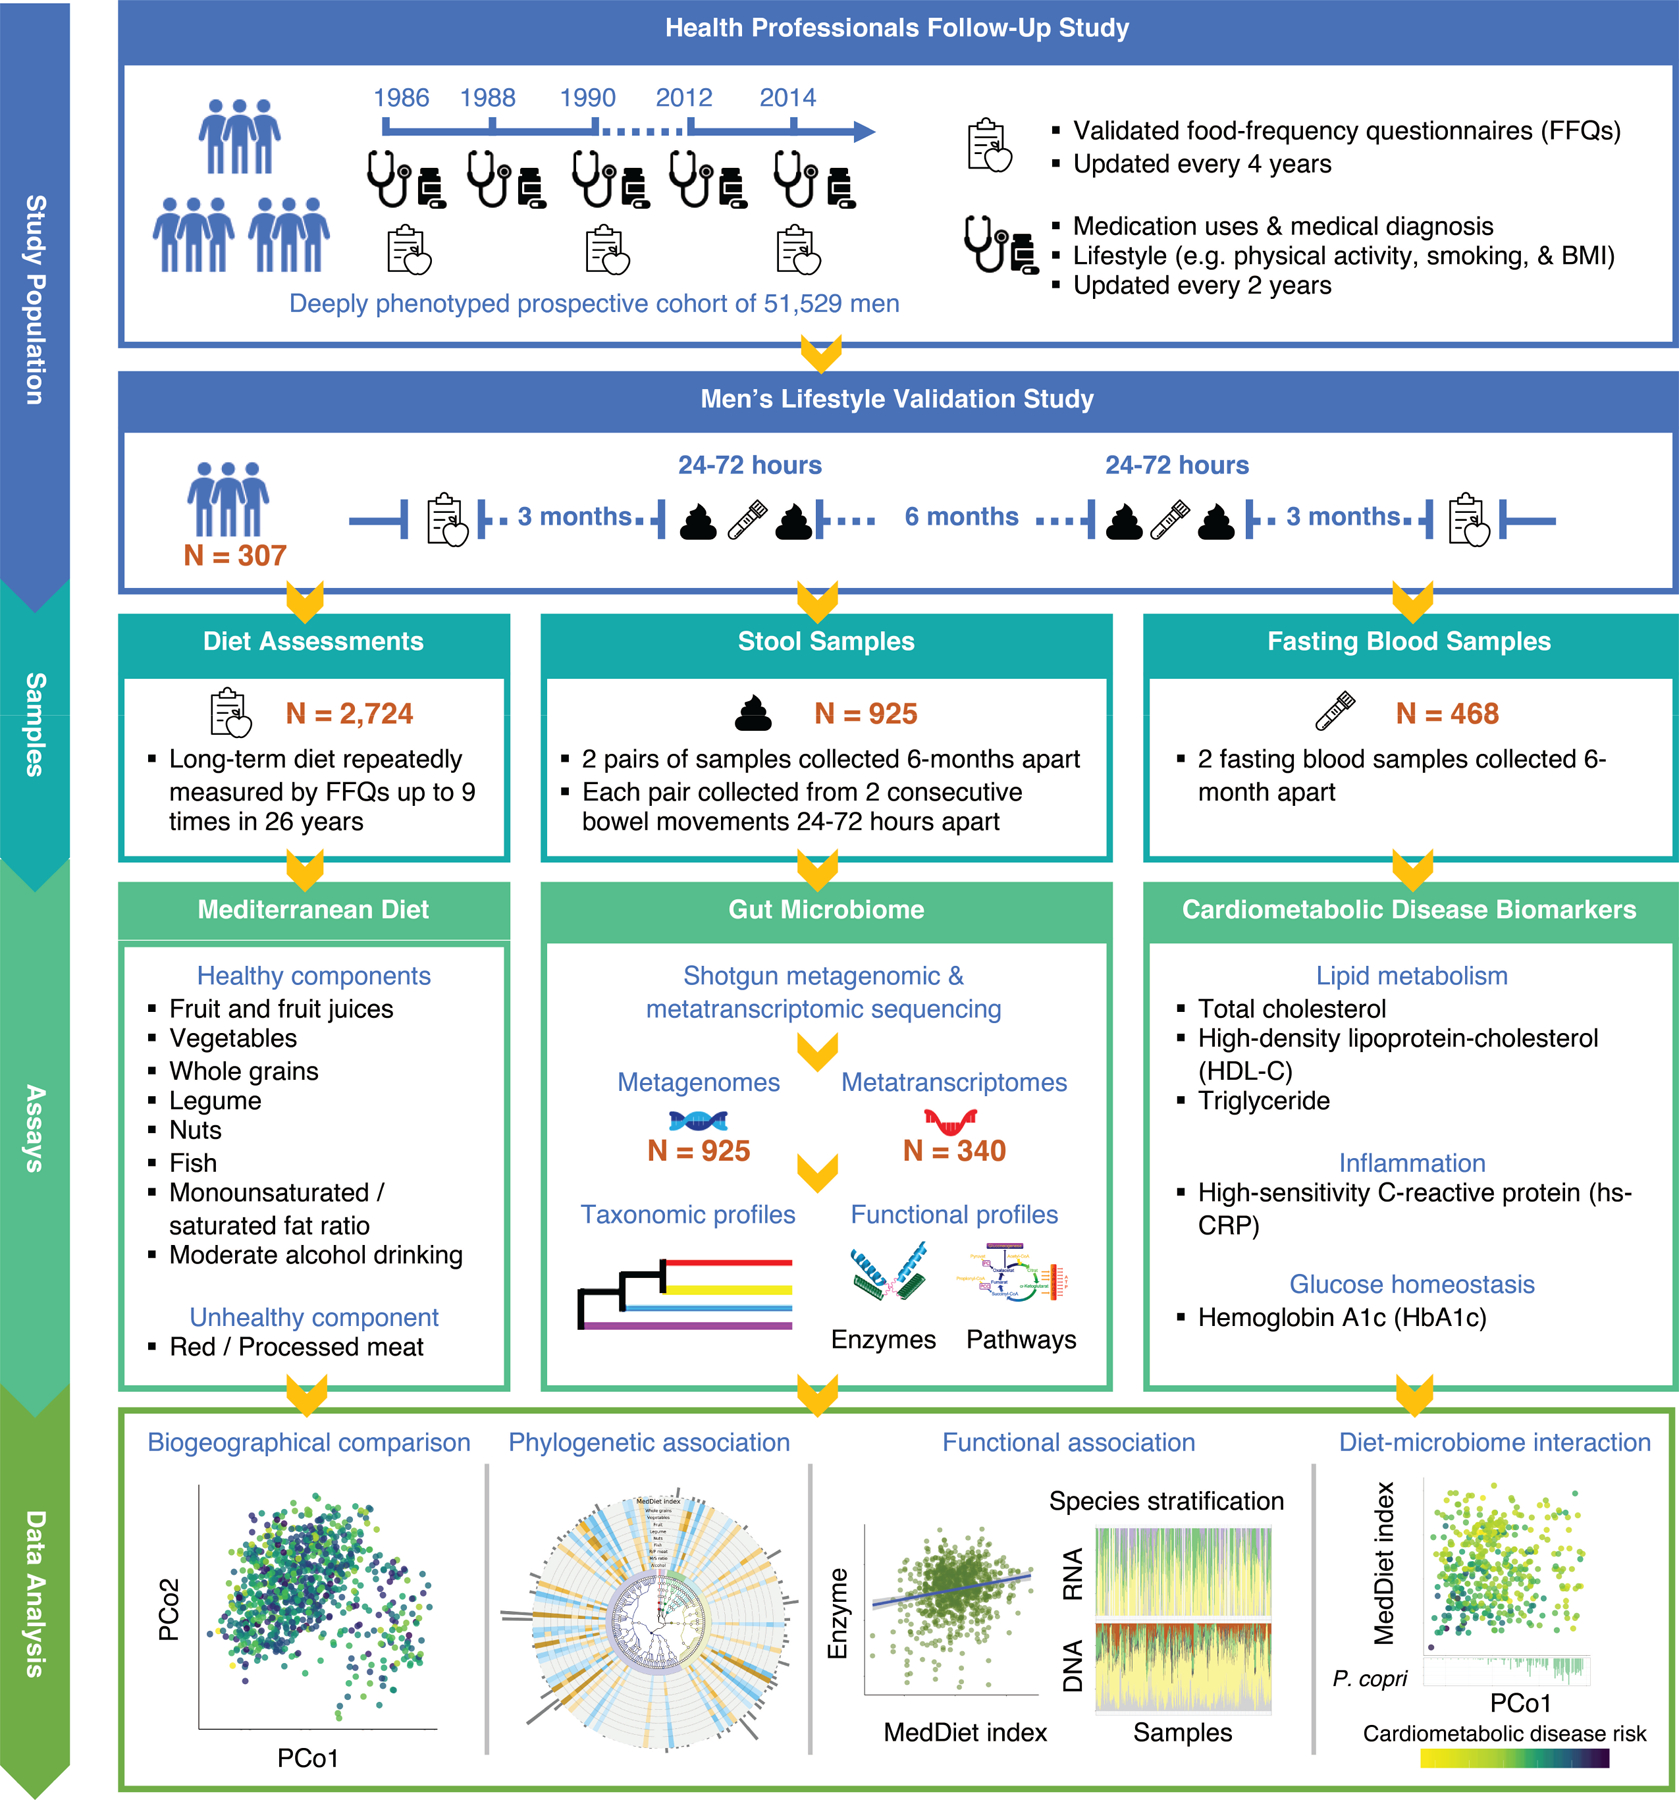
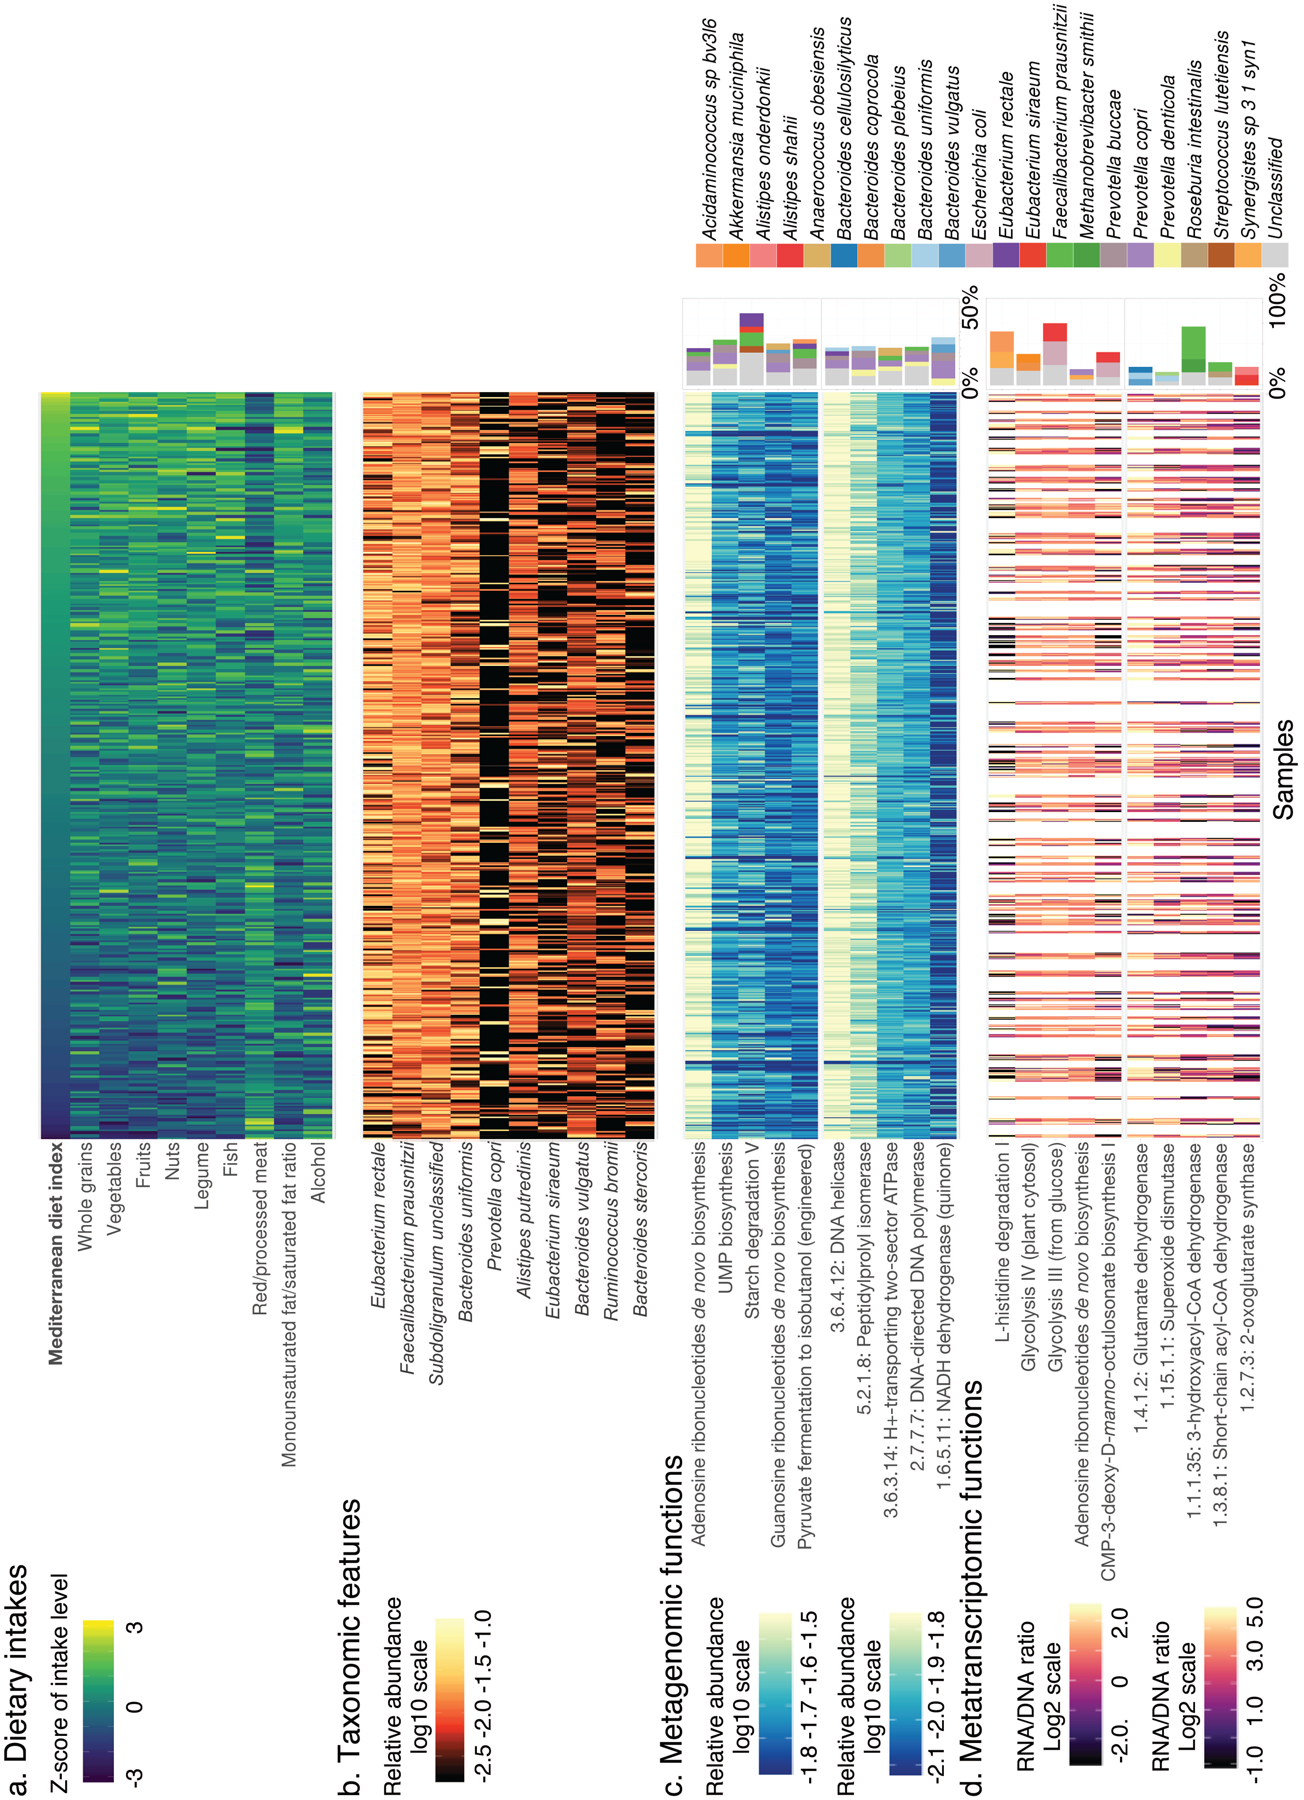
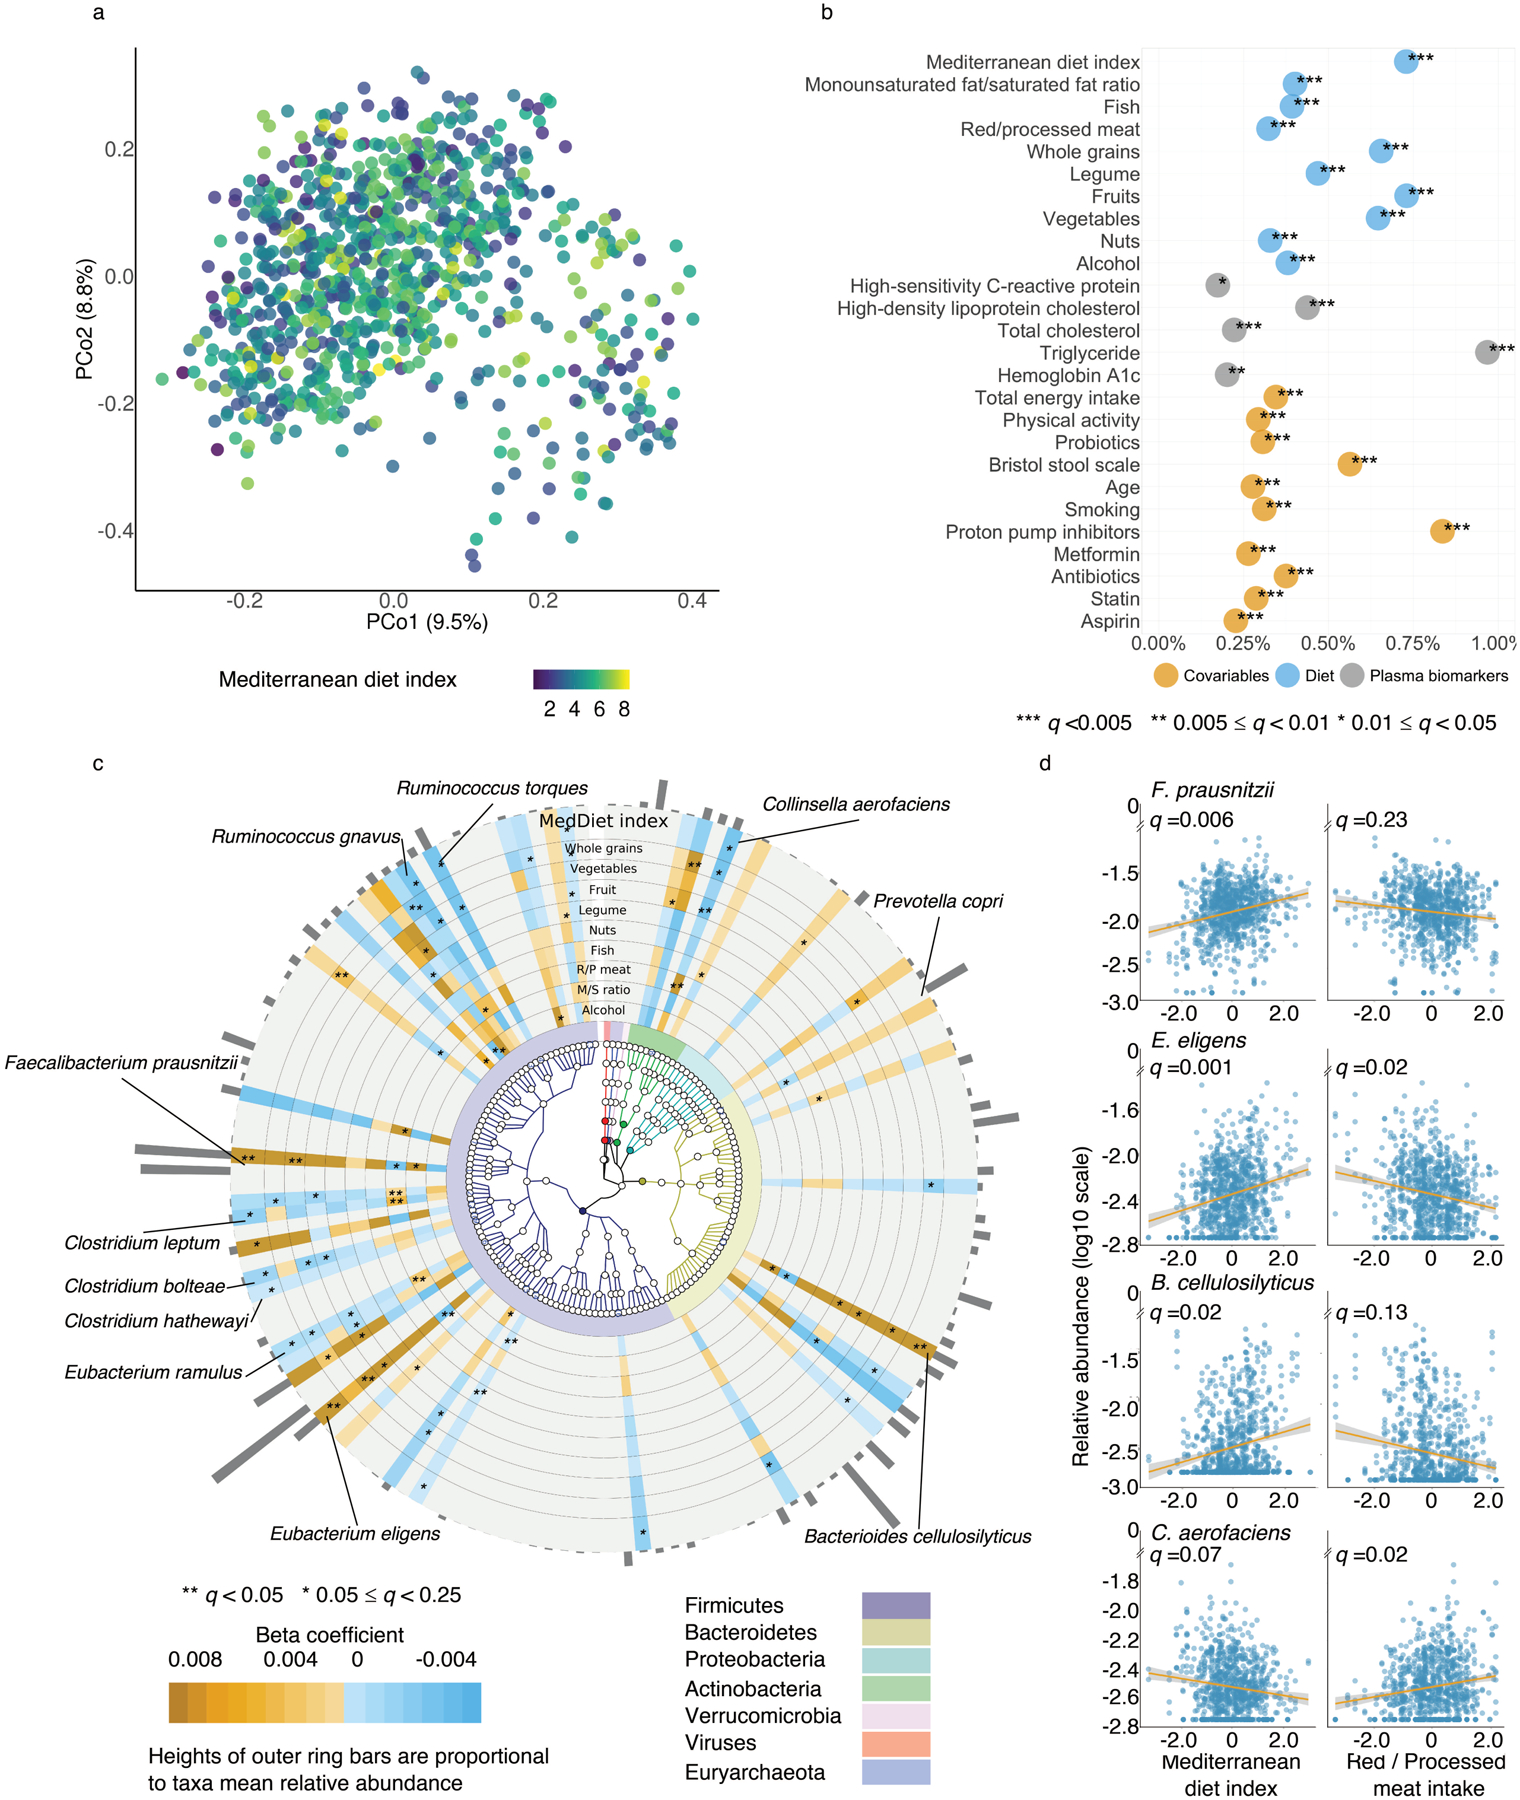
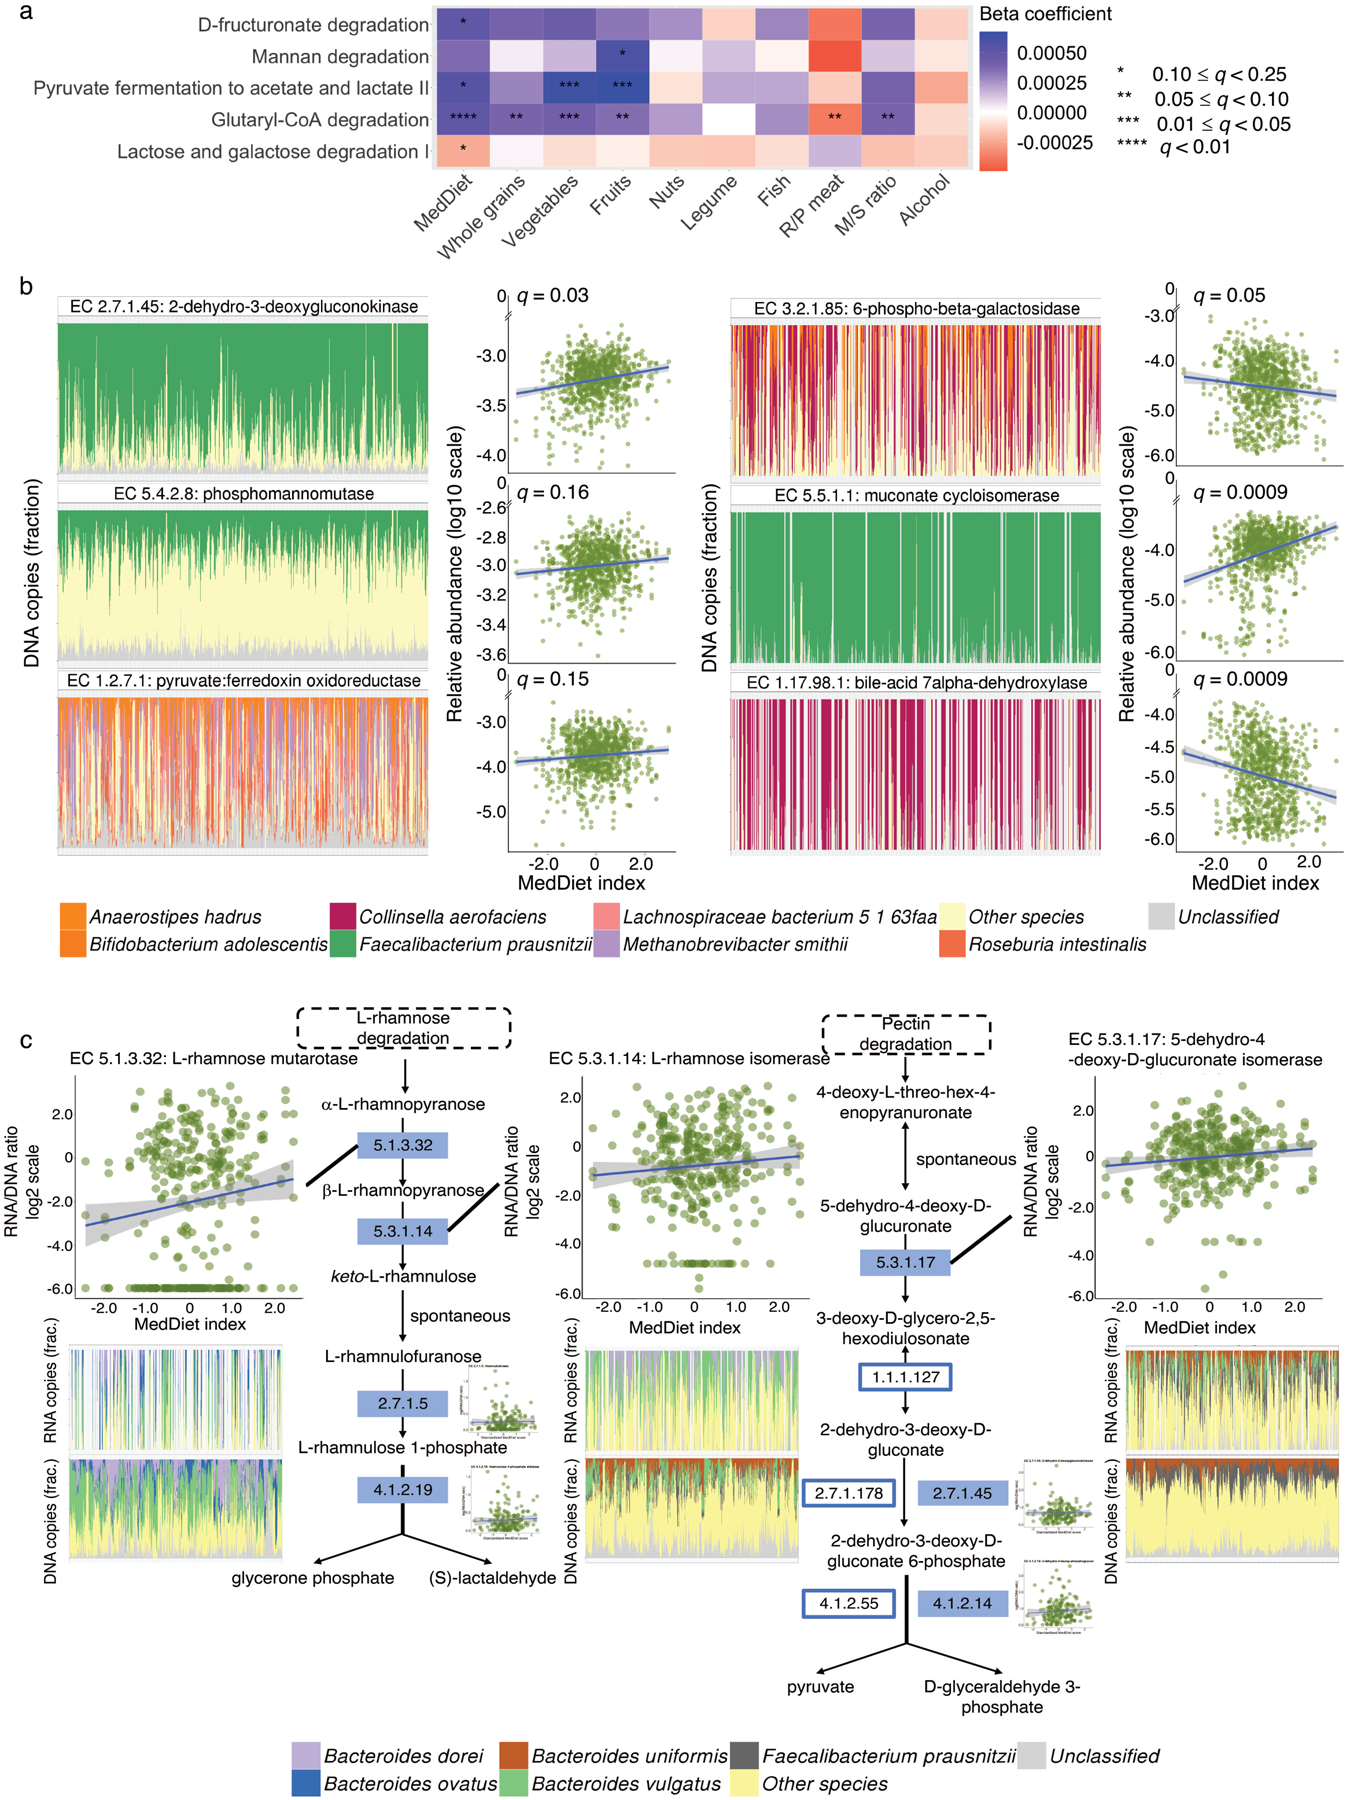
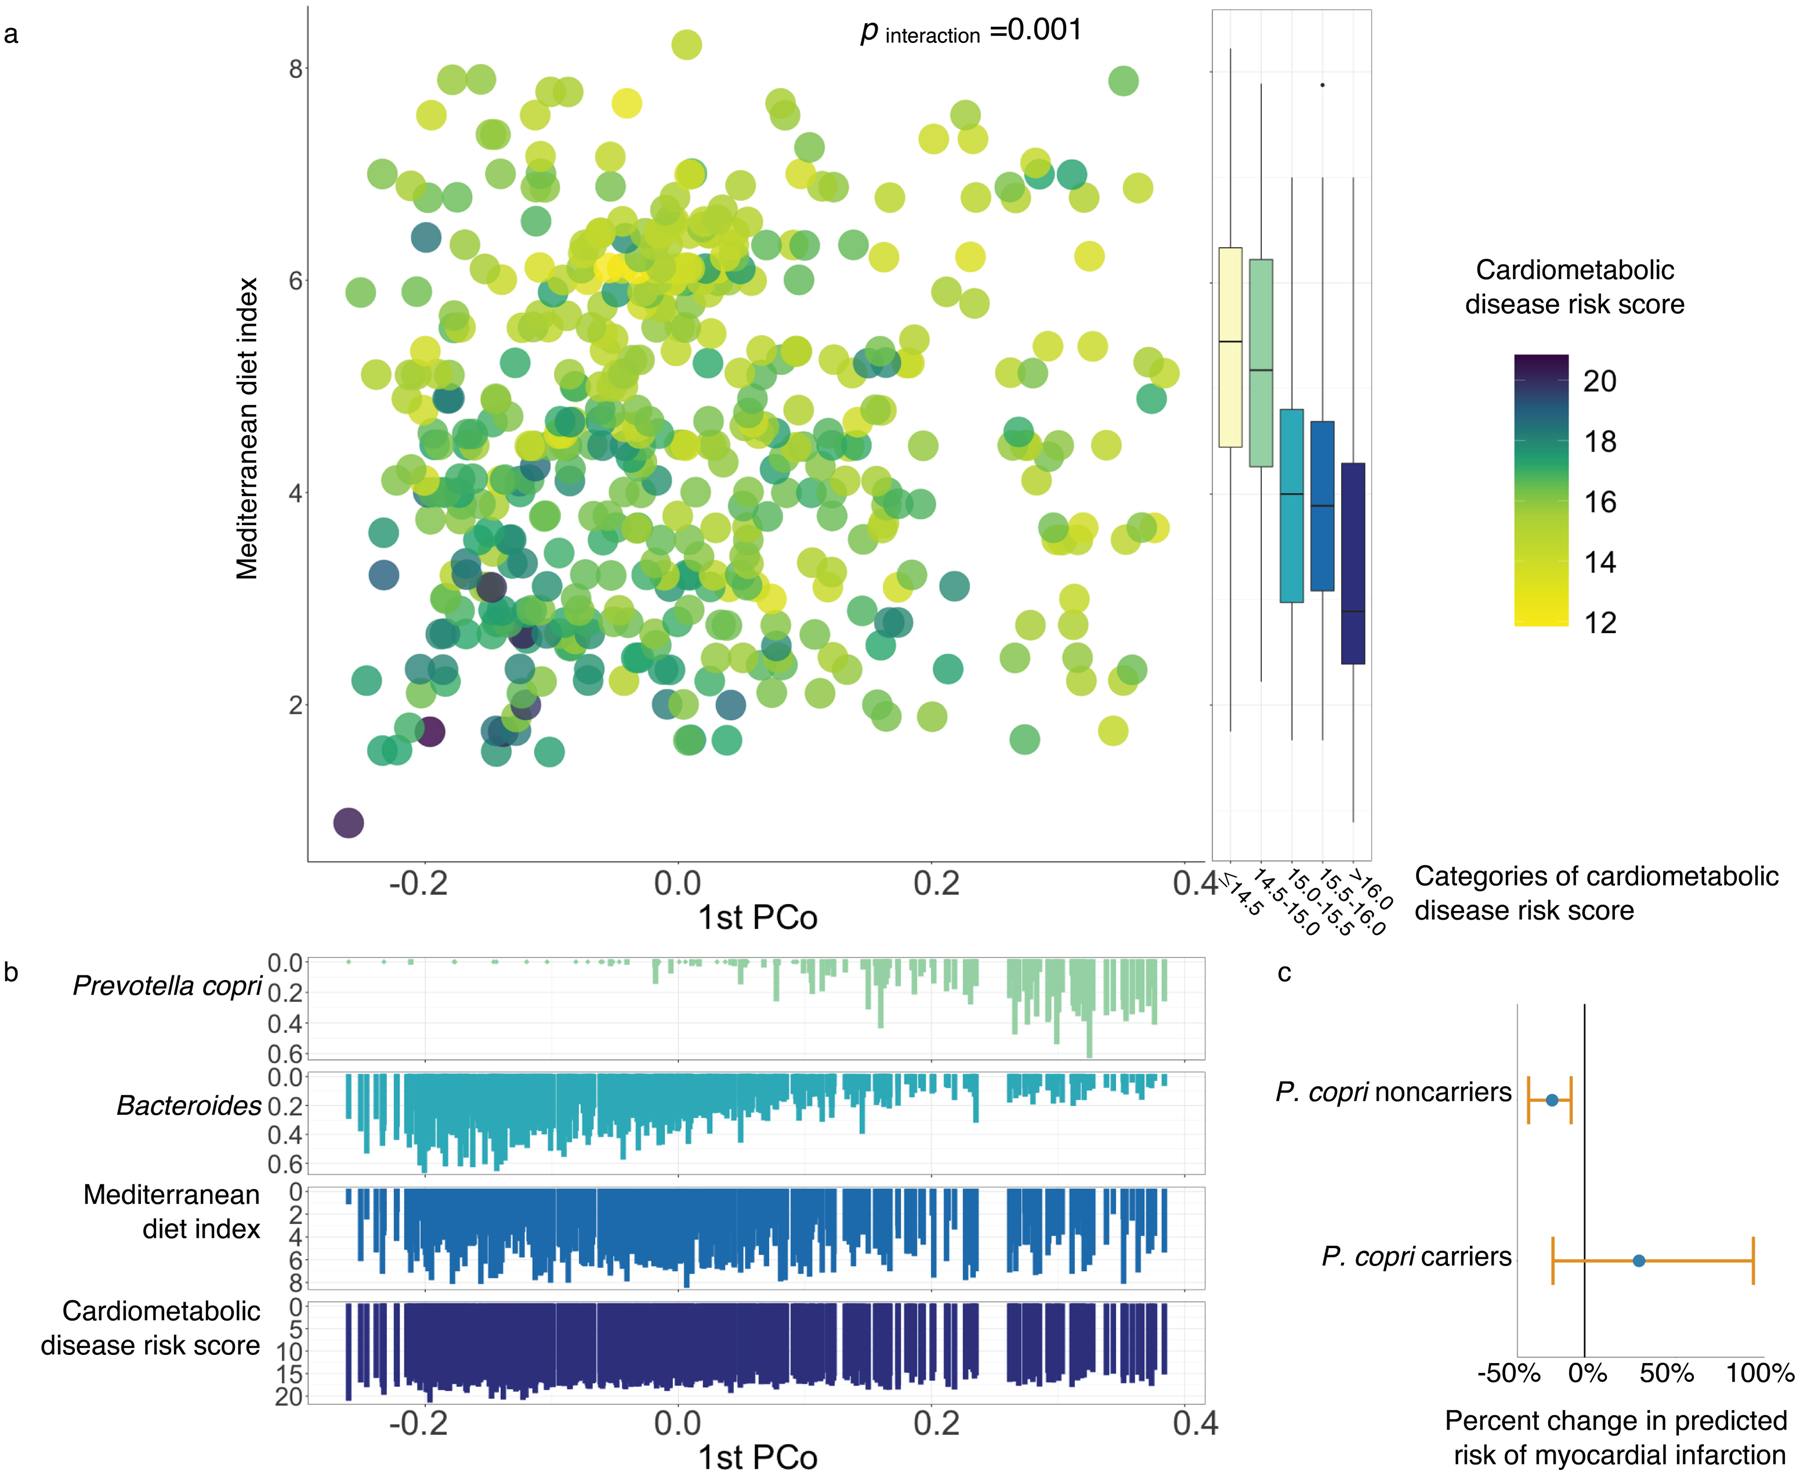
To address how the microbiome might modify the interaction between diet and cardiometabolic health, we analyzed longitudinal microbiome data from 307 male participants in the Health Professionals Follow-Up Study, together with long-term dietary information and measurements of biomarkers of glucose homeostasis, lipid metabolism and inflammation from blood samples. Here, we demonstrate that a healthy Mediterranean-style dietary pattern is associated with specific functional and taxonomic components of the gut microbiome, and that its protective associations with cardiometabolic health vary depending on microbial composition. In particular, the protective association between adherence to the Mediterranean diet and cardiometabolic disease risk was significantly stronger among participants with decreased abundance of Prevotella copri. Our findings advance the concept of precision nutrition and have the potential to inform more effective and precise dietary approaches for the prevention of cardiometabolic disease mediated through alterations in the gut microbiome.


Figures

Extended Data Figure 1:
Extended Data Figure 1:. Mediterranean diet index and its individual components.
(a) Distribution of the Mediterranean diet (MedDiet) index in the study population. Each participant’s adherence to the MedDiet was evaluated by a 9-dimensional MedDiet index (Supplementary Table 2 and Methods) as previously described,,78. The total MedDiet index ranged from 0 (non-adherence) to 9 (perfect adherence). The index was based on the intakes of 9 items: vegetables, legumes, fruit, nuts, whole grains, red/processed meat (R/P meat), fish, alcohol, and the ratio of monounsaturated to saturated fat (M/S ratio). Participants who had a higher adherence to MedDiet consumed more beneficial components of the dietary pattern, including whole grains, vegetables, fruit, nuts, legumes, fish, monounsaturated fats (at the expense of saturated fats) and moderate alcohol drinking, but less red and processed meat, a detrimental component of the MedDiet index. (b) Correlations between the MedDiet index, its individual constituent food and nutrient contributors, and dairy food. Values in the figure are partial Spearman correlation coefficients with adjustment for total energy intake. As expected, the composite MedDiet score was positively correlated with “healthy” contributing factors, negatively correlated with “unhealthy” factors, and, importantly, not dominated by any one component.
Extended Data Figure 2:
Extended Data Figure 2:. Principal coordinate analysis of species-level Bray-Curtis dissimilarity colored by the relative abundance of major taxonomic features.
(a) Principal coordinate analysis of species-level Bray-Curtis dissimilarity colored in correspondence to the relative abundance of Bacteroidetes and Firmicutes phyla. As expected, a majority of variation in the species-level compositional structure of the gut microbiome was driven by a tradeoff between Bacteroidetes versus Firmicutes phyla. (b) Principal coordinate analysis of species-level Bray-Curtis dissimilarity colored in correspondence to the relative abundance of 9 most abundant species-level features. The most prominent patterns of gut microbial taxonomic variation in the population included tradeoffs between the abundances of Eubacterium rectale and Bacteroides uniformis vs. Subdoligranulum unclassified and P. copri.
Extended Data Figure 3:
Extended Data Figure 3:. Association between the adherence to a Mediterranean dietary pattern and microbiome taxonomic diversity.
The diversity of gut microbiome was quantified by Shannon diversity index. P for linear trend was derived from a general linear model with the Shannon diversity index as the dependent variable and the quartiles of the Mediterranean diet index as independent variables. The significance test was two-sided. Box plot centers show medians of the Shannon diversity index with boxes indicating their inter-quartile ranges (IQRs); upper and lower whiskers indicate 1.5 times the IQR from above the upper quartile and below the lower quartile, respectively. This analysis was conducted based on 925 metagenomes from 307 participants.
Extended Data Figure 4:
Extended Data Figure 4:. Associations of the Mediterranean diet index and its components with species-level features.
Colors of the heatmap are in correspondence to the beta coefficient for dietary variables from linear mixed models in MaAsLin 2 with species-level feature as outcomes. All models included each participant’s identifier as random effects and simultaneously adjusted for total energy intake, age, physical activity level, smoking, probiotic use, uses of antibiotics, proton pump inhibitors, aspirin, statins and metformin, and the Bristol stool scale. Statistical significance is from the linear mixed model with multiple comparison adjustment using the Benjamini-Hochberg method to calculate q-values (false discovery rate adjusted p-value, exact q-values in Source Data). These analyses were based on 925 metagenomes collected from 307 participants. All the statistical tests were two-sided.
Extended Data Figure 5:
Extended Data Figure 5:. Associations of the Mediterranean diet index and its components with metagenomic pathways.
Colors of the heatmap are in correspondence to the beta coefficient for dietary variables from linear mixed models in MaAsLin 2 with metagenomic pathways as outcomes. All models included each participant’s identifier as random effects and simultaneously adjusted for total energy intake, age, physical activity level, smoking, probiotic use, uses of antibiotics, proton pump inhibitors, statins, aspirin and metformin, and Bristol stool scale. Statistical significance is from the linear mixed model with multiple comparison adjustment using the Benjamini-Hochberg method to calculate q-values (false discovery rate adjusted p-value, exact q-values in Source Data). These analyses were based on 925 metagenomes collected from 307 participants. All the statistical tests were two-sided.
Extended Data Figure 6:
Extended Data Figure 6:. Associations of the Mediterranean diet index and its components with metagenomic enzymes.
Colors of the heatmap are in correspondence to the beta coefficient for dietary variables from linear mixed models in MaAsLin 2 with metagenomic enzymes as outcomes. All models included each participant’s identifier as random effects and simultaneously adjusted for total energy intake, age, physical activity level, smoking, probiotic use, uses of antibiotics, proton pump inhibitors, statins, aspirin and metformin, and Bristol stool scale. Statistical significance is from the linear mixed model with multiple comparison adjustment using the Benjamini-Hochberg method to calculate q-values (false discovery rate adjusted p-value, exact q-values in Source Data). These analyses were based on 925 metagenomes collected from 307 participants. All the statistical tests were two-sided.
Extended Data Figure 7:
Extended Data Figure 7:. Associations of the Mediterranean diet index and its components with transcription levels of microbial enzymes.
Colors of the heatmap are in correspondence to the beta coefficient for dietary variables from linear mixed models in MaAsLin 2 with transcription levels of microbial enzymes (RNA/DNA ratio) as outcomes. All models included each participant’s identifier as random effects and simultaneously adjusted for total energy intake, age, physical activity level, smoking, probiotic use, and Bristol stool scale. Statistical significance is from the linear mixed model with multiple comparison adjustment using the Benjamini-Hochberg method to calculate q-values (false discovery rate adjusted p-value, exact q-values in Source Data). These analyses were based on 340 metatranscriptome and metagenome pairs from 96 participants. All the statistical tests were two-sided.
Extended Data Figure 8:
Extended Data Figure 8:. Associations of the Mediterranean diet index with the cardiometabolic disease risk score and biomarkers.
P-values were estimated from linear mixed model that included each participant’s identifier as random effects and simultaneously adjusted for total energy intake, age, physical activity level, smoking, probiotic use, Bristol stool scale, uses of antibiotics, statins, aspirin, proton pump inhibitors and metformin and the 1st principal coordinate analysis loading as fixed effects. This analysis was based on 468 blood samples from 304 participants. The shaded areas indicate 95% confidence intervals of values on the fitted linear trend lines. All the statistical tests were two-sided.
Extended Data Figure 9:
Extended Data Figure 9:. Interaction between adherence to the Mediterranean diet and the abundance of highly abundant microbial species in relation to the score of cardiometabolic disease risk.
P for interaction was derived from linear mixed models that included participant’s identifier as random effects, the Mediterranean diet index, individual microbial species and their product term, and simultaneously adjusted for total energy intake, age, physical activity level, smoking, probiotic use, Bristol stool scale, and uses of antibiotics, statins, aspirin, proton pump inhibitors and metformin as fixed effects. We performed two-sided likelihood ratio tests by comparing models with and without an interaction term to calculate p-values for interaction (degree of freedom =1). This analysis was based on 468 blood samples from 304 participants. The shaded areas indicate 95% confidence intervals of values on the fitted linear trend lines.
Extended Data Figure 10:
Extended Data Figure 10:. The gut microbial profile modifies associations of the MedDiet with individual biomarkers of cardiometabolic disease risk.
P for interaction was derived from a linear mixed model that included participant’s identifier as random effects, the MedDiet index, individual microbial species and their product term, and simultaneously adjusted for total energy intake, age, physical activity level, smoking, probiotic use, Bristol stool scale, and uses of antibiotics, statins, aspirin, proton pump inhibitors and metformin as fixed effects. We performed two-sided likelihood ratio tests by comparing models with and without an interaction term to calculate p-values for interaction (degree of freedom =1). This analysis was based on 468 blood samples from 304 participants.
Figure 1:
Figure 1:. Experimental strategy for linking diet, the gut microbiome, and cardiometabolic disease risk in the Men’s Lifestyle Validation Study.
In order to associate gut microbiome features with diet and cardiometabolic disease risk, we profiled stool metagenomes, metatranscriptomes, and blood biomarkers of cardiometabolic disease from the Men’s Lifestyle Validation Study (MLVS). The MLVS is a sub-study of the Health Professionals Follow-up Study (HPFS), an ongoing prospective cohort totaling 51,529 men. The HPFS has repeatedly collected dietary information using validated food-frequency questionnaires (FFQs) and health-related information since 1986. In 2011 to 2013, the MLVS collected stool samples at up to four time points per individual, blood samples at up to two time points, and additional dietary information using FFQs from 307 participants. We applied MetaPhlAn 2 and HUMAnN 2 to perform taxonomic and functional profiling from stool shotgun metagenomes and metatranscriptomes. Plasma biomarkers of lipid metabolism, inflammation, and glucose homeostasis were measured using standard methods. We employed linear mixed models to account for within-subject correlation due to repeated sampling and occasional missing data (Methods).
Figure 2:
Figure 2:. Mediterranean diet and taxonomic and functional profiles of the gut microbiome.
(a) Distributions of adherence to the Mediterranean dietary pattern and intake levels of constituent foods and nutrients among study participants (n=307, data in Supplementary Table 3). (b) Distributions of the 10 microbial species most abundant on average in analyzed metagenomes (based on 925 metagenomes, data in Supplementary Table 4). (c) Distributions of the five most metagenomically abundant DNA pathways (top) and enzymes (bottom), as well as the top five species contributing to each enzyme or pathway (right, also based on 925 metagenomes, data in Supplementary Tables 4 and 5). (d) Distributions of DNA-normalized transcript abundance for the five most metatranscriptomically abundant pathways (top) and enzymes (bottom), as well as the top three species contributing to each enzyme or pathway (right, based on 340 metatranscriptome and metagenome pairs, data in Supplementary Tables 4 and 5). Samples are ordered by the MedDiet index (from lowest to highest). A white column indicates that a metagenome or metatranscriptome was not available for the sample.
Figure 3:
Figure 3:. Associations of the Mediterranean diet with overall gut microbiome configuration and with individual gut microbial species abundances.
(a) Principal coordinate analysis of all samples using species-level Bray-Curtis dissimilarity. (b) Proportion of variation in taxonomy explained by the Mediterranean diet (MedDiet) index, dietary factors, plasma biomarkers and covariables based two-sided PERMANOVA testing (based on species-level Bray-Curtis dissimilarity). Q-values (false discovery rate adjusted p-value) were calculated using the Benjamini-Hochberg method with a target rate of 0.25. (c) Significant associations of the MedDiet and its constituent foods and nutrients with microbial species (q ≤0.25). This plot shows associations of dietary factors with specific microbial species overlaid onto their taxonomy. The blue-to-orange gradient in the outer rings represent the magnitude and direction of the associations between dietary factors and species’ abundances. The colors of the innermost ring and phylogenetic trees differentiate major phyla. Heights of the outmost bars are in proportion to the mean relative abundance of each microbial species. All models included each participant’s identifier as random effects and simultaneously adjusted for total energy intake, age, physical activity level, smoking, probiotic use, uses of medication including antibiotics, proton pump inhibitors, aspirin, statins and metformin, and the Bristol stool scale. (d) A subset of significant associations of plant-based foods and red/processed meat intake with microbial species (full results in Supplementary Table 6). Q-values (false discovery rate adjusted p-value) in (c) and (d) were derived from multivariable-adjusted linear mixed models as above, with multiple comparison adjustment also as above (Methods, exact q-values in Source Data). All the analyses in these panels were conducted based on all 925 metagenomes collected from 307 participants. All the statistical tests were two-sided.
Figure 4:
Figure 4:. The Mediterranean diet is associated with microbial processes involved in plant polysaccharide degradation and short-chain fatty acid production.
(a) Associations of the Mediterranean diet (MedDiet) and its constituent foods and nutrients with microbial functions (as MetaCyc pathways) involved in plant-derived polysaccharide degradation, short-chain fatty acid (SCFA) production, and lactose degradation. Beta coefficients are derived from multivariable-adjusted linear mixed models (Methods) that include the MedDiet index or a dietary factor as independent variable and abundance of microbial pathway as dependent variable (exact q-values in Source Data). (b) A subset of associations of the MedDiet with enzymes (as Enzyme Commission numbers) encoded in microbial genomes that are involved in plant-derived polysaccharide degradation, SCFA production, lignin degradation, secondary bile acid production, and lactose degradation (full results in Supplementary Table 6). Q-values (false discovery rate adjusted p-value) in (a) and (b) were derived from multivariable-adjusted linear mixed models, with multiple comparison adjustment using the Benjamini-Hochberg method with a target rate of 0.25 (Methods). Analyses in (a) and (b) use all 925 metagenomes. (c) Associations of the MedDiet with the transcription of enzymes within the pathways of L-rhamnose and pectin degradation, using 340 metatranscriptome and metagenome pairs from 96 participants. The plots in (c) are schematic representations of several pathways containing key enzymes for L-rhamnose and pectin degradation. Solid rectangles indicate those quantified from both metagenomes and metatranscriptomes. We used Enzyme Commission numbers in the rectangles to represent these enzymes. The scatter plots in (b) and (c) show the associations of the MedDiet index with relative abundance or transcription levels of microbial enzymes. The bar plots in (b) and (c) show the microbial species with the greatest contributions to each microbial enzyme, with metagenomic or metatranscriptomic samples along the X axes ordered by the MedDiet index (from the lowest to the highest). All the statistical tests were two-sided.
Figure 5:
Figure 5:. Prevotella copri carriage modulates the protective association of a Mediterranean diet with cardiometabolic disease risk.
(a) The interaction between the Mediterranean diet (MedDiet) adherence and the first principal coordinates axis (PCo1) in relation to the score of cardiometabolic disease risk. The interactions between the MedDiet index and both PCo1 score and P. copri carriage (above 20th percentile) are significant (p for interaction =0.001 and 0.046, respectively). P for interaction was calculated from multivariable-adjusted linear mixed models (Methods). We performed two-sided likelihood ratio tests by comparing models with and without an interaction term to calculate p-values for interaction (degree of freedom =1, Methods). The score of cardiometabolic disease risk was derived based on biomarkers of lipid metabolism, including total cholesterol, high-density lipoprotein cholesterol, and triglyceride, glucose homeostasis, i.e., hemoglobin A1c, and inflammation, i.e., high-sensitive C-reactive protein. This analysis was based on 468 blood samples from 304 participants. Box plot centers show medians of the MedDiet index with boxes indicating their inter-quartile ranges (IQRs); upper and lower whiskers indicate 1.5 times the IQR from above the upper quartile and below the lower quartile, respectively. (b) Distributions of P. copri, Bacteroides, the MedDiet index and cardiometabolic disease risk score against PCo1 score. (c) Associations between the MedDiet adherence and the risk of myocardial infarction (MI) in P. copri noncarriers and carriers. The dots in the plot indicate percent changes in predicted risks of MI associated with a 4-unit increment in the MedDiet index, with error bars indicating upper and lower limits of their 95% confidence intervals. This analysis was based on 304 participants who donated 468 blood samples in the current study and an additional prospectively designed case-control study in 396 MI cases and 843 controls from the Health Professionals Follow-Up Study (Methods).

Comment in

Similar articles

Cited by

References

    1. Collaborators U.S.B.o.D., et al. The State of US Health, 1990–2016: Burden of Diseases, Injuries, and Risk Factors Among US States. JAMA 319, 1444–1472 (2018). - PMC - PubMed
    1. DALYs G.B.D. & Collaborators H. Global, regional, and national disability-adjusted life-years (DALYs) for 359 diseases and injuries and healthy life expectancy (HALE) for 195 countries and territories, 1990–2017: a systematic analysis for the Global Burden of Disease Study 2017. Lancet 392, 1859–1922 (2018). - PMC - PubMed
    1. Koeth RA, et al. Intestinal microbiota metabolism of L-carnitine, a nutrient in red meat, promotes atherosclerosis. Nat Med 19, 576–585 (2013). - PMC - PubMed
    1. Kurilshikov A, et al. Gut Microbial Associations to Plasma Metabolites Linked to Cardiovascular Phenotypes and Risk. Circ Res 124, 1808–1820 (2019). - PubMed
    1. Forslund K, et al. Disentangling type 2 diabetes and metformin treatment signatures in the human gut microbiota. Nature 528, 262–266 (2015). - PMC - PubMed

Publication types

Supplementary concepts

LinkOut - more resources