. 2021 Mar;22(3):370-380.
doi: 10.1038/s41590-021-00868-7. Epub 2021 Feb 11.

BACH2 enforces the transcriptional and epigenetic programs of stem-like CD8+ T cells

Affiliations

BACH2 enforces the transcriptional and epigenetic programs of stem-like CD8+ T cells

Chen Yao et al. Nat Immunol. 2021 Mar.

Erratum in

Abstract

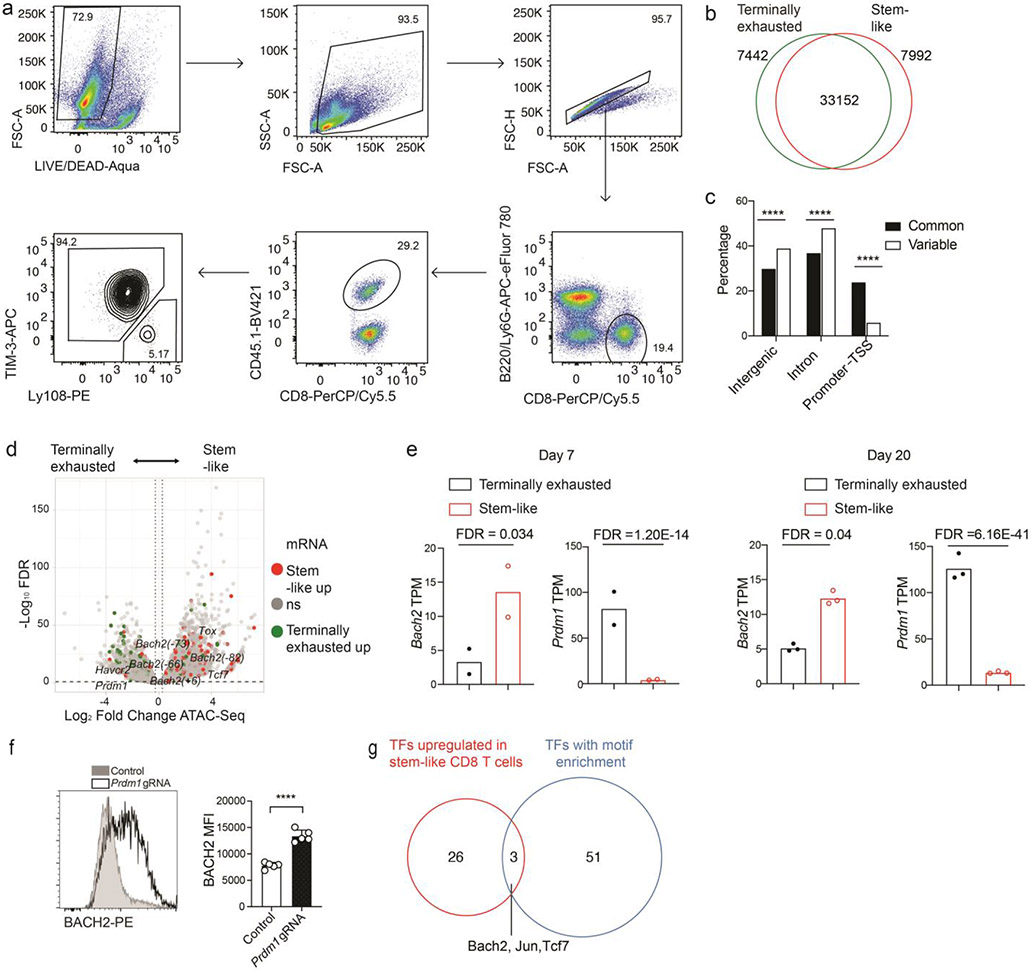
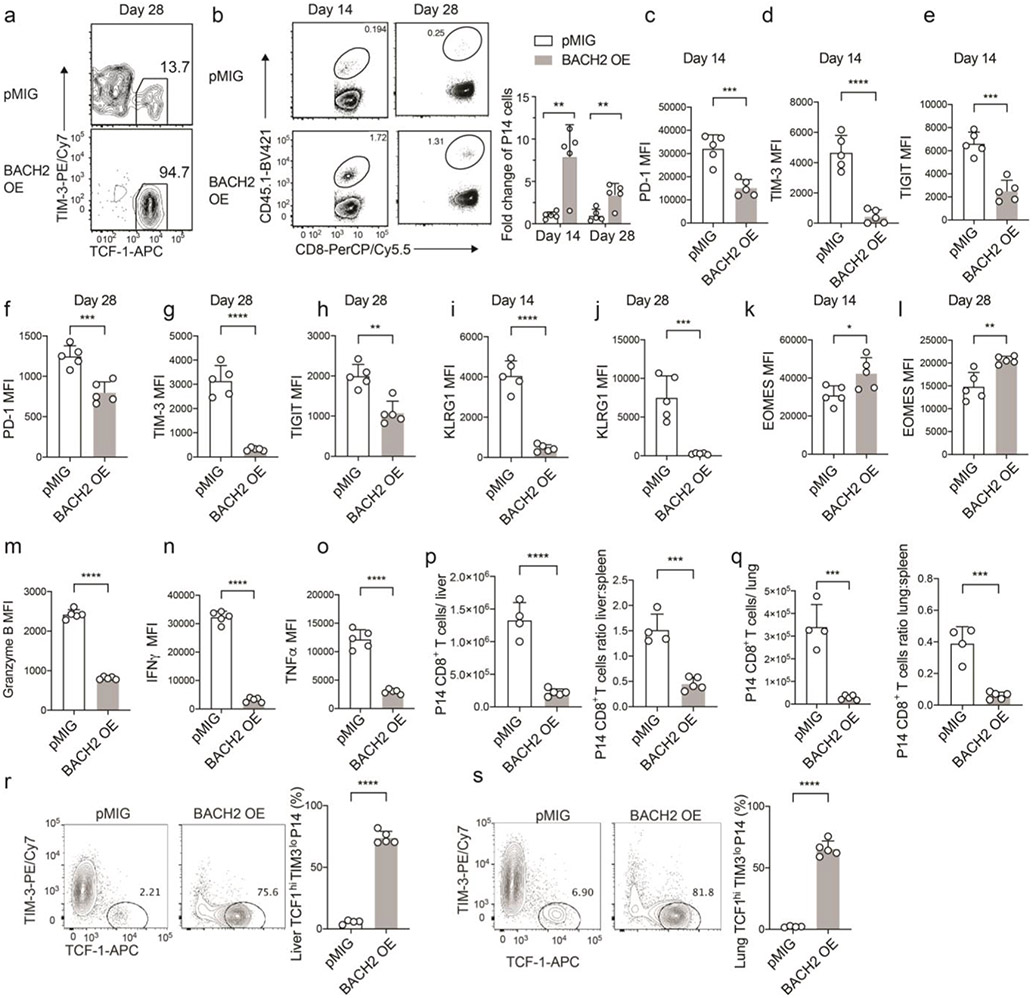
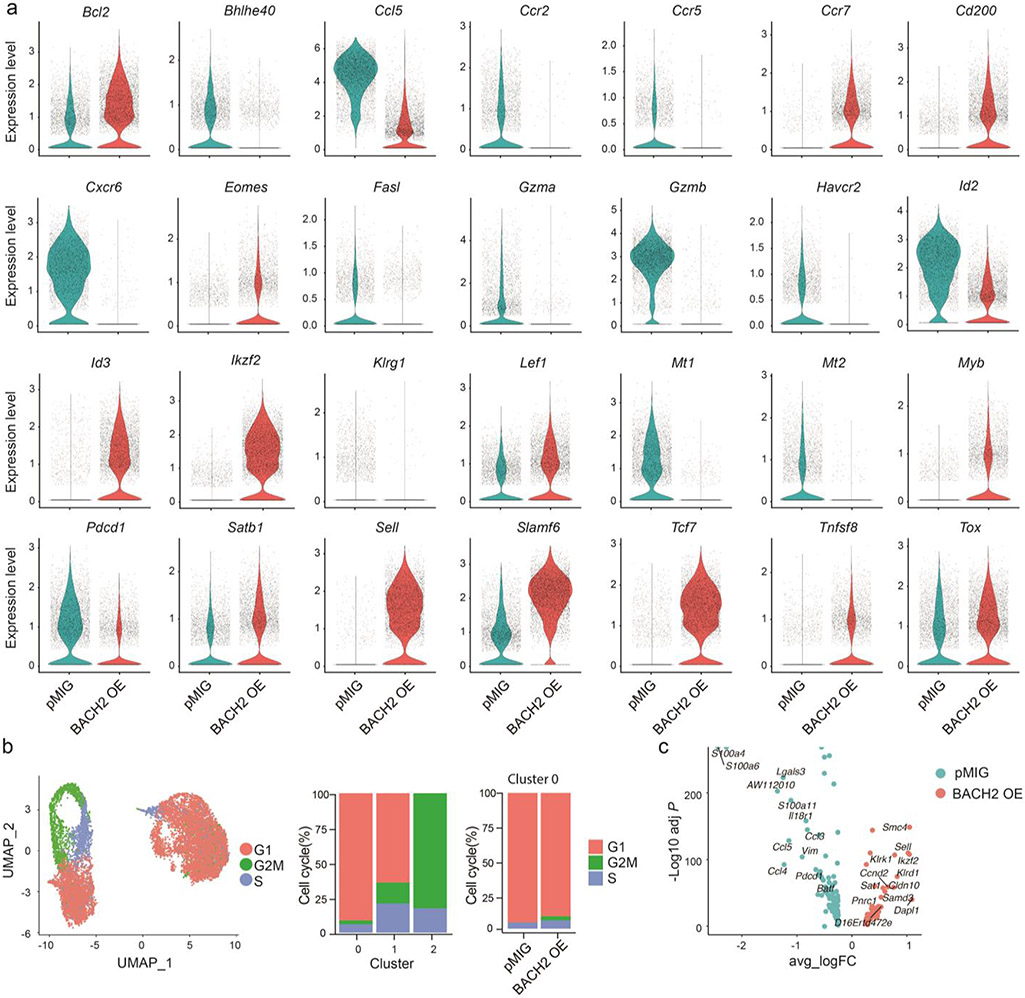
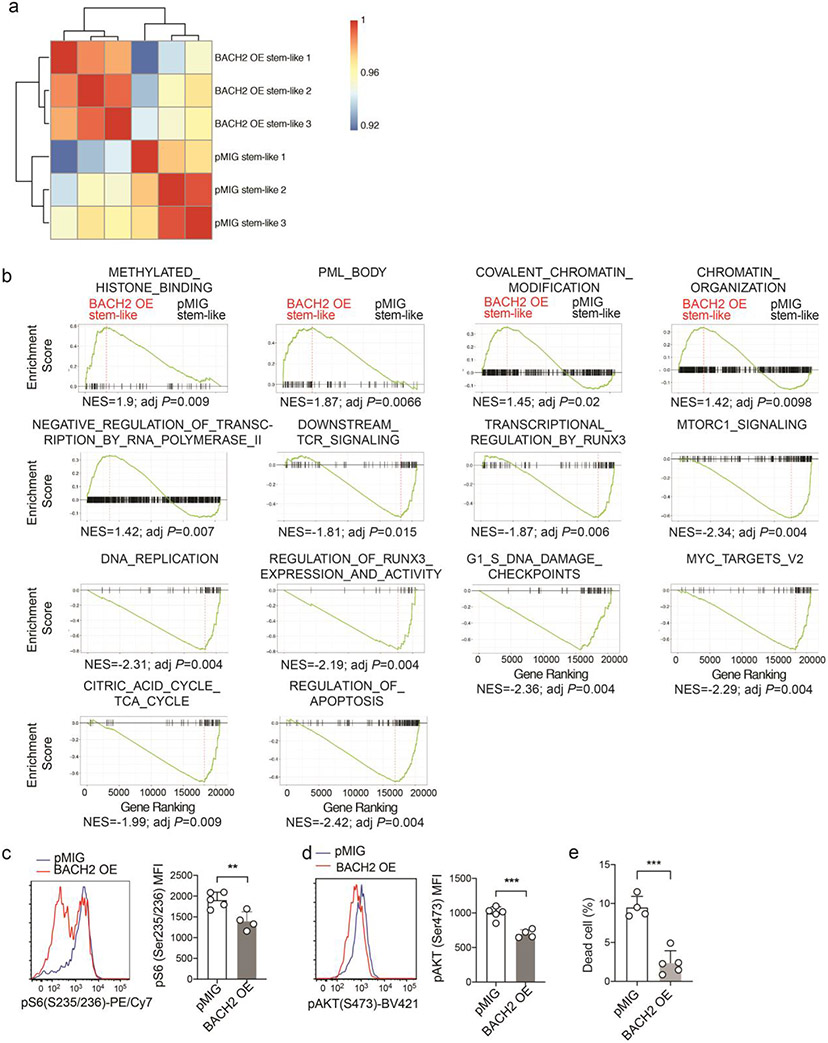
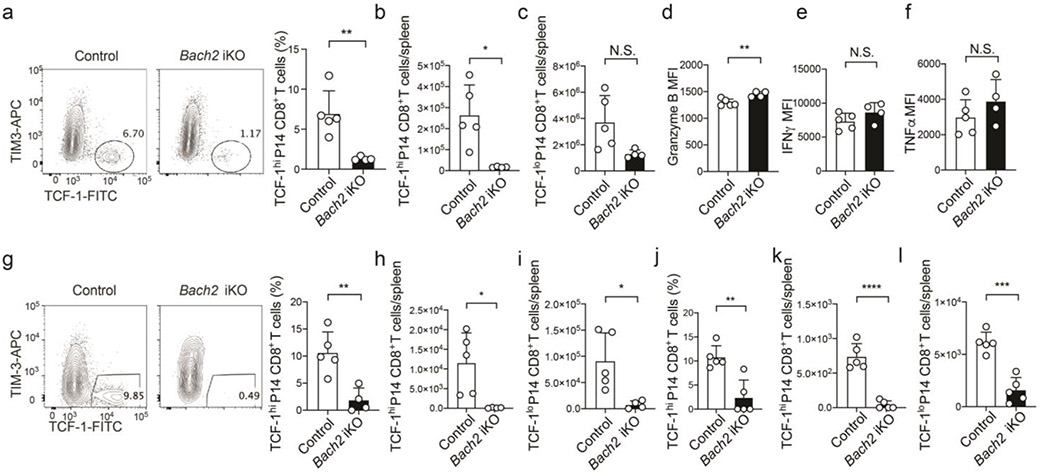
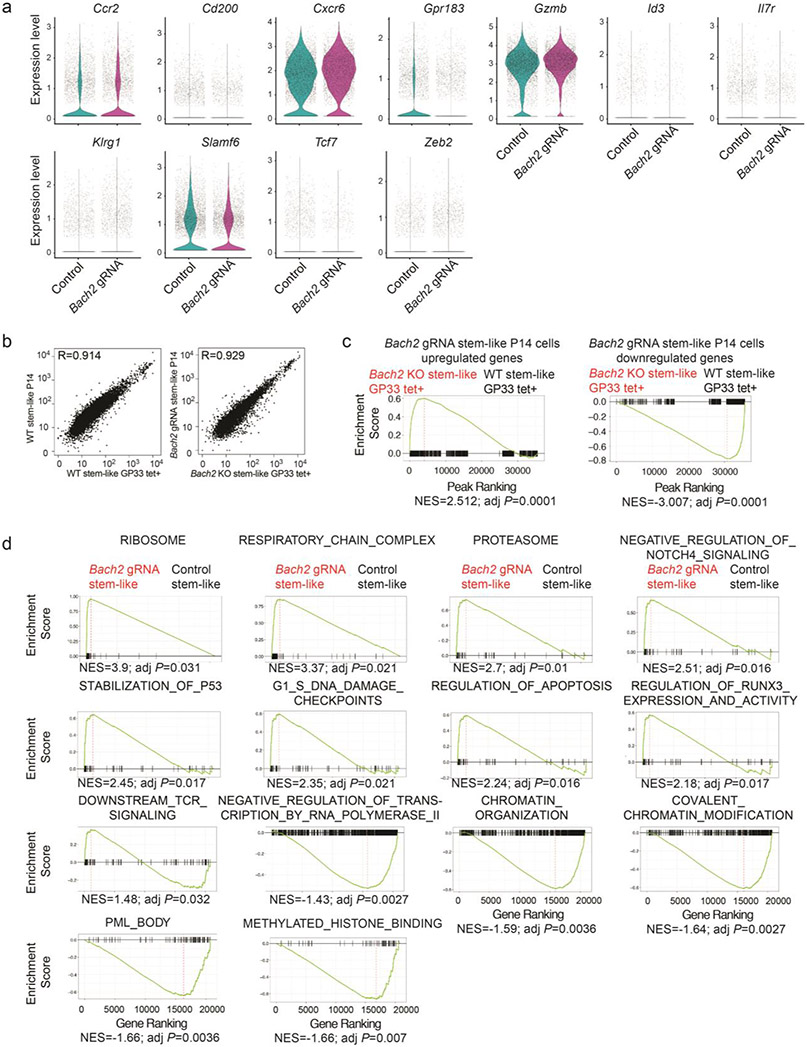
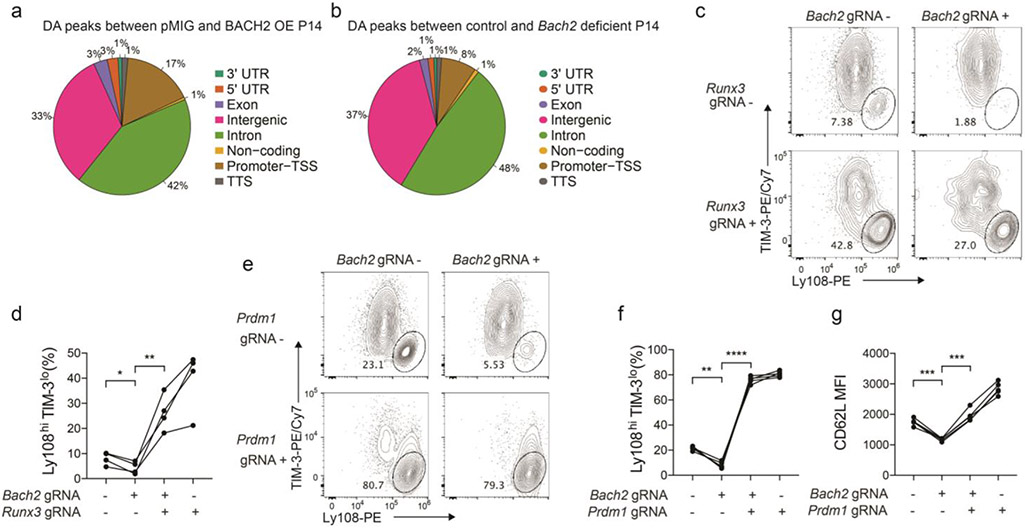
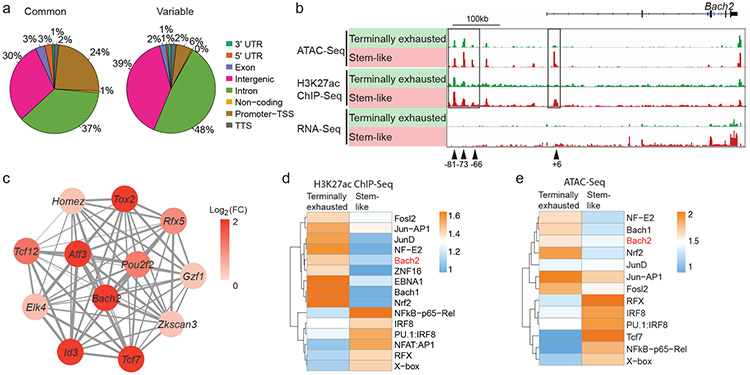
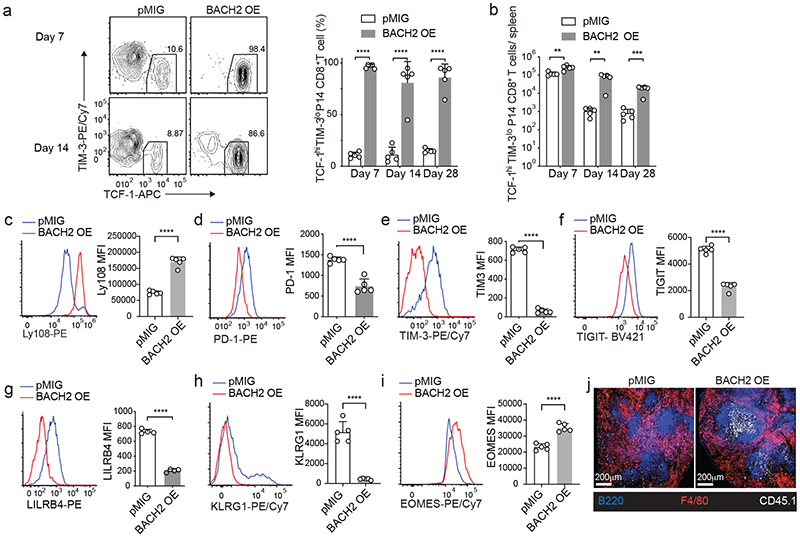
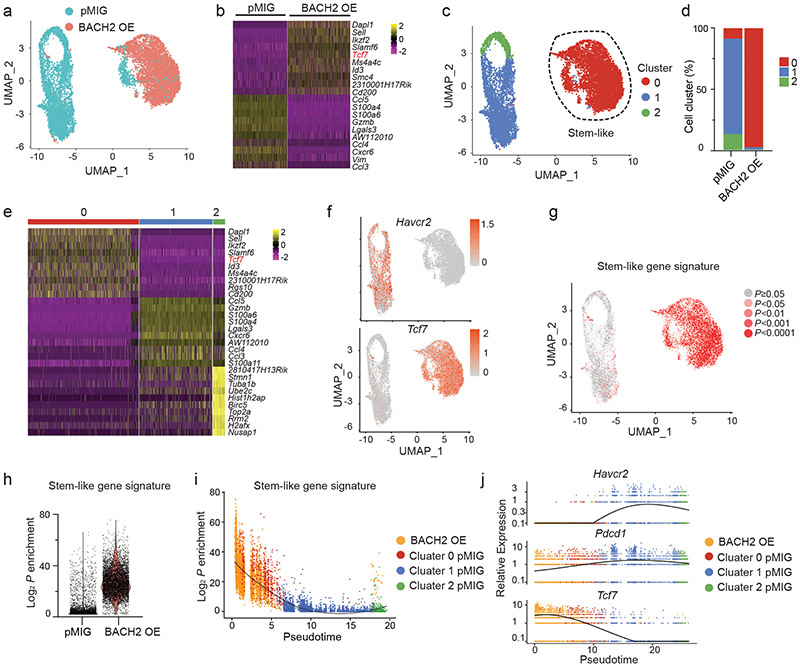
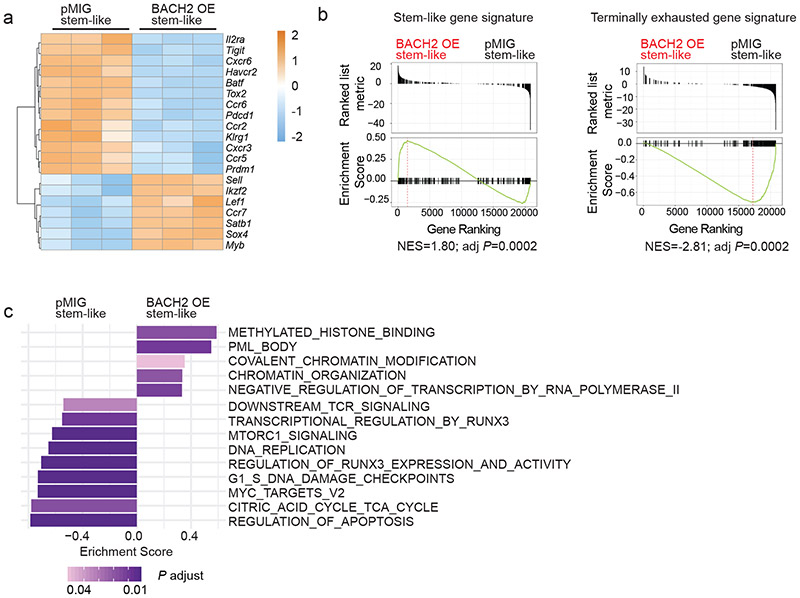
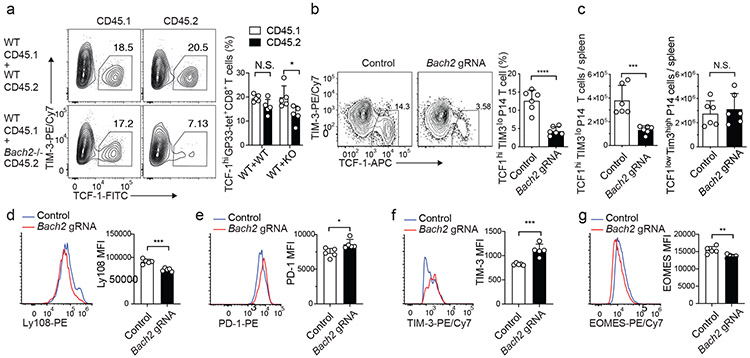
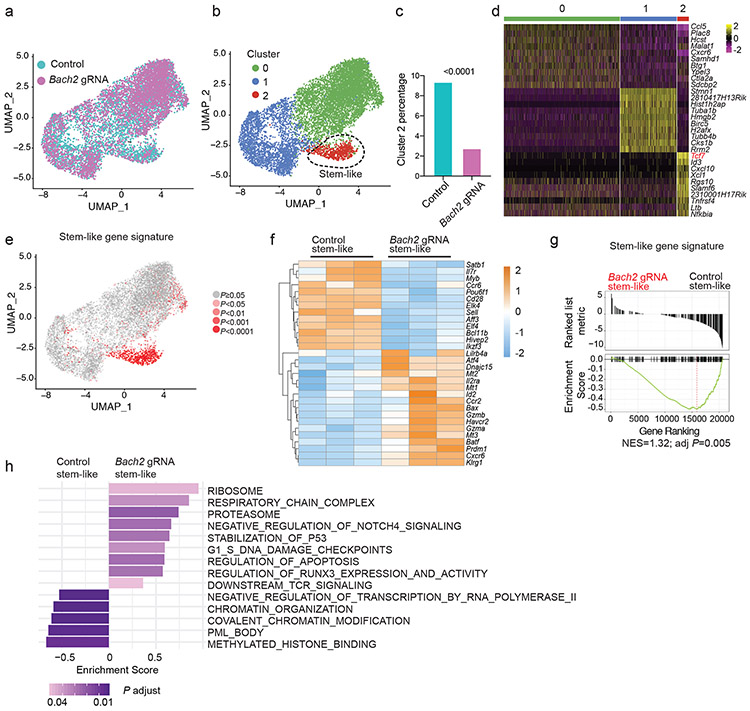
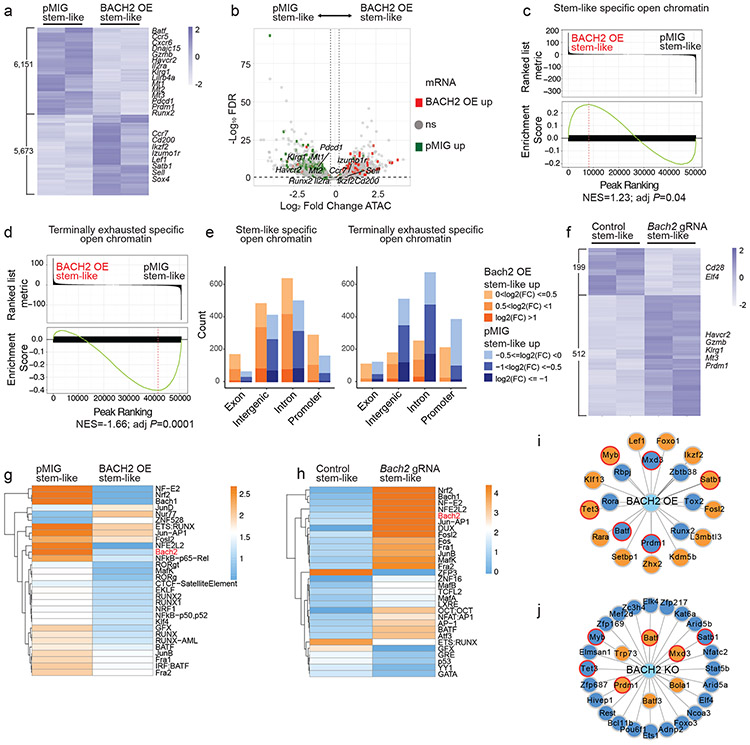
During chronic infection and cancer, a self-renewing CD8+ T cell subset maintains long-term immunity and is critical to the effectiveness of immunotherapy. These stem-like CD8+ T cells diverge from other CD8+ subsets early after chronic viral infection. However, pathways guarding stem-like CD8+ T cells against terminal exhaustion remain unclear. Here, we show that the gene encoding transcriptional repressor BACH2 is transcriptionally and epigenetically active in stem-like CD8+ T cells but not terminally exhausted cells early after infection. BACH2 overexpression enforced stem-like cell fate, whereas BACH2 deficiency impaired stem-like CD8+ T cell differentiation. Single-cell transcriptomic and epigenomic approaches revealed that BACH2 established the transcriptional and epigenetic programs of stem-like CD8+ T cells. In addition, BACH2 suppressed the molecular program driving terminal exhaustion through transcriptional repression and epigenetic silencing. Thus, our study reveals a new pathway that enforces commitment to stem-like CD8+ lineage and prevents an alternative terminally exhausted cell fate.


Figures

Extended Data Figure 1
Extended Data Figure 1. Stem-like and terminally exhausted CD8+ T cells exhibited distinct open chromatin landscapes.
a, Experimental setup has been described in Fig. 1a. Gating strategy for sorting stem-like (Ly108hiTIM-3lo) and terminally exhausted (Ly108loTIM-3hi) P14 cells on day 7 p.i.. b, Venn diagram illustrating the numbers of ATAC-Seq peaks in stem-like and terminally exhausted CD8+ T cells. c, Percentages of common and variable ATAC-Seq peaks, as defined in Extended Data Fig.1b, annotated to Intergenic, Intronic, and Promoter-TSS regions. Filled bars represent common peaks; unfilled bars represent variable peaks. P values were determined by the Chi-squared test. d, Volcano plots of differentially accessible chromatin regions between stem-like and terminally exhausted CD8+ T cells are shown. The x axis represents log2 fold change of chromatin accessibility; the y axis represents −log10FDR. The horizontal dash line indicates FDR=0.1; vertical dash lines indicate fold change of +/− 1.2. Dots represent peaks associated with significantly upregulated genes (fold change >1.5, FDR <0.05) in stem-like (red) or terminally exhausted (green) CD8+ T cells, and non-significantly regulated genes (grey). FDR is calculated by edgeR. ATAC-Seq data include n=2 independent experiments per group. e, The transcript abundance of Bach2 and Prdm1 in stem-like and terminally exhausted P14 CD8+ T cells harvested on day 7 (left, n=2 independent samples) and day 20 (right, n=3 independent samples) after LCMV clone 13 infection are shown in bar graphs. FDR was determined using edgeR. f, Cas9; P14 CD8+ T cells transduced with control or Prdm1 gRNA constructs were adoptively transferred into C57BL/6 mice that were subsequently infected with LCMV clone 13. Splenic P14 cells were analyzed on day 7 p.i.. The protein expression of BACH2 in control or Prdm1 gRNA transduced P14 CD8+ T cells are shown in representative FACS plot (left) and bar graph (right). g. A Venn diagram shows transcription factors (TFs) upregulated in stem-like compared to terminally exhausted CD8+ T cells (red) and TFs with motif enriched in the differentially accessible chromatin regions between stem-like and terminally exhausted CD8+ T cells (blue). Statistical significance in f was calculated with a two-sided Student’s t-test. ****P < 0.0001.
Extended Data Figure 2
Extended Data Figure 2. BACH2 overexpression enhances stem-like CD8+ T cell differentiation during chronic LCMV infection.
a, Representative FACS plots of TCF-1 and TIM-3 expression in pMIG and BACH2 OE P14 CD8+ T cells on day 28 p.i. b, Left panel: representative FACS plots of pMIG and BACH2 OE P14 cells in CD8+ T cells on day 14 and day 28 p.i.. Right panel: fold changes in the numbers of BACH2 OE P14 cells relative to the numbers of pMIG P14 cells on day 14 and day 28 p.i.. n=5 mice/group. c-e, FACS analyses of PD-1 (c, n=5 mice/group), TIM-3 (d, n=5 mice/group), TIGIT (e, n=5 mice/group) expression in pMIG and BACH2 OE P14 CD8+ T cells on day 14 p.i.. f-h, FACS analyses of PD-1 (f, n=5 mice/group), TIM-3 (g, n=5 mice/group), TIGIT (h, n=5 mice/group) expression in pMIG and BACH2 OE P14 CD8+ T cells on day 28 p.i.. i,j, FACS analyses of KLRG1 expression in pMIG and BACH2 OE P14 CD8+ T cells on day 14 (i, n=5 mice/group) and day 28 (j, n=5 mice/group) p.i.. k,l, FACS analyses of EOMES expression in pMIG and BACH2 OE P14 CD8+ T cells on day 14 (k, n=5 mice/group) and day 28 (l, n=5 mice/group) p.i.. m-o, FACS analyses of granzyme B (m, n=5 mice/group), IFNγ (n, n=5 mice/group), TNFα (o, n=5 mice/group) expression in pMIG and BACH2 OE P14 CD8+ T cells on day 7 p.i.. p, Numbers of pMIG (n=4 mice) and BACH2 OE (n=5 mice) P14 CD8+ T cells in the liver (left) and the ratio of P14 cells in the liver versus P14 cells in the spleen in pMIG (n=4 mice) and BACH2 OE (n=5 mice) groups (right) on day 7 p.i.. q, Numbers of pMIG (n=4 mice) and BACH2 OE (n=5 mice) P14 CD8+ T cells in the lung (left) and the ratio of P14 cells in the lung versus P14 cells in spleen in pMIG (n=4 mice) and BACH2 OE (n=5 mice) groups (right) on day 7 p.i.. r,s, Representative FACS plots (left) and bar graph (right) showing the percentage of stem-like (TCF-1hiTIM-3lo) pMIG (n=4 mice) and BACH2 OE (n=5 mice) P14 CD8+ T cells in the liver (r) and lung (s). Data are representative of at least two independent experiments. Circles represent individual mice. Bar graphs represent mean±s.d.. Statistical significance was calculated with a two-sided Student’s t-test. *P < 0.05, **P < 0.01, ***P < 0.001, ****P < 0.0001
Extended Data Figure 3
Extended Data Figure 3. ScRNA-Seq analyses of pMIG and BACH2 OE P14 cells.
a, Violin plots illustrating the mRNA amounts of differentially expressed genes between pMIG (iris blue) and BACH2 OE (red) P14 cells on day 7 p.i.. b, Left panel: UMAP projection of P14 cells colored by cell-cycle phases (G1: red; S: blue; G2/M: green). Middle panel: percentages of cells in different cell-cycle phases from each cluster defined in Fig. 3c. Right panel: percentages of cells in cluster 0 pMIG P14 cells or cluster 0 BACH2 OE P14 cells that are in different cell-cycle phases. c, Volcano plots showing differentially expressed genes between cluster 0 pMIG P14 cells and cluster 0 BACH2 OE P14 cells.
Extended Data Figure 4
Extended Data Figure 4. RNA-Seq analyses of pMIG and BACH2 OE stem-like P14 CD8+ T cells.
a, Correlation heatmap of RNA-Seq data from independent samples (n=3/group) of pMIG and BACH2 OE stem-like (Ly108hiTIM-3lo) P14 cells in Fig. 4a. b, Significantly enriched pathways in Fig. 4c determined by GSEA. c,d, FACS analyses of phospho-ribosomal protein S6 (c) and phospho-AKT (d) in pMIG (n=5 mice) and BACH2 OE (n=4 mice) P14 cells on day 7 p.i.. e, Percentages of dead (Annexin V+ Aqua Live/Dead+) cells among pMIG (n=4 mice) and BACH2 OE (n=5 mice) P14 cells on day 7 p.i.. Data in c-e are representative of at least two independent experiments. Circles represent individual mice. Bar graphs represent mean±s.d.. Statistical significance in c-e was calculated with a two-sided Student’s t-test. **P < 0.01, ***P < 0.001.
Extended Data Figure 5
Extended Data Figure 5. BACH2 deficiency impairs the differentiation of stem-like CD8+ T cells and persistence of antiviral CD8+ T cells during chronic LCMV infection.
Bach2loxP/loxP; Cre/ERT2 CD8+ T cells were transduced with P14 TCR and adoptively transferred to B6 CD45.1 mice. Recipients were treated with vehicle (control) or tamoxifen (Bach2 iKO) and infected with LCMV clone 13. a-f, Splenocytes were analyzed on day 7 post-infection. a, Representative FACS plots (left) and bar graph (right) showing the percentage of stem-like (TCF-1hiTIM-3lo) control (n=5 mice) and Bach2 iKO (n=4 mice) P14 cells. b,c, Numbers of stem-like (TCF-1hi) (b) and terminally exhausted (TCF-1lo) (c) control (n=5 mice) and Bach2 iKO (n=4 mice) P14 cells. d-f, FACS analysis of granzyme B (d), IFNγ (e), TNFα (f) in control (n=5 mice) and Bach2 iKO (n=4 mice) P14 cells. g-i, Splenocytes were analyzed two-week post-infection. g, Representative FACS plots (left) and bar graph (right) showing the percentage of stem-like (TCF-1hiTIM-3lo) control (n=5 mice) and Bach2 iKO (n=4 mice) P14 cells. h,i, Numbers of stem-like (TCF-1hi) (h) and terminally exhausted (TCF-1lo) (i) control (n=5 mice) and Bach2 iKO (n=4 mice) P14 cells. j-l, Splenocytes were analyzed one-month post-infection. j, Bar graph showing the percentage of stem-like control (n=5 mice) and Bach2 iKO (n=5 mice) P14 cells. k,l, Numbers of stem-like (k) and terminally exhausted (l) control (n=5 mice) and Bach2 iKO (n=5 mice) P14 cells. Data are representative of at least two independent experiments. Circles represent individual mice. Bar graphs represent mean±s.d.. Statistical significance was calculated with a two-sided Student’s t-test. *P < 0.05, **P < 0.01, ***P < 0.001, ****P < 0.0001.
Extended Data Figure 6
Extended Data Figure 6. Transcriptome analysis of control and Bach2 gRNA transduced P14 cells.
a, Violin plots illustrating the mRNA amounts of differentially expressed genes between control (iris blue) and Bach2 gRNA (purple) transduced P14 cells on day 7 p.i.. Each dot represents one cell. b, Correlation between WT GP33 tetramer+ stem-like CD8+ T cells and control stem-like P14 CD8+ T cells (left) or between Bach2 KO GP33 tetramer+ stem-like CD8+ T cells and Bach2 gRNA stem-like P14 CD8+ T cells (right). 3 independent samples per condition. c, GSEA of RNA-Seq data from WT and Bach2 KO GP33 tetramer+ stem-like CD8+ T cells shows the enrichment of gene sets containing genes upregulated (left) or downregulated (right) in Bach2 gRNA transduced stem-like P14 cells relative to control stem-like P14 cells. d, Significantly enriched pathways in Fig. 6h determined by GSEA.
Extended Data Figure 7
Extended Data Figure 7. The molecular program downstream of BACH2.
a, Experimental setup has been described in Fig. 7a. A pie chart illustrates the genomic distribution of differentially accessible (DA) regions between pMIG and BACH2 OE stem-like P14 cells. b, Experimental setup has been described in Fig. 7f. A pie chart illustrates the genomic distribution of DA regions between control and Bach2 gRNA transduced stem-like P14 cells. c,d, Cas9; P14 CD8+ T cells co-transduced with pMKO GFP vector expressing Bach2 gRNA and SL21 VEX vector expressing Runx3 gRNA were adoptively transferred into C57BL/6 mice that were subsequently infected with LCMV clone 13 (n=4 mice). Splenic P14 cells were analyzed on day 7 p.i.. c, Representative FACS plots of Ly108 and TIM-3 expression on GFPVEX, GFP+VEX, GFPVEX+, and GFP+VEX+ P14 CD8+ T cells. d, Percentage of stem-like (Ly108hiTIM-3lo) cells within GFPVEX, GFP+VEX, GFPVEX+, and GFP+VEX+ P14 CD8+ T cells. e-g, Cas9; P14 CD8+ T cells co-transduced with pMKO GFP vector expressing Bach2 gRNA and SL21 VEX vector expressing Prdm1 gRNA were adoptively transferred into C57BL/6 mice that were then infected with LCMV clone 13 (n=5 mice). Splenic P14 cells were analyzed on day 7 p.i.. Representative FACS plots of Ly108 and TIM-3 expression on GFPVEX, GFP+VEX, GFPVEX+, and GFP+VEX+ P14 CD8+ T cells (e) and percentage of stem-like (Ly108hiTIM-3lo) cells within GFPVEX, GFP+VEX, GFPVEX+, and GFP+VEX+ P14 cells (f) are shown. g, CD62L expression on GFPVEX, GFP+VEX, GFPVEX+, and GFP+VEX+ P14 cells. Data in c-g are representative of at least two independent experiments. Circles represent individual mice. Lines in d,f,g connect data points from the same individual mice. Statistical significance in d,f,g was calculated with a two-sided Student’s paired t-test. *P < 0.05, **P < 0.01, ***P < 0.001, ****P < 0.0001.
Fig.1 ∣
Fig.1 ∣. Bach2 locus is epigenetically and transcriptionally active in stem-like CD8+ T cells.
a, C57BL/6 mice received naïve P14 CD8+ T cells and were then infected with LCMV clone 13. ATAC-Seq were performed with stem-like (Ly108hiTIM-3lo) and terminally exhausted (Ly108loTIM-3hi) P14 cells isolated from mice on day 7 p.i.. Pie charts demonstrating the distribution of ATAC-Seq peaks that are shared between stem-like and terminally exhausted CD8+ T cells (common) or specific to one of the CD8+ subsets (variable) across the genome (three prime untranslated region [3’ UTR], five prime untranslated region [5’ UTR], exon, intergenic, intron, non-coding, promoter-transcription start sites [TSS], and transcription termination site [TTS]). ATAC-Seq data include n=2 independent samples per group. b, Genomic tracks of mapped ATAC-Seq, H3K27ac ChIP-Seq, and RNA-Seq reads at Bach2 locus in stem-like (red) and terminally exhausted (green) CD8+ T cells. c, Correlation network analysis of transcription factors (TFs) in the co-expression gene module containing Tcf7 identified by WGCNA of scRNA-Seq data from P14 CD8+ T cells after LCMV infection. The thickness of lines represents correlation. Log2 fold change of mRNA between stem-like and terminally exhausted CD8+ T cells are color-coded. d,e, Heatmaps illustrate enrichment of TF motifs in differential H3K27ac peaks (d) and ATAC-Seq peaks (e) between stem-like and terminally exhausted CD8+ T cells. Differential peaks were determined by edgeR (fold change >1.2, FDR <0.1).
Fig.2 ∣
Fig.2 ∣. BACH2 overexpression promotes stem-like CD8+ differentiation and inhibits exhaustion.
P14 CD8+ T cells transduced with control MSCV-IRES-GFP (pMIG) or BACH2 overexpression (BACH2 OE) construct were adoptively transferred into C57BL/6 mice that were subsequently infected with LCMV clone 13. a, Left panel: representative FACS plots of stem-like (TCF-1hiTIM-3lo) CD8+ T cells within pMIG and BACH2 OE P14 cells on day 7 and day 14 p.i.. Right panel: frequencies of stem-like CD8+ T cells in pMIG and BACH2 OE P14 cells on day 7 (n=5), day 14 (n=5) and day 28 (n=5) p.i.. b, Numbers of stem-like (TCF-1hiTIM-3lo) pMIG and BACH2 OE P14 CD8+ T cells on day 7 (n=5), day 14 (n=5) and day 28 (n=5) p.i.. c-i FACS analyses of Ly108 (c, n=5), PD-1 (d, n=5), TIM-3 (e, n=5), TIGIT (f, n=5), LILRB4 (g, n=4), KLRG1(h, n=5), and EOMES (i, n=5) expression in pMIG and BACH2 OE P14 CD8+ T cells on day 7 p.i.. j, Localization of pMIG and BACH2 OE P14 cells (CD45.1+) in the spleen of LCMV clone 13-infected mice on day 7 p.i.. Data are representative of at least two independent experiments. n equals the number of mice per group. Each circle represents one mouse. Bar graphs represent mean±s.d.. Statistical significance was calculated with a two-sided Student’s t-test. **P < 0.01, ***P < 0.001, ****P < 0.0001.
Fig.3 ∣
Fig.3 ∣. BACH2 establishes a stem-like transcriptional program at the single-cell level.
Experimental setup is the same as in Fig. 2. ScRNA-Seq was performed with splenic P14 CD8+ T cells collected on day 7 p.i.. a, UMAP projection of pMIG (iris blue, n=5,312) and BACH2 OE (Salmon, n=6,172) P14 cells. Each dot represents one cell. b, A heatmap of the top 10 genes expressed in pMIG and BACH2 OE P14 cells. Each column represents a cell; each row represents a gene. Color represents Z-score distribution from −2 (purple) to 2 (yellow). c, Unsupervised clustering identified three subsets (clusters 0-2) of P14 cells from Fig. 3a shown in a UMAP projection. d, Percentages of cells in each cluster defined in Fig. 3c in pMIG and BACH2 OE P14 CD8+ T cells. e, A heatmap of the top 10 genes expressed in each cluster defined in Fig. 3c. f, Single-cell expression of Tcf7 and Havcr2 illustrated in UMAP plots. Color represents transcript abundance (gray: no expression; red: expressed). g,h, Feature plot (g) and violin plot (h) illustrating enrichment (log2 P values) of stem-like gene signature in each cell. P values were calculated by a one-sided Fisher’s exact test. i, Enrichment (log2 P values) of stem-like gene signature in pMIG P14 CD8+ T cells in clusters 0 (red), 1 (blue), and 2 (green) as well as all BACH2 OE P14 CD8+ T cells (orange) plotted against pseudo-time determined by Monocle 2. Each dot represents one cell. The black line represents the spline. j, Single-cell expression of Havcr2, Pdcd1, and Tcf7 projected against pseudo-time. Cells were color-coded as in Fig.3i.
Fig.4 ∣
Fig.4 ∣. BACH2 overexpression alters the expression of genes and pathways in stem-like CD8+ T cells.
Experimental setup is the same as in Fig. 2. RNA-Seq was performed with pMIG (n=3 independent samples) and BACH2 OE (n=3 independent samples) stem-like (Ly108hiTIM-3lo) P14 CD8+ T cells collected from mice on day 7 after LCMV clone 13 infection. a, A heatmap of representative differentially expressed genes (fold change >1.5, FDR < 0.05) between pMIG and BACH2 OE stem-like P14 cells. Each column represents an independent sample. The color scale is based on z-score distribution. FDR was calculated by edgeR. b, Gene set enrichment analysis (GSEA) illustrating the enrichment of stem-like (left) and terminally exhausted (right) gene signatures in BACH2 OE versus pMIG stem-like P14 CD8+ T cells. NES, normalized enrichment score; adj P, adjusted P value. c, GSEA by clusterProfiler illustrates gene sets upregulated or downregulated in BACH2 OE versus pMIG stem-like P14 cells.
Fig.5 ∣
Fig.5 ∣. BACH2 deficiency impairs the differentiation of stem-like CD8+ T cells.
a, Mixed bone marrow chimeric mice reconstituted with wild-type CD45.2 and wild-type CD45.1 (WT+WT) or Bach2−/− CD45.2 and wild-type CD45.1 bone marrows (WT+KO) were infected with LCMV clone 13 and analyzed on day 10 p.i.. Frequencies of stem-like (TCF-1hiTIM-3lo) cells within H-2Db GP33 tetramer+ CD45.1 and CD45.2 CD8+ T cells in chimeras are shown in FACS plots (left) and summary bar graph (right, n=5). b-g, Cas9; P14 CD8+ T cells transduced with control or Bach2 gRNA constructs were adoptively transferred into C57BL/6 mice that were subsequently infected with LCMV clone 13. Splenic P14 cells were analyzed on day 7 p.i.. b, Frequencies of stem-like (TCF-1hiTIM-3lo) cells within control or Bach2 gRNA transduced P14 CD8+ T cells are shown in FACS plots (left) and summary bar graph (right, n=6). c, Numbers of control or Bach2 gRNA transduced stem-like (TCF-1hiTIM-3lo, left panel) or terminally exhausted (TCF-1loTIM-3hi, right panel) P14 CD8+ T cells (n=6). d-g, FACS analyses of Ly108 (d, n=5), PD-1 (e, n=5), TIM-3 (f, n=5), and EOMES (g, n=5) expression in control and Bach2 gRNA transduced stem-like P14 CD8+ T cells on day 7 p.i.. n equals the number of mice per group. Each circle represents one mouse. Bar graphs represent mean±s.d.. Data are representative of at least two independent experiments. In a, statistical significance was determined with a two-sided paired Student’s t-test. In b-g, statistical significance was determined with a two-sided unpaired Student’s t-test. *P < 0.05, **P < 0.01, ***P < 0.001, ****P < 0.0001.
Fig.6 ∣
Fig.6 ∣. BACH2 is required for the transcriptional program of stem-like CD8+ T cells.
Experimental setup is the same as in Fig. 5b. a-e, scRNA-Seq was performed with control and Bach2 gRNA transduced P14 CD8+ T cells on day 7 p.i.. a, UMAP projection of control (iris blue, n=5,457) and Bach2 gRNA (Magenta, n=4,579) transduced P14 CD8+ T cells. Each dot represents one cell. b, Unsupervised clustering identified three subsets (clusters 0-2) of P14 CD8+ T cells. c, Percentages of cells in cluster 2 in control and Bach2 gRNA transduced P14 cells. Statistical significance was determined by one-sided Chi-squared test. ****P < 0.0001. d, A heatmap of the top 10 genes expressed in each cluster defined in Fig. 6b. e, Feature plot illustrating enrichment (log2 P values) of stem-like gene signature in each cell. Each dot represents one cell. P values were determined by a one-sided Fisher’s exact test. f-h, RNA-Seq was performed with stem-like (Ly108hiTIM-3lo) control (n=3 independent samples) and Bach2 gRNA (n=3 independent samples) transduced P14 CD8+ T cells on day 7 p.i.. f, A heatmap of representative differentially expressed genes (fold change >1.5, FDR < 0.05) between control and Bach2 gRNA transduced stem-like P14 cells. Each column represents an independent sample. The color scale is based on z-score distribution. FDR is determined by edgeR. g, Enrichment of stem-like gene signature in BACH2-deficient versus control stem-like P14 CD8+ T cells determined by GSEA. NES, normalized enrichment score; adj P, adjusted P value. h, GSEA by clusterProfiler illustrating gene sets upregulated or downregulated in Bach2 gRNA transduced stem-like P14 cells relative to controls.
Fig.7 ∣
Fig.7 ∣. BACH2 regulates the epigenetic program of antiviral CD8+ T cells.
a-e, ATAC-Seq analysis of pMIG (n=2 independent samples) and BACH2 OE (n=2 independent samples) stem-like (Ly108hiTIM-3lo) P14 CD8+ T cells on day 7 after LCMV clone 13 infection. a, A heatmap showing differentially accessible chromatin regions (fold change >1.2, FDR < 0.1) between pMIG and BACH2 OE stem-like P14 T cells. Each column represents an independent sample. The color scale is based on z-score distribution. b, A volcano plot illustrating differentially accessible chromatin regions between pMIG and BACH2 OE stem-like P14 T cells. Each symbol represents a peak. Squares represent peaks associated with genes upregulated in pMIG (green) or BACH2 OE (red) stem-like P14 T cells. Grey dots represent peaks associated with genes that are not differentially expressed. c,d, Enrichment of open chromatin region signature associated with stem-like (c) or terminally exhausted (d) CD8+ T cells in BACH2 OE versus pMIG stem-like P14 T cells were determined by GSEA. NES, normalized enrichment score; adj P, adjusted P value. e, Numbers of stem-like (left) or terminally exhausted (right) specific open chromatin regions that were more accessible in BACH2 OE (orange) or pMIG (blue) stem-like P14 cells in indicated genomic features. f, A heatmap showing differentially accessible chromatin regions (fold change >1.2, FDR < 0.1) between control (n=2 independent samples) and Bach2 gRNA (n=2 independent samples) transduced stem-like P14 T cells. g,h, Heatmaps illustrate enrichment of TF motifs in differential chromatin accessibility regions between pMIG and BACH2 OE stem-like P14 T cells (g), and between control and Bach2 gRNA transduced stem-like P14 T cells (h). i,j, Bach2-centered network analysis of TFs that were differentially expressed between pMIG and BACH2 OE stem-like P14 cells as defined in Fig. 4a (i), or between control and Bach2 gRNA transduced stem-like P14 cells as defined in Fig. 6f (j). At least one BACH2 motif is present in the open chromatin regions of genes encoding these TFs. Filled color indicates upregulation (orange) or downregulation (dark blue) in BACH2 OE (i) or Bach2 gRNA (j) transduced stem-like P14 cells. Red border color highlights TFs showing consistent results in both BACH2 OE (i) and Bach2 knockout (j) experiments.

Comment in

Similar articles

Cited by

References

    1. Hashimoto M et al. CD8 T Cell Exhaustion in Chronic Infection and Cancer: Opportunities for Interventions. Annu Rev Med 69, 301–318 (2018). - PubMed
    1. McLane LM, Abdel-Hakeem MS & Wherry EJ CD8 T Cell Exhaustion During Chronic Viral Infection and Cancer. Annu Rev Immunol 37, 457–495 (2019). - PubMed
    1. Wu T et al. The TCF1-Bcl6 axis counteracts type I interferon to repress exhaustion and maintain T cell stemness. Sci Immunol 1, eaai8593 (2016). - PMC - PubMed
    1. Im SJ et al. Defining CD8+ T cells that provide the proliferative burst after PD-1 therapy. Nature 537, 417–421 (2016). - PMC - PubMed
    1. Leong YA et al. CXCR5(+) follicular cytotoxic T cells control viral infection in B cell follicles. Nat Immunol 17, 1187–1196 (2016). - PubMed

Methods-only References

    1. Pircher H, Burki K, Lang R, Hengartner H & Zinkernagel RM Tolerance induction in double specific T-cell receptor transgenic mice varies with antigen. Nature 342, 559–561 (1989). - PubMed
    1. Kometani K et al. Repression of the transcription factor Bach2 contributes to predisposition of IgG1 memory B cells toward plasma cell differentiation. Immunity 39, 136–147 (2013). - PubMed
    1. Wu T et al. TCF1 Is Required for the T Follicular Helper Cell Response to Viral Infection. Cell Rep 12, 2099–2110 (2015). - PMC - PubMed
    1. Ji Y et al. miR-155 harnesses Phf19 to potentiate cancer immunotherapy through epigenetic reprogramming of CD8(+) T cell fate. Nat Commun 10, 2157 (2019). - PMC - PubMed
    1. Leisegang M et al. Enhanced functionality of T cell receptor-redirected T cells is defined by the transgene cassette. J Mol Med (Berl) 86, 573–583 (2008). - PubMed

Publication types

MeSH terms

Substances