. 2021 Jan 26:11:620843.
doi: 10.3389/fmicb.2020.620843. eCollection 2020.

Comparative Virulence and Genomic Analysis of Streptococcus suis Isolates

Affiliations

Comparative Virulence and Genomic Analysis of Streptococcus suis Isolates

Tracy L Nicholson et al. Front Microbiol. .

Abstract

Streptococcus suis is a zoonotic bacterial swine pathogen causing substantial economic and health burdens to the pork industry. Mechanisms used by S. suis to colonize and cause disease remain unknown and vaccines and/or intervention strategies currently do not exist. Studies addressing virulence mechanisms used by S. suis have been complicated because different isolates can cause a spectrum of disease outcomes ranging from lethal systemic disease to asymptomatic carriage. The objectives of this study were to evaluate the virulence capacity of nine United States S. suis isolates following intranasal challenge in swine and then perform comparative genomic analyses to identify genomic attributes associated with swine-virulent phenotypes. No correlation was found between the capacity to cause disease in swine and the functional characteristics of genome size, serotype, sequence type (ST), or in vitro virulence-associated phenotypes. A search for orthologs found in highly virulent isolates and not found in non-virulent isolates revealed numerous predicted protein coding sequences specific to each category. While none of these predicted protein coding sequences have been previously characterized as potential virulence factors, this analysis does provide a reliable one-to-one assignment of specific genes of interest that could prove useful in future allelic replacement and/or functional genomic studies. Collectively, this report provides a framework for future allelic replacement and/or functional genomic studies investigating genetic characteristics underlying the spectrum of disease outcomes caused by S. suis isolates.

Keywords: Streptococcus suis; antimicrobial resistance; comparative genomics; mobile genetic elements; swine; virulence; whole-genome sequencing.


Conflict of interest statement

The authors declare that the research was conducted in the absence of any commercial or financial relationships that could be construed as a potential conflict of interest.

Figures

FIGURE 1
FIGURE 1
Survival rates of pigs post intranasal challenge. On day 0 groups of 4-5, 8-week-old CDCD pigs were intranasally inoculated with 2 mL (1 mL per nostril) of approximately 1 × 10⁹ CFU/mL of each S. suis isolate. The x-axis indicates days post-challenge, and the y-axis indicates percent survival.
FIGURE 2
FIGURE 2
Genome visualization of S. suis chromosomes. Circular comparison of the of nine closed S. suis chromosomes referenced to the genome of ST-1 strain P1/7. Query genomes are and plotted from outermost to innermost ring and shown top to bottom in the legend. GC-content and -skew of the reference chromosome are depicted in the two innermost circles, respectively. Identified MGEs are shown as follows Genomic Islands (GI), ProPhage regions (PP), and Insertion elements (IS).
FIGURE 3
FIGURE 3
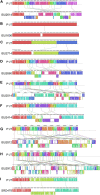
Comparison of the linear organization of S. suis chromosomes. Linear comparison of each closed S. suis genome to P1/7 (top), reference sequence. Locally collinear blocks (LCBs) representing regions of sequence alignment are shown as colored rectangles connected by lines. LCBs placed above the center line are in the same orientation as the reference; LCBs placed below the center line are in reverse orientation. Blank sections are regions of low sequence conservation. (A) P1/7 compared to ISU2614. (B) P1/7 compared to ISU1606. (C) P1/7 compared to ISU2714. (D) P1/7 compared to ISU2660. (E) P1/7 compared to ISU2514. (F) P1/7 compared to ISU2414. (G) P1/7 compared to ISU2812. (H) P1/7 compared to ISU2912. (I) P1/7 compared to SRD478.
FIGURE 4
FIGURE 4
Comparison of phenotypes related to capsule production. (A) Bacterial hydrophobicity assay. Relative hydrophobicity of S. suis isolates were determined by measuring their absorption (y-axis) to n-hexadecane. S. suis P1/7 Δcps2E, a capsule deletion mutant, was used as a control. (B) Whole blood sensitivity assay. S. suis isolates were incubated with swine whole blood for 1 h and enumerated to determine the percent viable bacteria (y-axis) expressed. (C) Serum sensitivity assay. Bacteria were incubated with guinea pig serum (+Serum) or heat-inactivated guinea pig serum (HI + Serum) and enumerated to determine the percent survival (y-axis) calculated as the proportion of treated samples to untreated samples. Serum-sensitive Glasserella parasuis H465 (Hp H465) was used as a control. Bars represent means ± SEM from three independent experiments. Bar color reflective of virulence categorization (green: highly virulent; blue: moderately virulent; light gray: non-virulent) or control (dark gray: S. suis P1/7 Δcps2E). Data was analyzed using a one-way ANOVA with a Tukey’s post-test (GraphPad Prism 8.3.0). Groups with different letter designations were significantly different (p < 0.05); ns, not statistically significantly different.
FIGURE 5
FIGURE 5
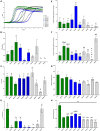
Comparison of in vitro growth and virulence-associated phenotypes. (A) Growth dynamics of S. suis isolates. Isolates were cultivated at 37°C for 24 h. Growth was measured by OD600 every 15 min. All data points represent averages obtained from three independent experiments. (B) Biofilm formation by S. suis isolates. S. suis isolates were cultivated statically for 24 h in microtiter plates. Growth was then measured by OD600 followed by quantification crystal violet staining by OD538. Biofilm mass (y-axis) is expressed as the OD538 normalized to OD600. (C) Oxidative stress assay. S. suis isolates were cultivated until exponential phase and divided into treated (10 mM H2O2) and untreated cultures (H20), incubated at 37°C for 15 min followed by addition of 10 μg/mL catalase. Bacteria were enumerated to determine the percent survival (y-axis) calculated as the proportion of treated samples to untreated samples. (D) Hemolysis assay. Hemolytic activity of supernatants collected from S. suis isolates. (E) Adherence of S. suis isolates to BEAS-2B cells. Adherence (y-axis) to BEAS-2B cells (human lung/bronchus epithelial cell line) is expressed as the proportion of bacteria in the original inoculum found to be adherent after a 2-h incubation period. (F) Adherence of S. suis isolates to macrophages. Adherence (y-axis) to J774A.1 cells (murine macrophage-like cell line cell line) is expressed as the proportion of bacteria in the original inoculum found to be adherent after a 2-h incubation period. (G) Cell-Associated Nuclease Activity. Cell-associated nuclease activity for S. suis isolates was measured using whole-cell FRET assay. (H) Secreted Nuclease Activity. Secreted nuclease activity for S. suis isolates was measured using extracellular FRET assay. Bars (B–H) represent means ± SEM from three independent experiments. Bar color reflective of virulence categorization (green: highly virulent; blue: moderately virulent; light gray: non-virulent). Data (B–H) was analyzed using a one-way ANOVA with a Tukey’s post-test (GraphPad Prism 8.3.0). Groups with connecting lines were significantly different (p < 0.0003). Groups with different letter designations were significantly different (p < 0.05).
FIGURE 6
FIGURE 6
Hierarchical cluster heatmap displaying the relatedness of S. suis isolates based on the nucleotide percent identity of analyzed virulence genes. (A) Heatmap based on nucleotide percentage identity for all analyzed virulence genes. Heatmap generated from nucleotide percentage identity was converted into a distance matrix and clustered by means of complete hierarchical clustering based on Pearson correlation distance for both genes and isolates. (B) Heatmap based on nucleotide percentage identity for selected genes with high sequence divergence. Heatmap generated from nucleotide percentage identity was converted into a distance matrix and clustered by means of complete hierarchical clustering based on Pearson correlation distance for genes only. Isolates names are provided at the top of the heat map and gene names are provided at the right side of heat map. Font color used for isolate names color reflective of virulence categorization (green: highly virulent; blue: moderately virulent; black: non-virulent). The percent identity of analyzed genes (rows) from each isolate (columns) is represented using the color scale at top, while genes not present within a strain are indicated by gray. Annotated pseudogenes are indicated by # (white or black). Dendrograms are on the left side and on top of the heat map.
FIGURE 7
FIGURE 7
Protein sequence alignments. Gene sequences were identified by BLASTn, translated, and multiple alignments of the protein sequences were created using MAFFT. Gray regions indicate identical amino acids, black regions indicate amino acid sequence differences compared to the reference (top) sequence. (A) Multiple alignment of IdeS (immunoglobulin M-degrading enzyme); P1/7 IdeS used as reference sequence. (B) Multiple alignment of MRP (muramidase-released protein); P1/7 MRP used as reference sequence. (C) Multiple alignment of OFS (serum opacity factor); Strain 10 OFS used as reference sequence. (D) Multiple alignment of SadP (cell wall adhesin); P1/7 SadP used as reference sequence. (E) Multiple alignment of SAO (surface antigen one); P1/7 SAO used as reference sequence.

References

    1. Afgan E., Baker D., Batut B., Van Den Beek M., Bouvier D., Cech M., et al. (2018). The Galaxy platform for accessible, reproducible and collaborative biomedical analyses: 2018 update. Nucleic Acids Res. 46 W537–W544. - PMC - PubMed
    1. Agniswamy J., Lei B., Musser J. M., Sun P. D. (2004). Insight of host immune evasion mediated by two variants of group a Streptococcus Mac protein. J. Biol. Chem. 279 52789–52796. 10.1074/jbc.m410698200 - DOI - PubMed
    1. Agniswamy J., Nagiec M. J., Liu M., Schuck P., Musser J. M., Sun P. D. (2006). Crystal structure of group A Streptococcus Mac-1: insight into dimer-mediated specificity for recognition of human IgG. Structure 14 225–235. 10.1016/j.str.2005.10.012 - DOI - PubMed
    1. Alikhan N. F., Petty N. K., Ben Zakour N. L., Beatson S. A. (2011). BLAST Ring Image Generator (BRIG): simple prokaryote genome comparisons. BMC Genomics 12:402. - PMC - PubMed
    1. Arndt D., Grant J. R., Marcu A., Sajed T., Pon A., Liang Y., et al. (2016). PHASTER: a better, faster version of the PHAST phage search tool. Nucleic Acids Res. 44 W16–W21. - PMC - PubMed

LinkOut - more resources