

Evaluation of Maternal Serum sHLA-G Levels for Trisomy 18 Fetuses Screening at Second Trimester
- PMID: 33574829
- PMCID: PMC7870785
- DOI: 10.3389/fgene.2020.497264
Evaluation of Maternal Serum sHLA-G Levels for Trisomy 18 Fetuses Screening at Second Trimester
Abstract
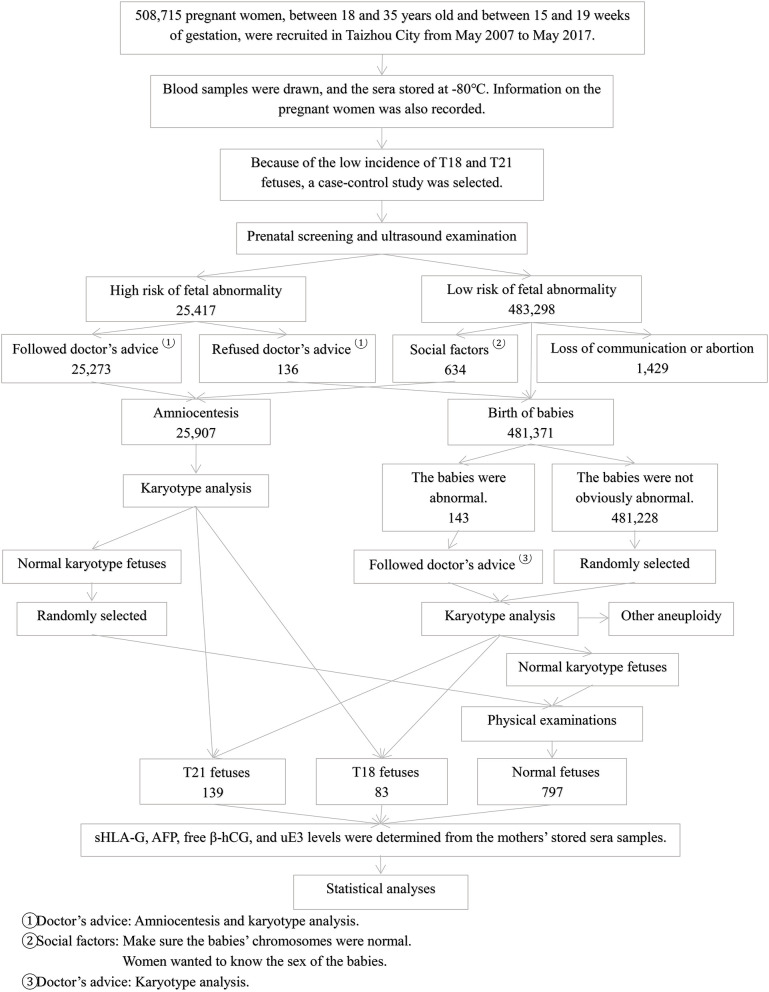
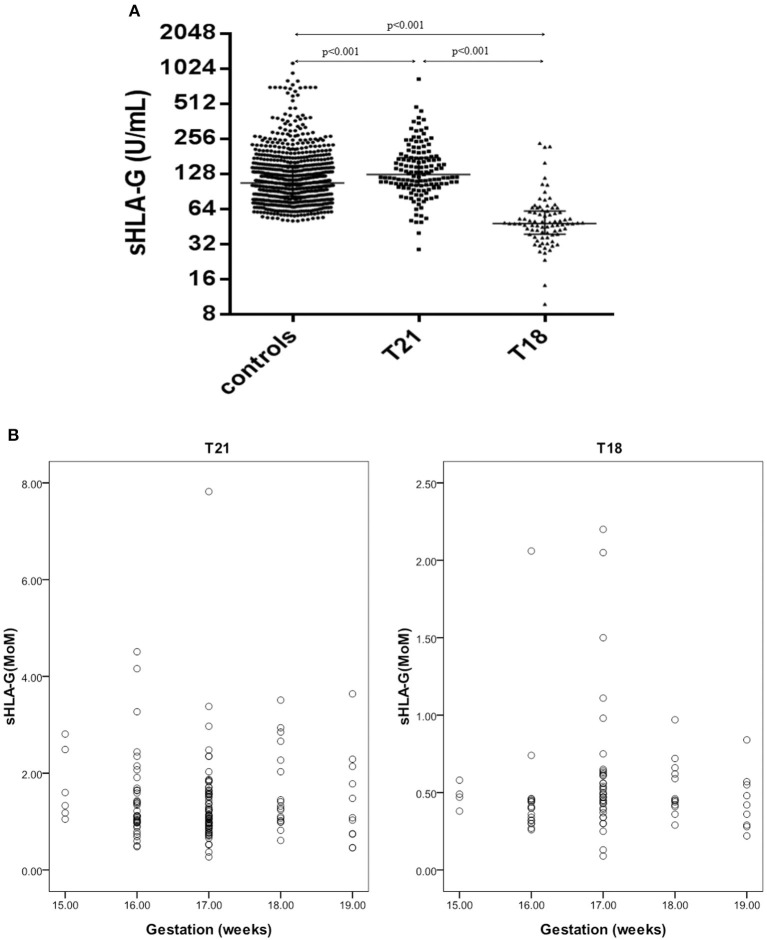
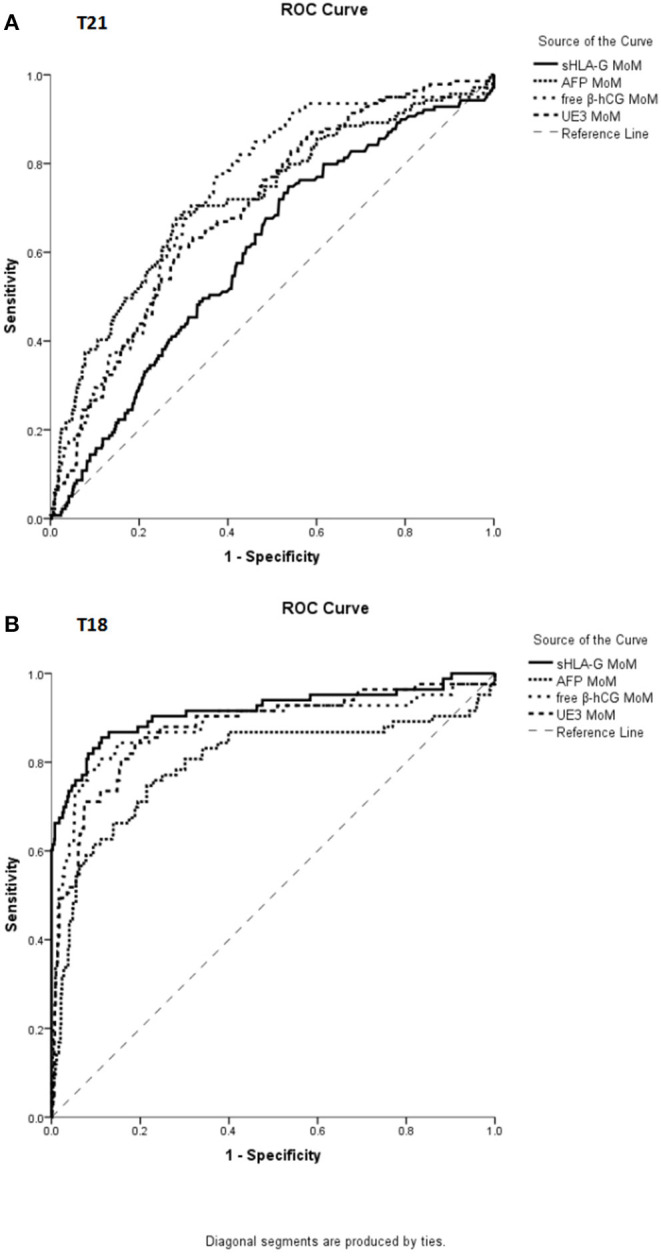
Human leukocyte antigen-G (HLA-G) has been widely acknowledged to play critical roles in fetal-maternal maintenance. However, the significance of using maternal serum sHLA-G to detect prenatal chromosomal abnormality has not been investigated. In China, prenatal screening using maternal α-fetoprotein (AFP), unconjugated estriol (uE3), and free β subunit human chorionic gonadotropin (β-hCG) in the second trimester has been widely applied. In this study, we evaluated the use of sHLA-G as a screening marker, compared with traditional second trimester prenatal screening. Serum samples from 1,019 singleton women in their second trimester were assessed. Among them, 139 infants were confirmed with trisomy 21 (T21) by karyotyping, 83 were confirmed with trisomy 18 (T18), and the remaining 797 infants had no abnormalities. The sHLA-G levels in maternal sera were significantly lower in pregnant women with T18 fetuses (median: 47.8 U/ml, range: 9.8-234.2 U/ml) and significantly higher in those with T21 fetuses (median: 125.7 U/ml, range: 28.7-831.7 U/ml), compared with the normal controls (median: 106.3 U/ml, range: 50.5-1136.4 U/ml) (p < 0.001). The risk values of the screening of T21 or T18 fetuses were assessed using mean and standard deviation log10 analyte multiples of median (MoM) which showed that the predictive values of sHLA-G were the same as free β-hCG, and superior to AFP and uE3 for T18 screening. Logistic regression analysis revealed that sHLA-G MoM was the highest risk factor associated with pregnant women carrying T18 fetuses [Exp(B): 171.26, 95% CI: 36.30-807.97, p < 0.001]. Receiver operating characteristic (ROC) analysis revealed that the area under ROC curve for sHLA-G MoM was 0.915 (95% CI, 0.871-0.959, p < 0.001), for AFP MoM was 0.796 (95% CI, 0.730-0.861, p < 0.001), for free β-hCG MoM was 0.881 (95% CI, 0.829-0.934, p < 0.001), and for uE3 MoM was 0.876 (95% CI, 0.828-0.923, p < 0.001) in the T18 group. sHLA-G MoM demonstrated the best sensitivity and negative predictive value. For the first time, our findings reveal that sHLA-G is a better second trimester screening marker for the detection of T18 fetuses and the combined application of sHLA-G with AFP, free β-hCG, and uE3 could improve clinical screening for T18 fetuses.
Keywords: chromsome; fetus; human leukocyte antigen-G; pregnancy; soluble HLA-G; trisomy.
Copyright © 2021 Xu, Zhu, Li, Xu, Yan, Dai and Gan.
Conflict of interest statement
The authors declare that the research was conducted in the absence of any commercial or financial relationships that could be construed as a potential conflict of interest.
Figures
References
-
- Arizawa M., Nakayama M. (1992). Pathological analysis of the placenta in trisomies 21, 18 and 13. Nihon Sanka Fujinka Gakkai Zasshi 44, 9–13. - PubMed
LinkOut - more resources
Full Text Sources
Other Literature Sources
Research Materials