. 2021 Feb 1;11(2):530-545.
eCollection 2021.

Degradation of BRD4 - a promising treatment approach not only for hematologic but also for solid cancer

Affiliations

Degradation of BRD4 - a promising treatment approach not only for hematologic but also for solid cancer

Karin Bauer et al. Am J Cancer Res. .

Abstract

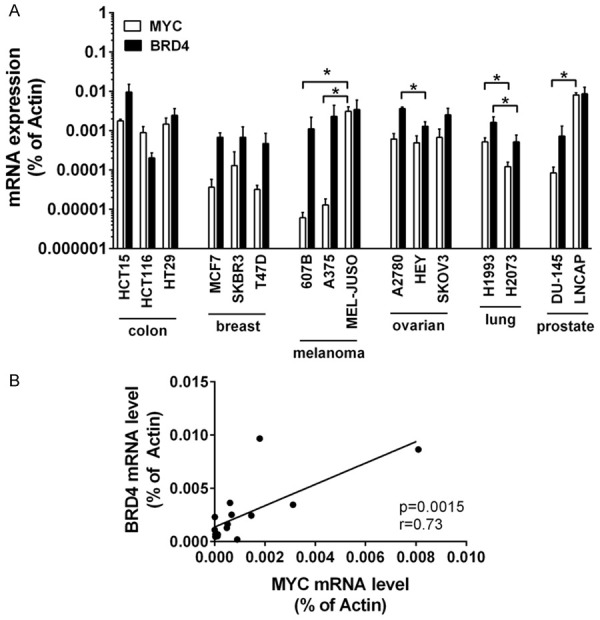
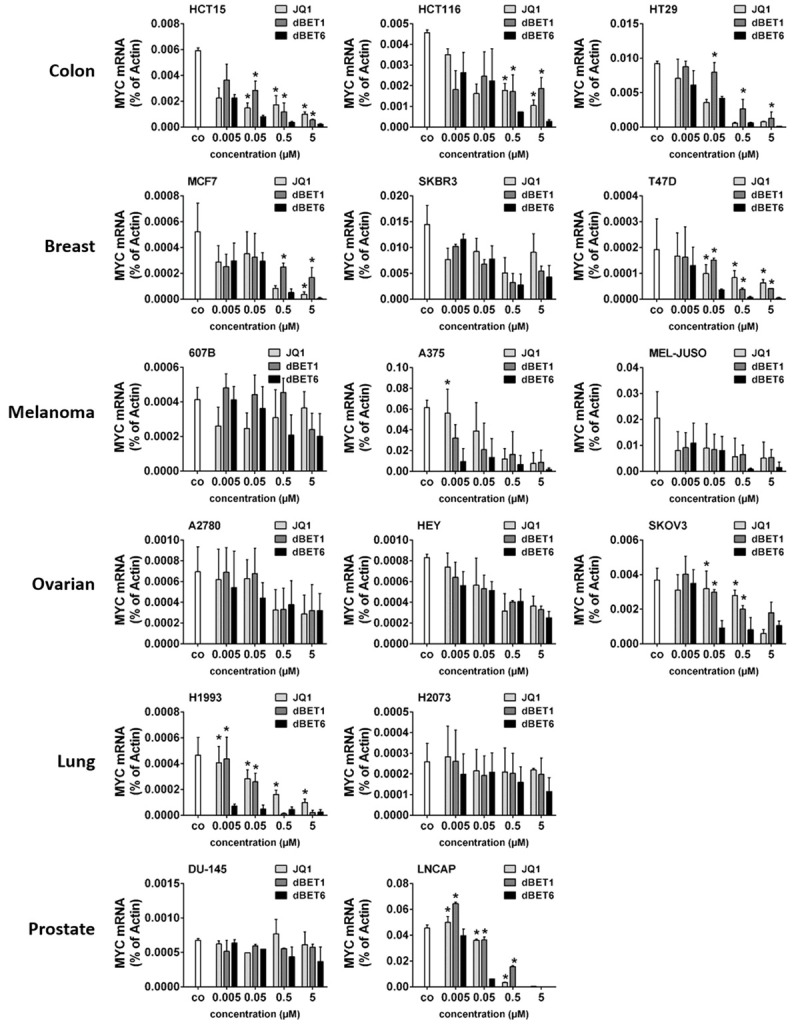
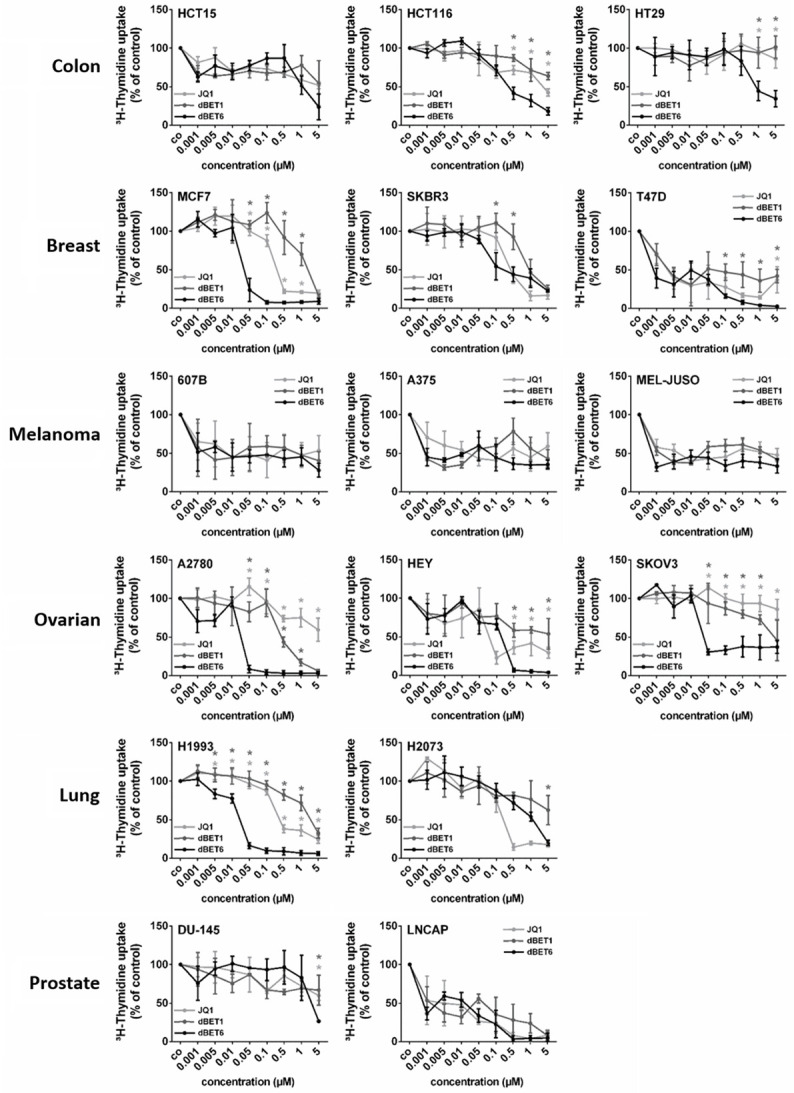
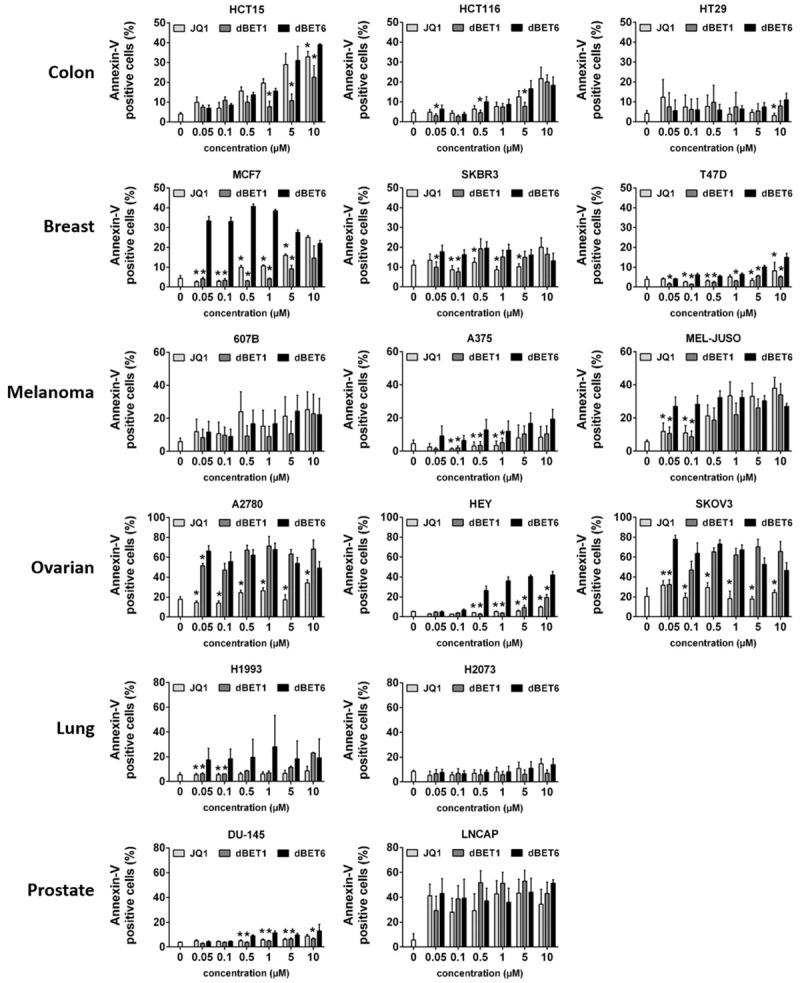
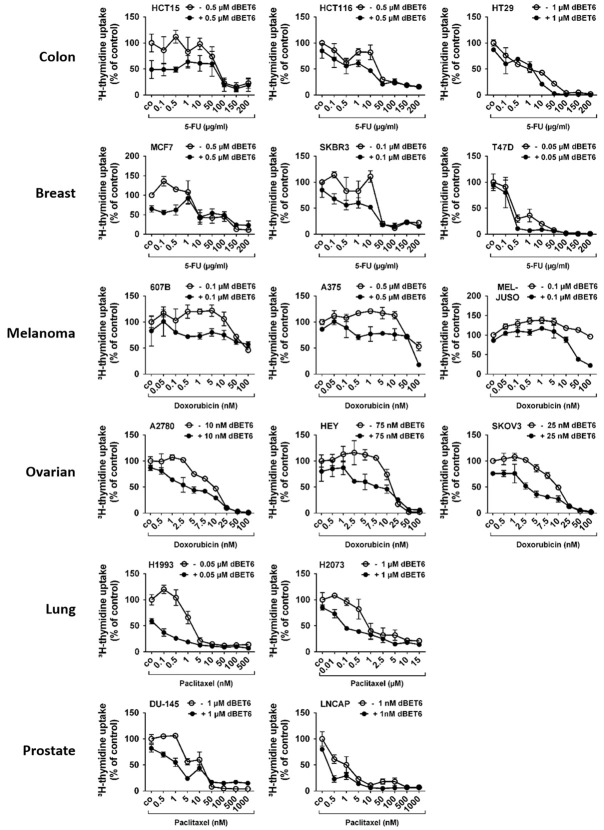
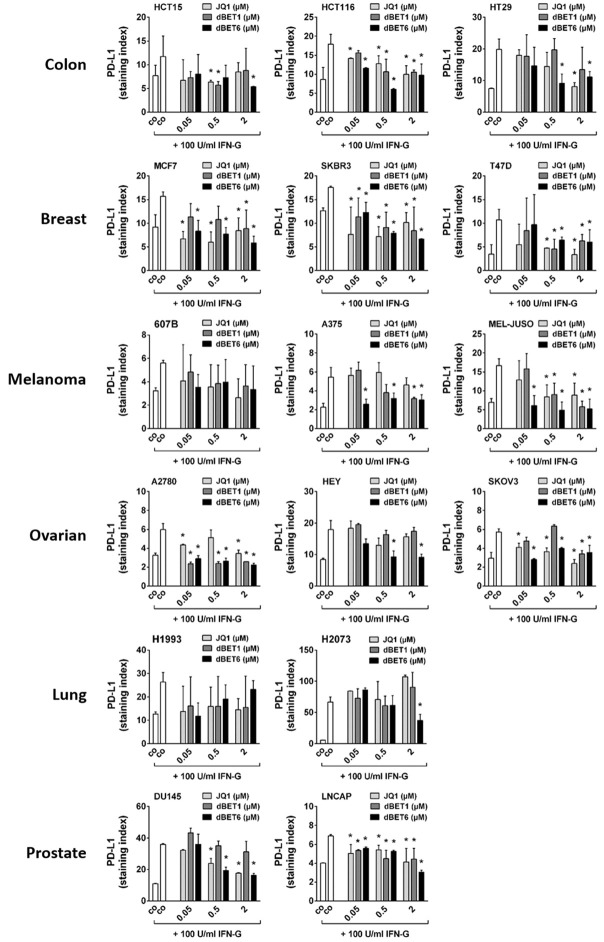
Bromodomain (BRD) and extra-terminal (BET) proteins are epigenetic readers that regulate gene expression and promote cancer evolution. Pharmacological inactivation of BRD4 has recently been introduced as a promising anti-neoplastic approach that targets MYC oncogene expression. However, resistance against BRD4-targeting drugs has been described. We compared the efficacy of the small-molecule-type BET BRD inhibitor JQ1 with the recently developed BET protein degraders dBET1 and dBET6 in colon, breast, melanoma, ovarian, lung and prostate cancer cell lines. As determined by qPCR, all BRD4 targeting drugs dose-dependently decreased MYC expression, with dBET6 introducing the strongest downregulation of MYC. This correlated with the anti-proliferative activity of these drugs, which was at least one order of magnitude higher for dBET6 (IC50 0.001-0.5 µM) than for dBET1 or JQ1 (IC50 0.5-5 µM). Interestingly, when combined with commonly used cytotoxic therapeutics, dBET6 was found to promote anti-neoplastic effects and to counteract chemoresistance in most cancer cell lines. Moreover, JQ1 and both BET degraders strongly downregulated baseline and interferon-gamma induced expression of the immune checkpoint molecule PD-L1 in all cancer cell lines. Together, our data suggest that dBET6 outperforms first-generation BRD4 targeting drugs like dBET1 and JQ1, and decreases chemoresistance and immune resistance of cancer.

Keywords: BET degrader; MYC; PD-L1; dBET6; solid tumor.


Conflict of interest statement

None.

Figures

Figure 1
Figure 1
Baseline expression of MYC and BRD4 mRNA in untreated solid tumor cells. A. Baseline expression of MYC and BRD4 mRNA was determined by qPCR analysis. The relative expression levels of MYC and BRD4 mRNA were calculated by the standard curve method and Actin was used as internal control. The figure shows the mean ± SD of 3 independent determinations. Please note that the y-axis is displayed on a logarithmic scale. Statistical analysis was performed using ANOVA and post hoc Scheffe test to compare either MYC mRNA levels between individual cell lines of the same tissue origin or BRD4 mRNA levels between individual cell lines of the same tissue origin. Asterisk (*): P < 0.05. B. Pearson correlation analysis between MYC mRNA level and BRD4 mRNA level across all cell lines revealed a highly significant (P = 0.0015) strong positive linear correlation with an r-value of 0.73.
Figure 2
Figure 2
Effects of BRD4 targeting drugs on expression of MYC mRNA in solid tumor cells. Cancer cell lines were incubated in control medium (co) or in medium containing various concentrations of JQ1, dBET1 or dBET6 (0.005-5 µM) at 37°C for 16 hours. Expression of MYC mRNA was determined by qPCR analysis. The relative expression levels of MYC mRNA were calculated by the standard curve method and Actin was used as internal control. The figures show the mean ± SD of 3 independent experiments. Statistical analysis was performed by using ANOVA and post hoc Scheffe test. Asterisk (*): P < 0.05 compared to respective concentration of dBET6 (JQ1 vs. dBET6 and dBET1 vs. dBET6).
Figure 3
Figure 3
Effects of BRD4 targeting drugs on proliferation of solid tumor cells. Cancer cell lines were incubated in control medium (co) or in medium containing various concentrations of JQ1, dBET1 or dBET6 (0.001-5 µM) at 37°C for 48 hours. Thereafter, 3H-thymidine uptake was measured. Results are expressed as percent of control (co) and represent the mean ± SD of 3 independent experiments. Statistical analysis was performed by using ANOVA and post hoc Scheffe test. Asterisk (*): P < 0.05 compared to respective concentration of dBET6 (light-grey asterisk: JQ1 vs. dBET6; dark-grey asterisk: dBET1 vs. dBET6).
Figure 4
Figure 4
Effects of BRD4 targeting drugs on survival of solid tumor cells. Cancer cell lines were incubated in control medium (co) or in medium containing various concentrations of JQ1, dBET1 or dBET6 (0.1-10 µM) at 37°C for 48 hours. Then, cells were labeled with Annexin-V-FITC and examined by flow cytometry to determine the percentage of apoptotic cells. Statistical analysis was performed by using ANOVA and post hoc Scheffe test. Results represent the mean ± SD of 3 independent experiments. Asterisk (*): P < 0.05 compared to respective concentration of dBET6 (JQ1 vs. dBET6 and dBET1 vs. dBET6).
Figure 5
Figure 5
Effects of dBET6 in combination with chemotherapeutics on proliferation of solid tumor cells. Cancer cell lines were incubated in control medium (co) or in medium containing various concentrations of 5-FU (HCT15, HCT116, HT29, MCF7, SKBR3, T47D), doxorubicin (607B, A375, MEL-JUSO, A2780, HEY, SKOV3) or paclitaxel (H1993, H2073, DU-145, LNCAP) with or without dBET6 (≤ IC50 of the cell lines) at 37°C for 48 hours. Thereafter, 3H-thymidine uptake was measured. Results are expressed as percent of control (co) and represent the mean ± SD of 3 independent experiments.
Figure 6
Figure 6
Effect of BRD4 targeting drugs on interferon-gamma induced PD-L1 expression in solid tumor cells. Cancer cell lines were incubated in control medium (co) without or with 100 U/ml interferon-gamma alone or in combination with various concentrations (0.05, 0.5, 2 µM) of JQ1, dBET1 or dBET6 at 37°C for 24 hours. Then, PD-L1 expression was determined by flow cytometry. Expression levels are provided as staining index (SI) defined by the ratio of median fluorescence intensities (MFI) obtained with specific PD-L1 mAb and isotype-matched control mAb (SI = MFIPD-L1 mAb:MFIcontrol mAb). Statistical analysis was performed by using ANOVA and post hoc Scheffe test. Results represent the mean ± SD of at least 3 independent experiments. Asterisk (*): P < 0.05 compared to IFN-G treated control (co) cells.

References

    1. Romanowska J, Joshi A. From genotype to phenotype: through chromatin. Genes. 2019;10:76. - PMC - PubMed
    1. Dawson MA. The cancer epigenome: concepts, challenges, and therapeutic opportunities. Science. 2017;355:1147–1152. - PubMed
    1. Flavahan WA, Gaskell E, Bernstein BE. Epigenetic plasticity and the hallmarks of cancer. Science. 2017;357:eaal2380. - PMC - PubMed
    1. Mio C, Bulotta S, Russo D, Damante G. Reading cancer: chromatin readers as druggable targets for cancer treatment. Cancers (Basel) 2019;11:61. - PMC - PubMed
    1. Pervaiz M, Mishra P, Gunther S. Bromodomain drug discovery - the past, the present, and the future. Chem Rec. 2018;18:1808–1817. - PubMed

LinkOut - more resources