. 2021 Feb 1;11(2):590-617.
eCollection 2021.

P4HA1 as an unfavorable prognostic marker promotes cell migration and invasion of glioblastoma via inducing EMT process under hypoxia microenvironment

Affiliations

P4HA1 as an unfavorable prognostic marker promotes cell migration and invasion of glioblastoma via inducing EMT process under hypoxia microenvironment

Xiaosan Zhu et al. Am J Cancer Res. .

Abstract

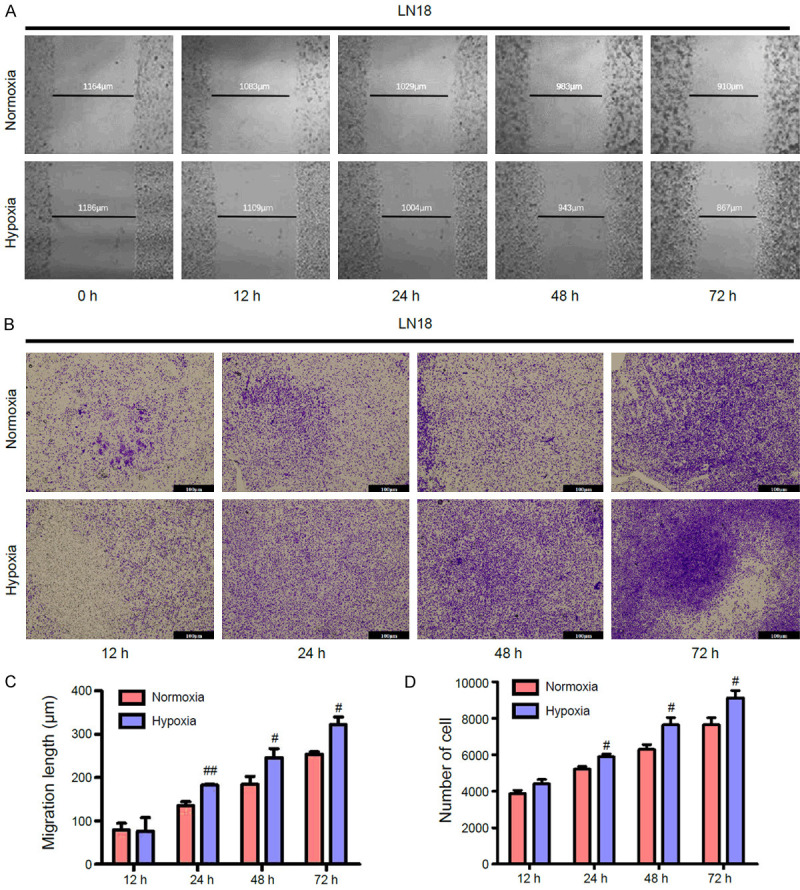
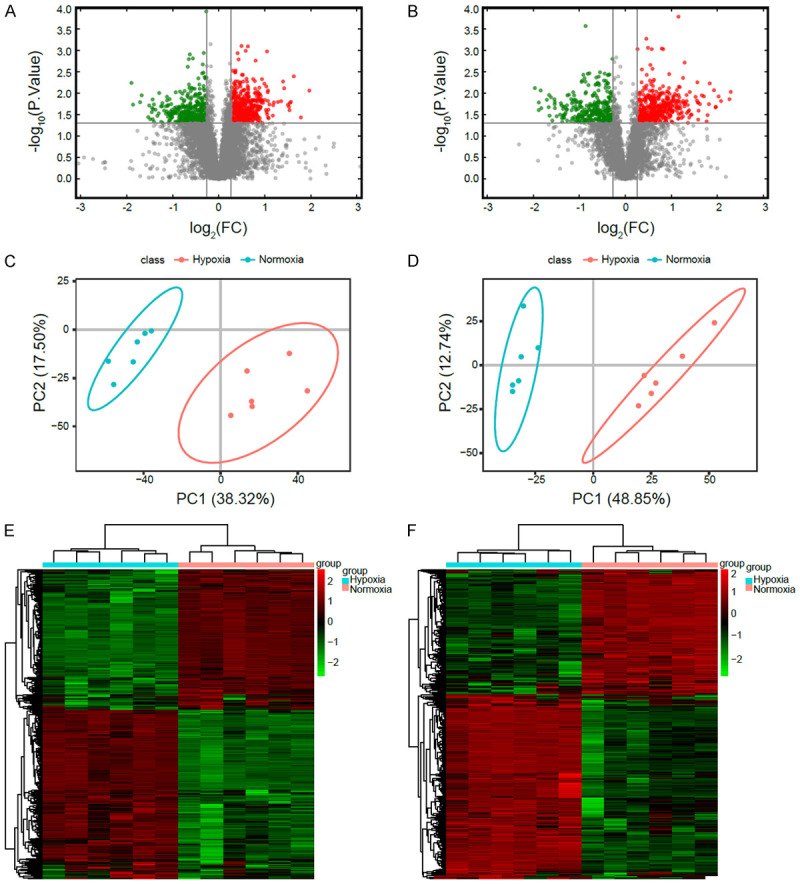
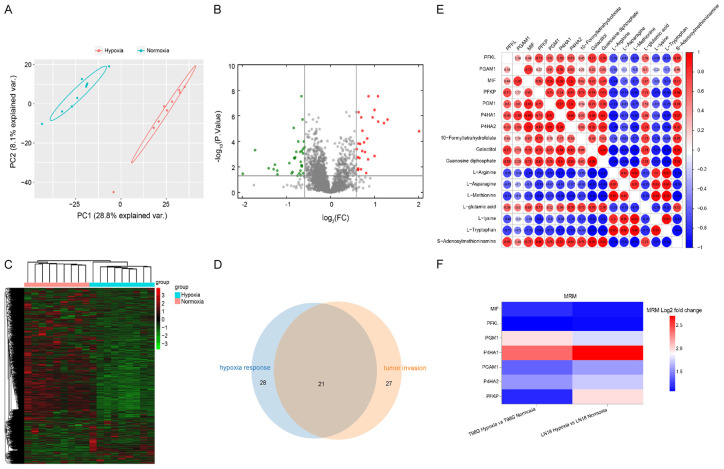
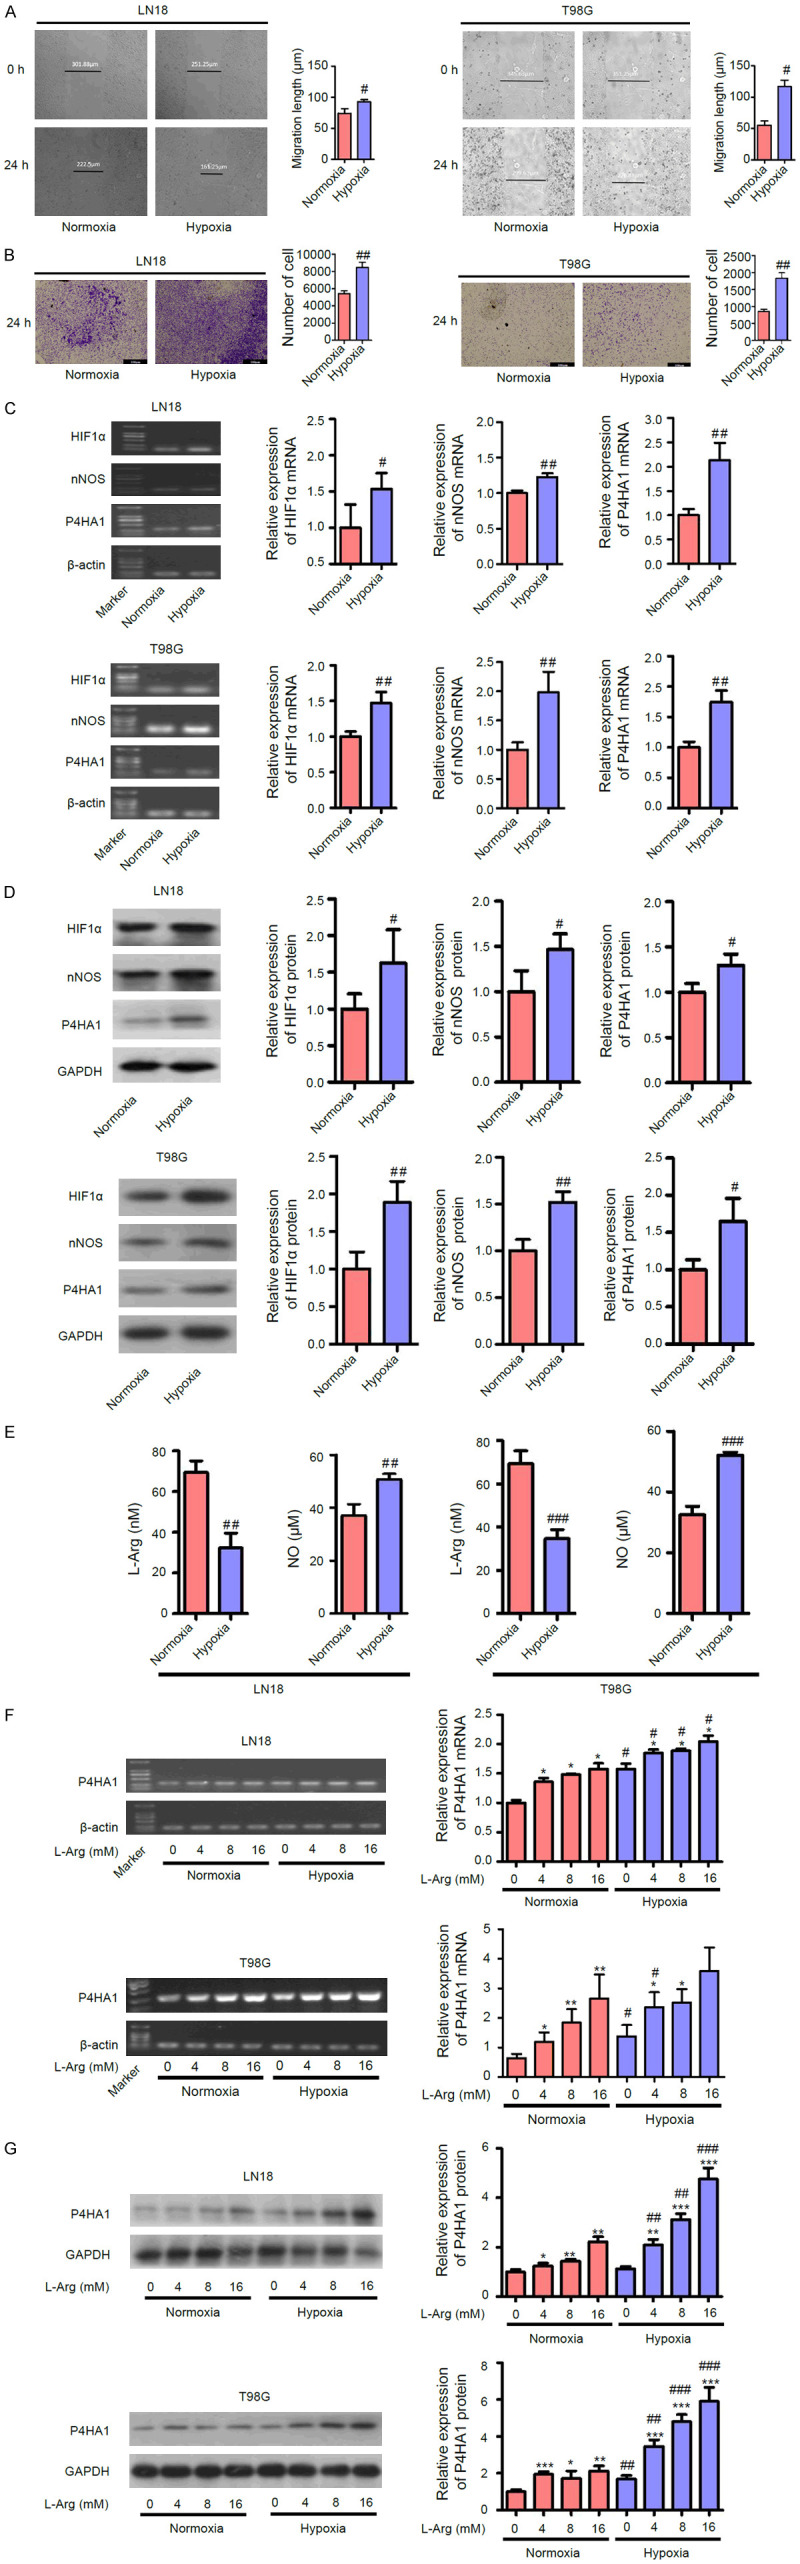
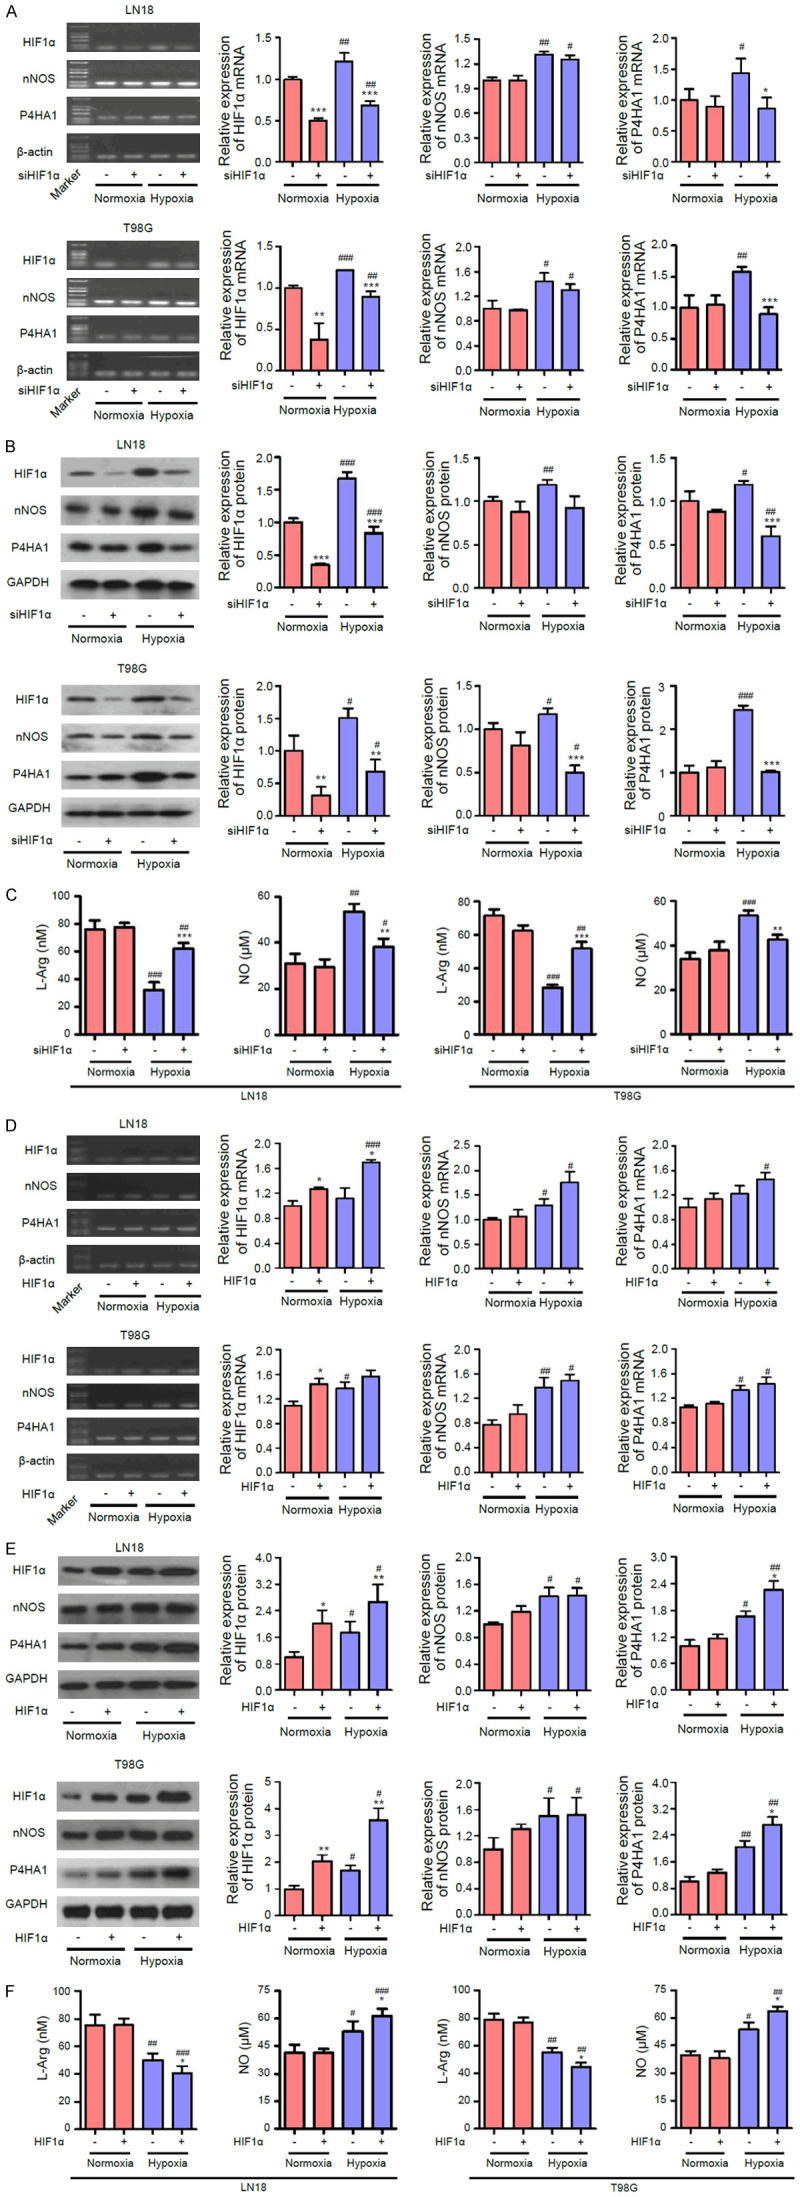
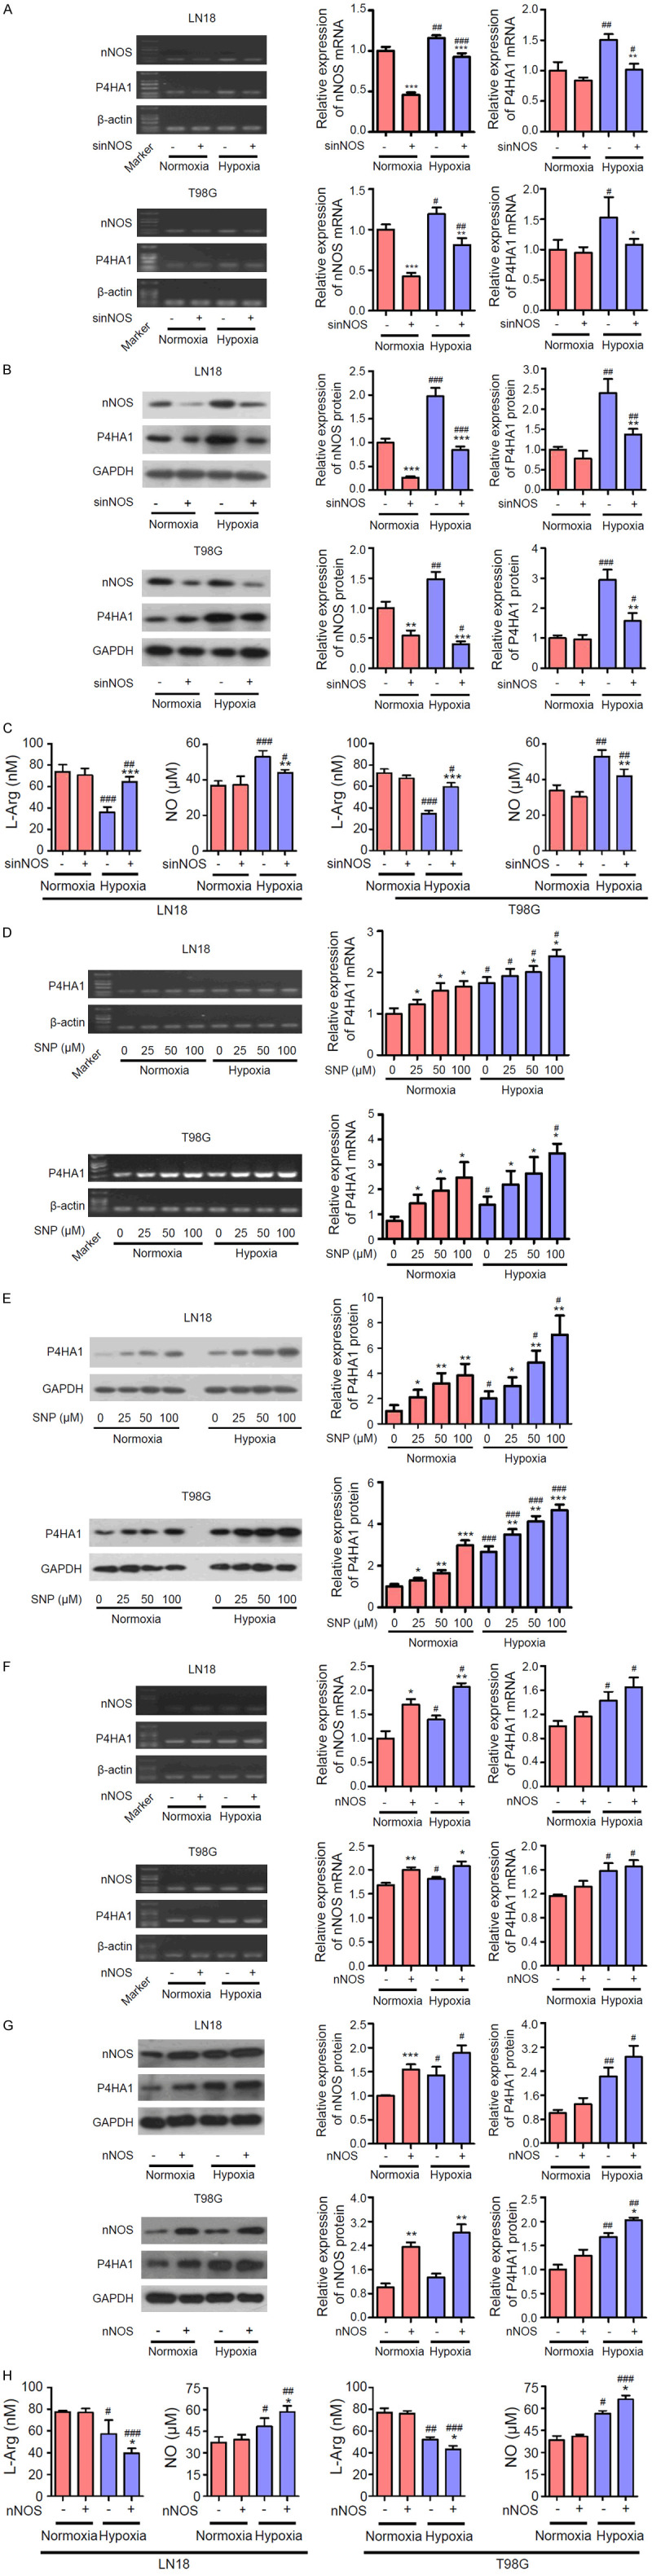
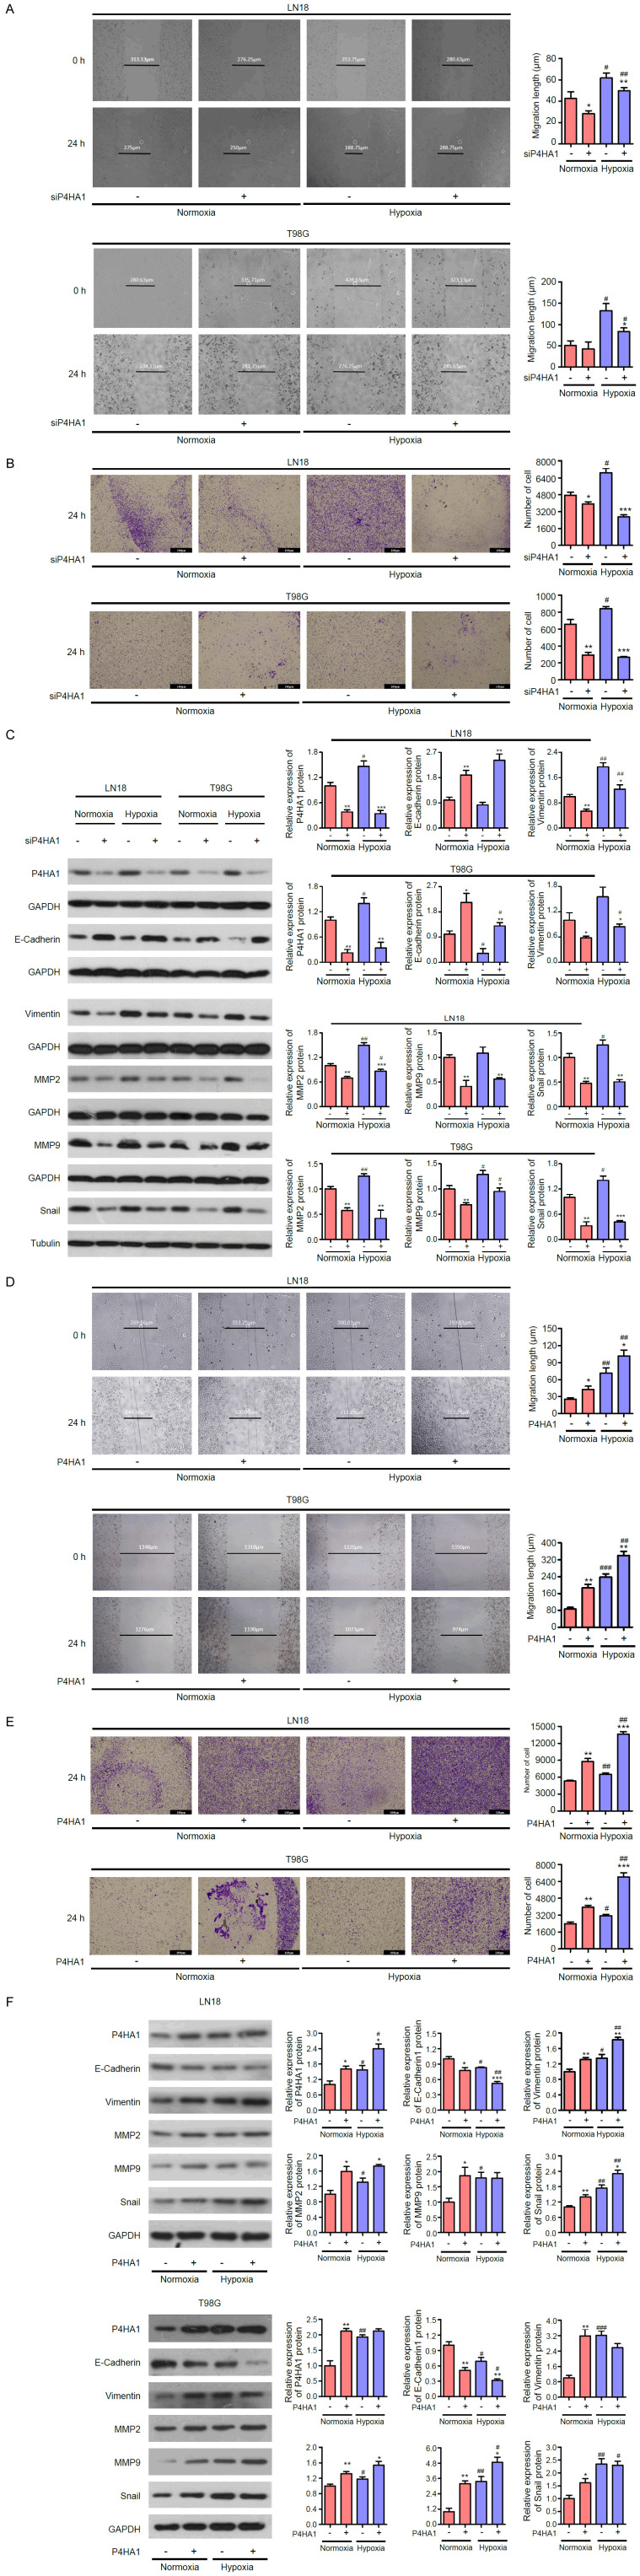
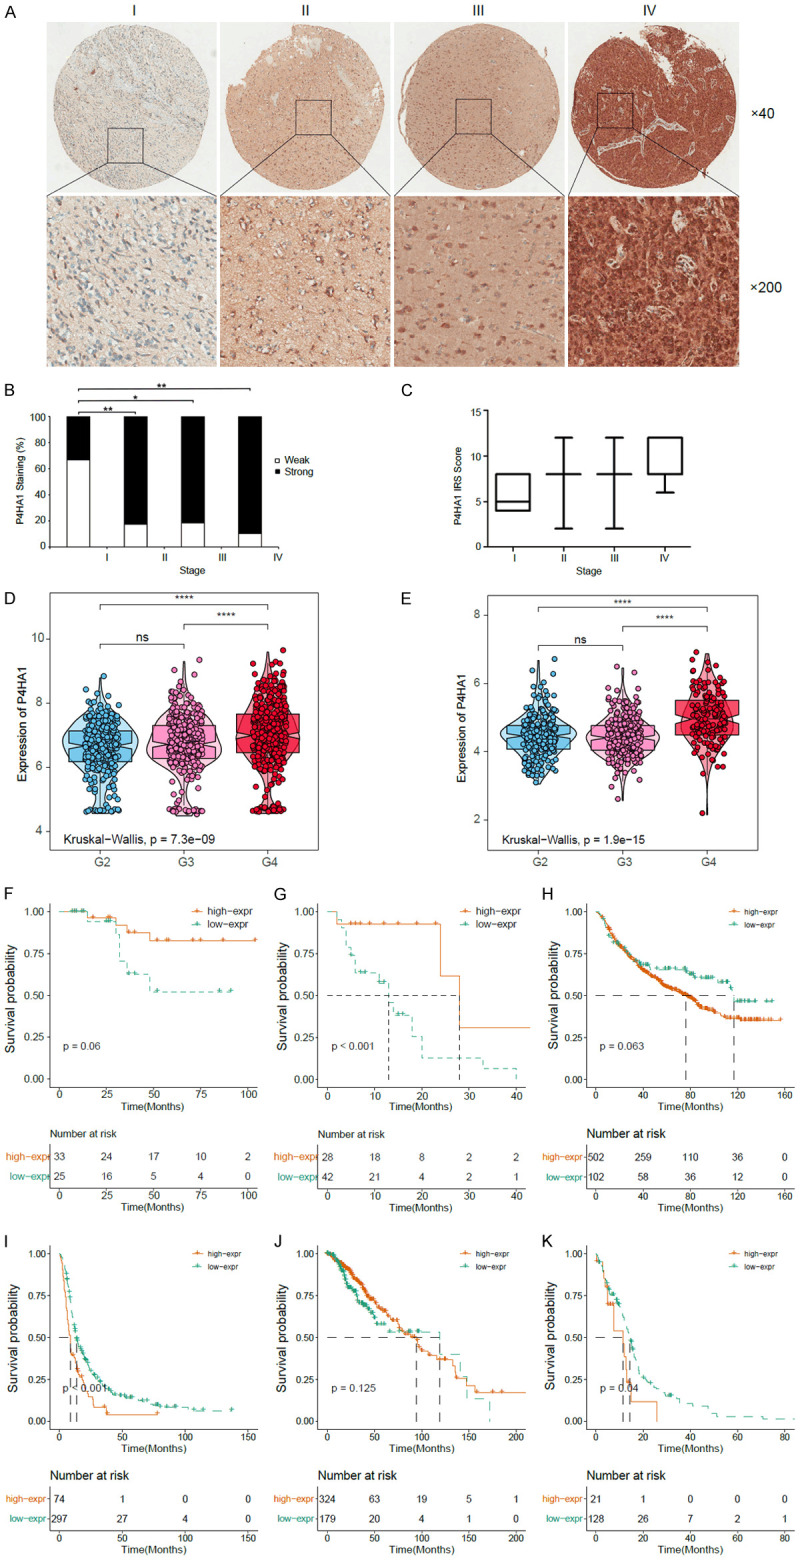
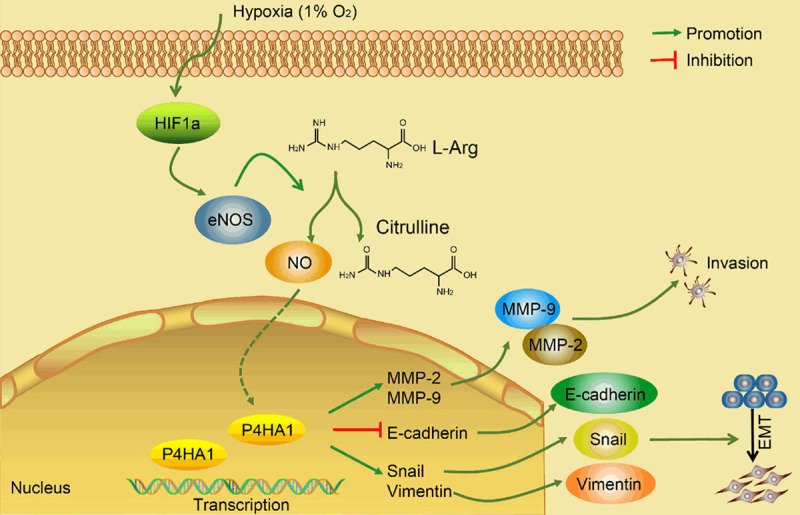
This study aims to explore the mechanism of glioblastoma multiforme (GBM) in hypoxia through metabolomic and proteomic analysis. We showed that the migration and invasiveness of LN18 cells was significantly enhanced after 24 h of hypoxia treatment. The metabolomic and proteomic profiling were conducted in LN18 cells cultured under hypoxia condition. Correlation analysis between significant differential metabolites and proteins revealed seven proteins and ten metabolites, of which metabolite L-Arg was negatively correlated with P4HA1 protein. Meanwhile, the expression of HIF1α, nNOS and P4HA1 was up-regulated, and the concentration of L-Arg and NO was decreased and increased respectively. Knockdown of HIF1α reduced the expression of nNOS and P4HA1, the concentration of NO and the invasiveness of cells, while increased the concentration of L-Arg. Similar changes on P4HA1 expression, the concentration of L-Arg and NO were observed when the expression of nNOS was disrupted. Lastly, knockdown of P4HA1 impaired the invasion of LN18 and T98G cells, probably through regulating the expression of Vimentin, MMP2, MMP9, Snail and E-cadherin. Consistent trends on both the overexpression of these relevant genes, as well as the concentration of L-Arg and NO were also observed in all our overexpression experiments. Besides, we investigated the relationship between P4HA1 expression and prognosis by MTA, CGGA and TCGA databases. Increased P4HA1 level was correlated poor prognosis with advanced histological grade. In summary, we found that hypoxia promotes the migration and invasion of GBM via the L-Arg/P4HA1 axis which maybe an effective molecular marker or predictor of clinical outcome in GBM patients.

Keywords: Hypoxia; P4HA1; glioblastoma multiforme; invasion; migration; prognosis.


Conflict of interest statement

None.

Figures

Figure 1
Figure 1
Hypoxia enhances glioblastoma cell migration and invasion. A, C. Wound-healing assays revealed the migration activity of LN18 cells in response to hypoxia in time course from 12 h up to 72 h. B, D. Transwell migration assay revealed the invasion activity of LN18 cells in response to hypoxia in time course from 12 h up to 72 h. Results are presented as mean ± SD; n=3; # comparison of hypoxia to normoxia, ##0.01
Figure 2
Figure 2
Overview of metabolic alternation in hypoxic glioblastoma cells. A, B. The altered metabolites in positive and negative modes are visualized in volcano plot. Up and down regulated metabolites are shown in red and green respectively. C, D. PCA analysis is performed to visualize the general clustering trends of positive and negative metabolites among the 12 experimental groups. Clear segregation of metabolic profiles was shown between hypoxia and normoxia groups. E, F. Heat maps show the hierarchical clustering analysis of the dataset consisted of metabolites quantified in all 12 samples in either positive or negative mode.
Figure 3
Figure 3
The landscape of differentially expressed proteins in response to hypoxia and integrative analysis reveals critical genes and metabolites of hypoxic response in glioblastoma. A. PCA analysis is performed to visualize the general clustering trends among the 18 experimental groups. There is clear segregation of the protein profiles of the hypoxia group from the normoxia group. B. Differentially expressed proteins are visualized in volcano plot. Grey dots represent proteins without significant change, while the red and green dots denote up and down regulated proteins respectively. C. Heat map shows the hierarchical clustering analysis of the dataset consisted of proteins quantified in the 18 samples. D. Venn diagram for numbers of differentially expressed proteins associated with hypoxia or tumor invasion. E. A matrix of pairwise pearson correlations is shown between the 7 differentially expression proteins and 10 altered metabolites identified from integrative analysis. Red and blue dots indicate positive and negative correlation respectively. The numbers in the dots represent the pearson correlation scores. F. MRM assays confirmed the expression of the 7 proteins in both LN18 and T98G cell lines. Color intensity represents the log2 fold changes.
Figure 4
Figure 4
Hypoxia regulates P4HA1 expression and L-Arg production. A, B. Wound-healing and transwell migration assays revealed the migration and invasion activities of LN18 and T98G cells in response to hypoxia. C, D. Levels of the indicated genes and proteins were determined by qRT-PCR and immunoblot assay after culturing the LN18 and T98G cells under normoxia and hypoxia for 24 h. E-G. Quantification of L-Arg and NO concentration in LN18 and T98G cells under both hypoxic and normoxic conditions. Expression of P4HA1 at mRNA and protein levels increased in the presence of external L-Arg in a dose-dependent manner. Results are presented as mean ± SD; n=3; * comparison to siCon and # comparison of hypoxia to normoxia, *** or ###P<0.01, ** or ##0.01
Figure 5
Figure 5
HIF1α enhances the expression of nNOS and P4HA1 and catalyzation of L-Arg. A, B, D and E. Levels of the indicated genes and proteins were determined by qRT-PCR and immunoblot assay after culturing the LN18 and T98G cells under normoxia and hypoxia for 24 h. C. Quantification of L-Arg and NO concentration in siHIF1α LN18 and T98G cells. F. Quantification of L-Arg and NO concentration in HIF1α overexpression LN18 and T98G cells. Results are presented as mean ± SD; n=3; * comparison to siCon and # comparison of hypoxia to normoxia, *** or ###P<0.01, ** or ##0.01
Figure 6
Figure 6
nNOS regulates the expression of P4HA1 and oxidation of L-Arg. A, B, F and G. Expression levels of P4HA1 were determined by qRT-PCR and immunoblot assay after culturing the sinNOS LN18 and T98G cells under normoxia and hypoxia for 24 h. Knockdown efficiency of sinNOS and and overexpression of nNOS was confirmed. C. Quantification of L-Arg and NO concentration in sinNOS LN18 and T98G cells. D, E. Expression of P4HA1 at mRNA and protein levels increased in the presence of SNP in a dose-dependent manner. H. Quantification of L-Arg and NO concentration in nNOS overexpression LN18 and T98G cells. Results are presented as mean ± SD; n=3; * comparison to siCon and # comparison of hypoxia to normoxia, *** or ###P<0.01, ** or ##0.01
Figure 7
Figure 7
P4HA1 promotes hypoxia-induced glioblastoma migration through remodeling of EMT program. A, D. Wound-healing assays revealed the migration activity in LN18 and T98G cells with disrupted P4HA1 expression. B, E. Transwell migration assays revealed the invasion activity in LN18 and T98G cells with disrupted P4HA1 expression. C, F. Levels of the indicated proteins associated with EMT programing were determined by immunoblot assay after culturing the siP4HA1 or P4HA1 overexpression LN18 and T98G cells under normoxia and hypoxia for 24 h. Results are presented as mean ± SD; n=3; * comparison to siCon and # comparison of hypoxia to normoxia, *** or ###P<0.01, ** or ##0.01
Figure 8
Figure 8
Analysis of P4HA1 expression and survival in glioblastoma patients from tissue microarray (TMA), CGGA and TCGA database. A. Immunohistochemical staining of P4HA1 in different WHO grades glioma tissues. B. Increased cytoplasmic P4HA1 expression correlates with subtype glioma. C. Data from TMA revealed that P4HA1 expression increased in grade II, III and IV glioma compared with that in grade I. D, E. P4HA1 expression pattern in different subtypes in CGGA and TCGA data set. F, G. Increased P4HA1 expression correlated with poor prognosis for high-grade gliomas but not low-grade ones. H, I. Data from the CGGA showed that increased P4HA1 expression correlated with poor prognosis for high-grade gliomas but not low-grade ones. J, K. TCGA analysis showed that high expression of P4HA1 conferred a worse prognosis in high-grade glioma patients than that in low-grade ones. ***P<0.01, **0.01
Figure 9
Figure 9
Schematic representation of downstream signaling cascade associated with hypoxia-initiated cell invasion of glioblastoma.

Similar articles

Cited by

References

    1. Thakkar JP, Dolecek TA, Horbinski C, Ostrom QT, Lightner DD, Barnholtz-Sloan JS, Villano JL. Epidemiologic and molecular prognostic review of glioblastoma. Cancer Epidemiol Biomarkers Prev. 2014;23:1985–1996. - PMC - PubMed
    1. Wright CH, Wright J, Onyewadume L, Raghavan A, Lapite I, Casco-Zuleta A, Lagman C, Sajatovic M, Hodges TR. Diagnosis, treatment, and survival in spinal dissemination of primary intracranial glioblastoma: systematic literature review. J Neurosurg Spine. 2019:1–10. - PubMed
    1. Field KM, Jordan JT, Wen PY, Rosenthal MA, Reardon DA. Bevacizumab and glioblastoma: scientific review, newly reported updates, and ongoing controversies. Cancer. 2015;121:997–1007. - PubMed
    1. Ramezani S, Vousooghi N, Joghataei MT, Chabok SY. The role of kinase signaling in resistance to bevacizumab therapy for glioblastoma multiforme. Cancer Biother Radiopharm. 2019;34:345–354. - PubMed
    1. Colwell N, Larion M, Giles AJ, Seldomridge AN, Sizdahkhani S, Gilbert MR, Park DM. Hypoxia in the glioblastoma microenvironment: shaping the phenotype of cancer stem-like cells. Neuro Oncol. 2017;19:887–896. - PMC - PubMed

LinkOut - more resources