. 2021 Jan 1:23:702-718.
doi: 10.1016/j.omtn.2020.12.016. eCollection 2021 Mar 5.

Comprehensive analysis to identify DLEU2L/TAOK1 axis as a prognostic biomarker in hepatocellular carcinoma

Affiliations

Comprehensive analysis to identify DLEU2L/TAOK1 axis as a prognostic biomarker in hepatocellular carcinoma

Yi Shi et al. Mol Ther Nucleic Acids. .

Abstract

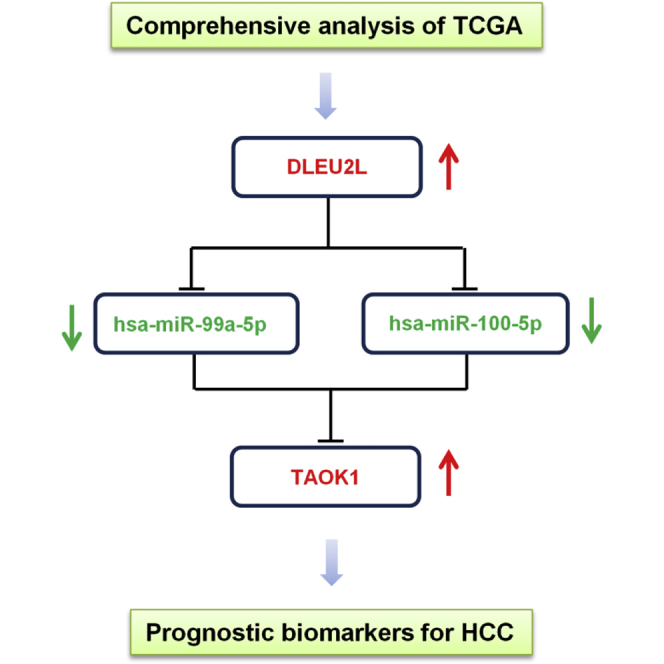
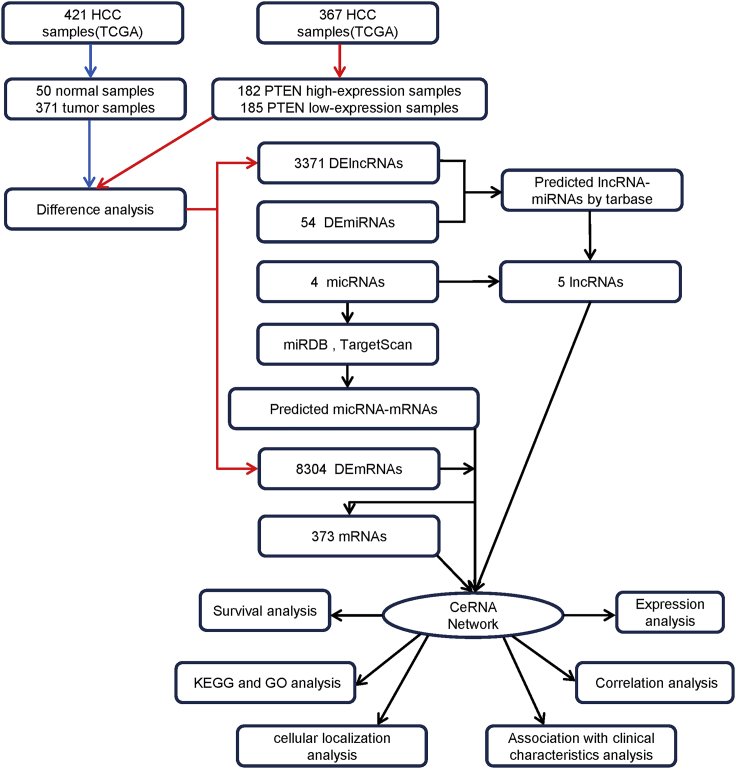
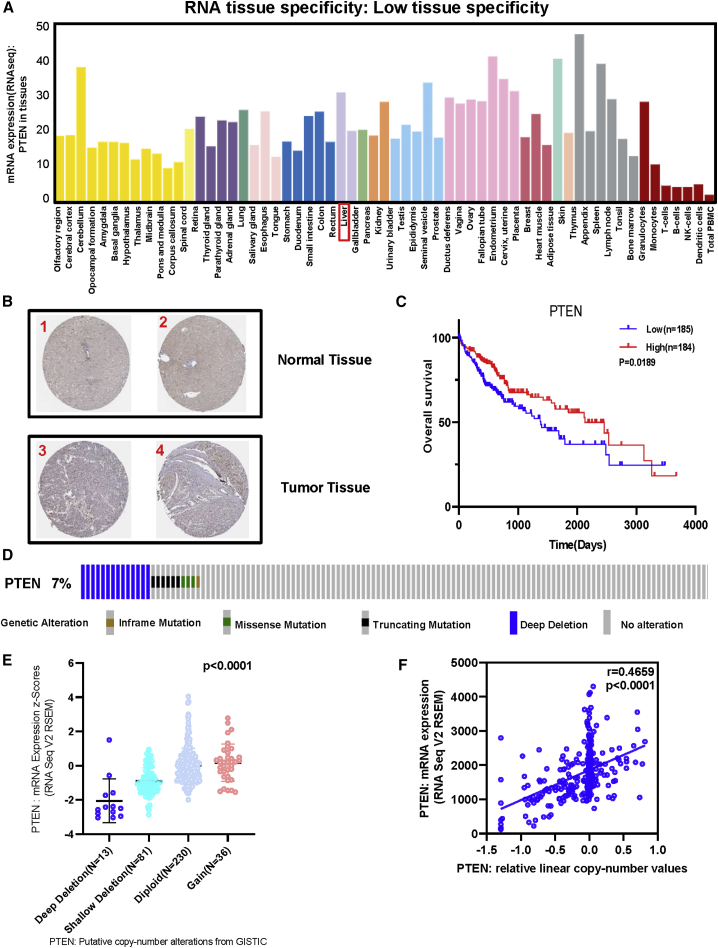
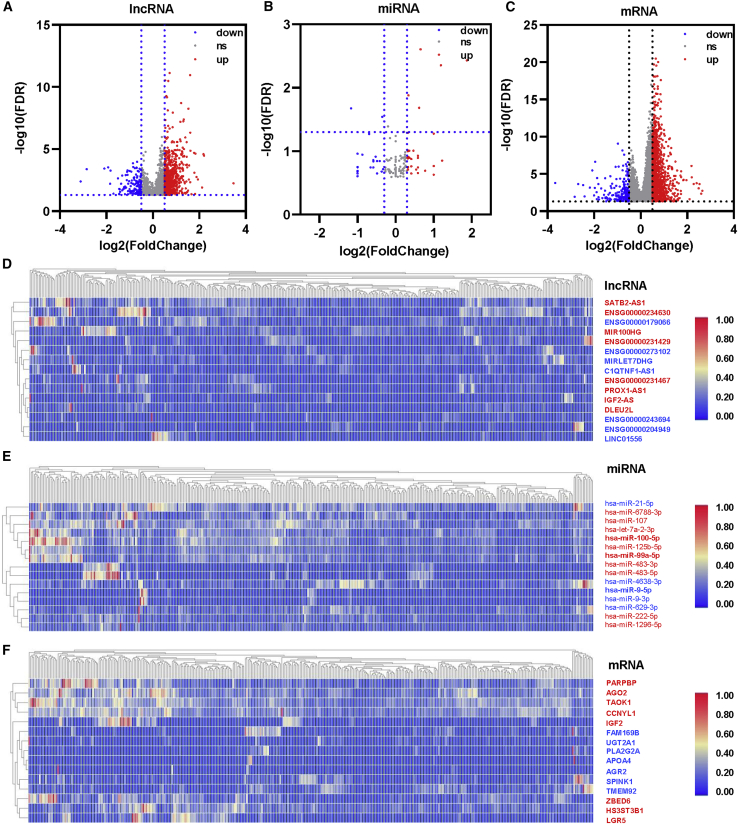
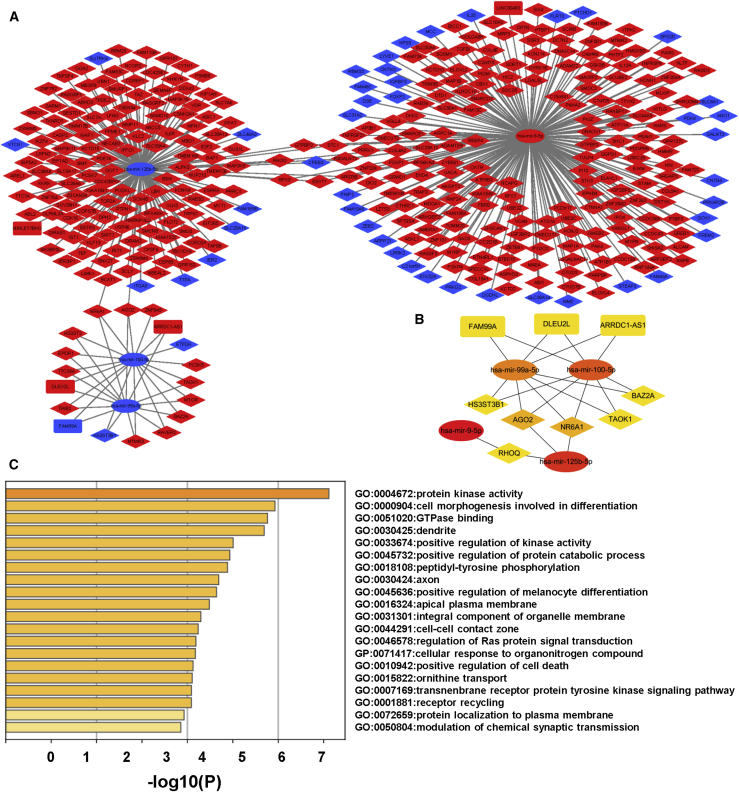
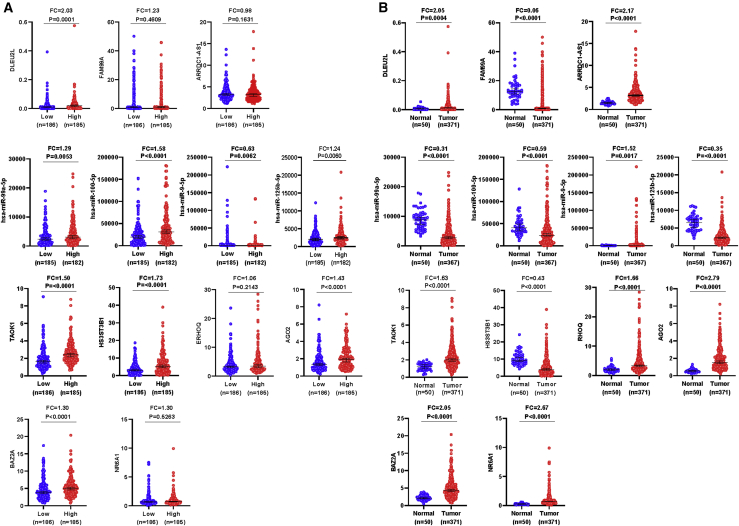
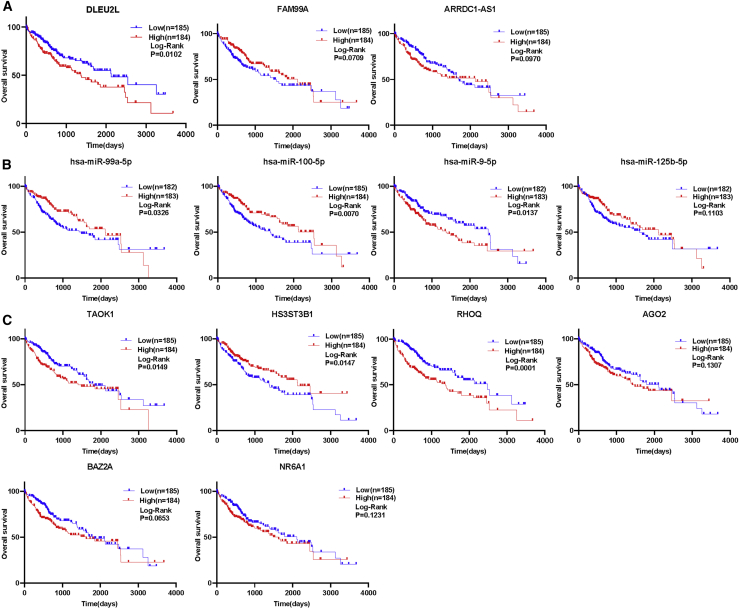
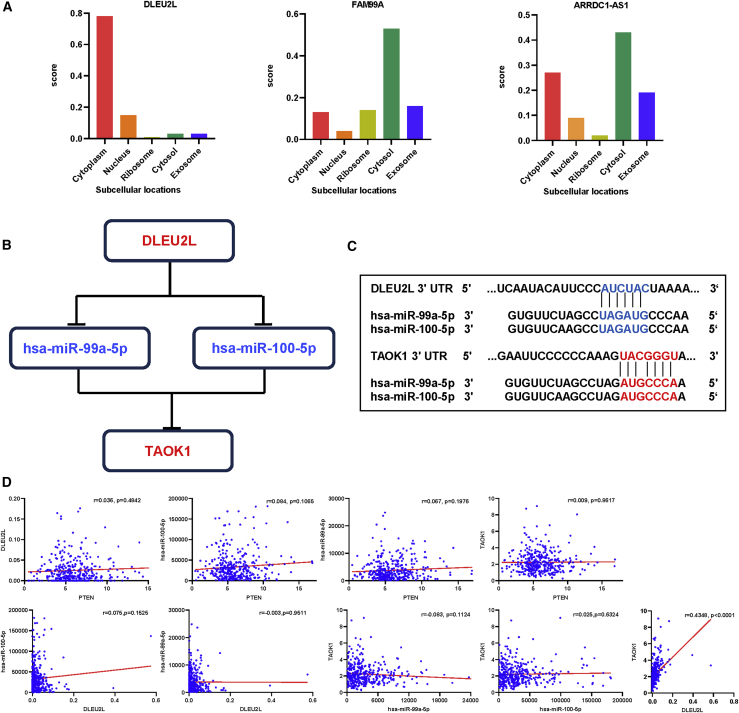
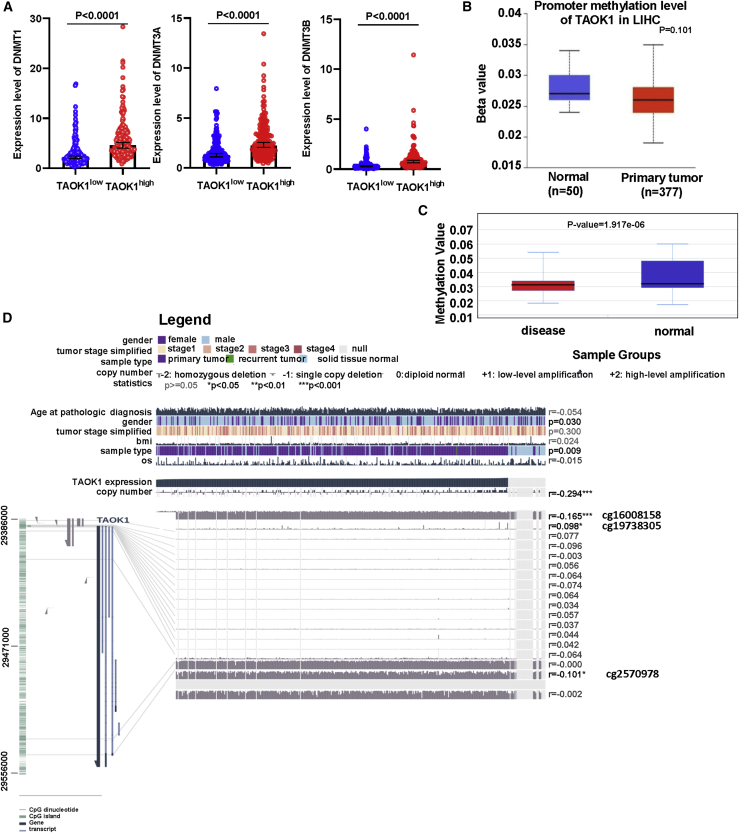
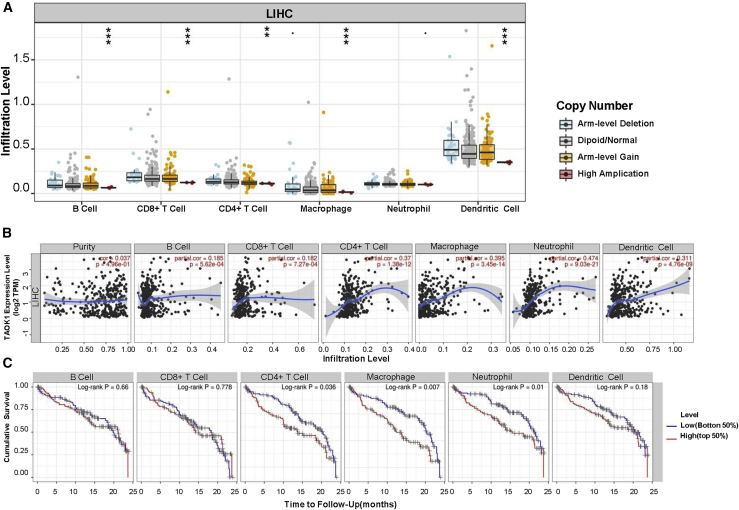
Hepatocellular carcinoma (HCC) is one of the deadliest malignant tumors that are harmful to human health. Increasing evidence has underscored the critical role of the competitive endogenous RNA (ceRNA) regulatory networks among various human cancers. However, the complexity and behavior characteristics of the ceRNA network in HCC were still unclear. In this study, we aimed to clarify a phosphatase and tensin homolog (PTEN)-related ceRNA regulatory network and identify potential prognostic markers associated with HCC. The expression profiles of three RNAs (long non-coding RNAs [lncRNAs], microRNAs [miRNAs], and mRNAs) were extracted from The Cancer Genome Atlas (TCGA) database. The DLEU2L-hsa-miR-100-5p/ hsa-miR-99a-5p-TAOK1 ceRNA network related to the prognosis of HCC was obtained by performing bioinformatics analysis. Importantly, we identified the DLEU2L/TAOK1 axis in the ceRNA by using correlation analysis, and it appeared to become a clinical prognostic model by Cox regression analysis. Furthermore, methylation analyses suggested that the abnormal upregulation of the DLEU2L/TAOK1 axis likely resulted from hypomethylation, and immune infiltration analysis showed that the DLEU2L/TAOK1 axis may have an impact on the changes in the tumor immune microenvironment and the development of HCC. In summary, the current study constructing a ceRNA-based DLEU2L/TAOK1 axis might be a novel important prognostic factor associated with the diagnosis and prognosis of HCC.

Keywords: DLEU2L/TAOK1 axis; HCC; ceRNA network; prognosis.


Conflict of interest statement

The authors declare no competing interests.

Figures

None
Graphical abstract
Figure 1
Figure 1
Flowchart of construction and analysis of ceRNA
Figure 2
Figure 2
The tumor suppressor role of PTEN in human hepatocellular carcinoma (HCC) (A) Expression distribution of PTEN in pan-cancer tissues. (B) Validation of the expression of PTEN on the translational level by the Human Protein Atlas database (immunohistochemistry). (C) The low (n = 185) and high expression (n = 184) of PTEN were compared using a Kaplan-Meier survival curve. (D) The distribution of PTEN genomic alterations in TCGA HCC is shown on a cBioPortal OncoPrint plot. (E and F) The association between PTEN copy number and mRNA expression are shown in the dot plot (E) and correlation plot (F) by cBioPortal.
Figure 3
Figure 3
Volcano plots and heatmap plots of DElncRNAs, DEmiRNAs, and DEmRNAs between the expression of PTENhigh and PTENlow in HCC samples Red represents upregulated genes and blue indicates downregulated genes. (A–C) The volcano plots describe (A) 860DElncRNAs (|log2fold change| > 0.5 and adjusted p value < 0.05), (B) 54DEmiRNAs (|log2fold change| > 0.3 and adjusted p value < 0.05), and (C) 1871DEmRNAs (|log2fold change| > 0.5 and adjusted p value < 0.05). (D–F) The horizontal axis of the heatmap indicates the samples, and the vertical axis of the heatmap indicates 15 significant DEGs.
Figure 4
Figure 4
Construction and functional enrichment analysis of the lnRNA-miRNA-mRNA triple regulatory network The ellipses denote miRNAs, diamonds denote mRNAs, and round rectangles denote lncRNAs. (A) The triple regulatory network in HCC. Red indicates upregulated, and blue represents downregulated. (B) Thirteen hub genes in this network with a score of >2. (C) Functional enrichment analysis (GO and KEGG) of the DEmRNAs in the network
Figure 5
Figure 5
The distribution of 13 hub-RNA expression patterns from the triple regulatory network in TCGA HCC dataset (A and B) The expression patterns of three hub-DElncRNAs, four hub-DEmiRNAs, and six hub-DEmRNAs in HCC samples with PTENhigh and PTENlow expression groups (A), and in HCC and adjacent normal liver tissues (B).
Figure 6
Figure 6
Overall survival analysis for the RNAs in the hub triple regulatory network (A–C) The high- and low-expression values of three hub-lncRNAs (A), four hub-miRNAs (B), and six hub-mRNAs (C) were compared by a Kaplan-Meier survival curve for TCGA HCC patient cohort. The horizontal axis indicates the overall survival time in days, and the vertical axis represents the survival rate.
Figure 7
Figure 7
Construction and correlation analysis of the ceRNA network (A) The cellular localization for three hub-lncRNAs (DLEU2L, FAM99A, and ARRDC1-AS1) was predicted using lncLocator. (B) Schematic model of ceRNA. Blue indicates downregulated; red indicates upregulated. (C) Base pairing between miR-99a-5p and miR-100-5p and the target site in the DLEU2L and TAOK1 3′ UTR predicted by TarBase and TargetScan, respectively. (D) Correlation analysis between these four predictive RNAs and PTEN in HCC.
Figure 8
Figure 8
Methylation analysis of TAOK1 (A) Differential expression of three DNA methyltransferases (DNMT1, DNMT3A, and DNMT3B). (B) Methylation was evaluated using UALCAN. (C) Methylation was assessed using DiseaseMeth version 2.0. (D) The methylation site of TAOK1 DNA sequence association with gene expression was visualized using MEXPRESS. The expression of TAOK1 is illustrated by the blue line in the center of the plot. Pearson’s correlation coefficients and p values for methylation sites and query gene expression are shown on the right side.
Figure 9
Figure 9
Correlation analysis of TAOK1 expression and immune infiltration in HCC (A) Association between TAOK1 gene copy number and immune cell infiltration levels in HCC cohorts. (B) Correlation of TAOK1 expression with immune infiltration level in HCC. (C) Kaplan-Meier plots were used to analyze the immune infiltration and overall survival rate of HCC. ∗p < 0.05, ∗∗p < 0.01, ∗∗∗p < 0.001.

References

    1. Li M., Shao J., Guo Z., Jin C., Wang L., Wang F., Jia Y., Zhu Z., Zhang Z., Zhang F. Novel mitochondrion-targeting copper(II) complex induces HK2 malfunction and inhibits glycolysis via Drp1-mediating mitophagy in HCC. J. Cell. Mol. Med. 2020;24:3091–3107. - PMC - PubMed
    1. Zhao B., Ke K., Wang Y., Wang F., Shi Y., Zheng X., Yang X., Liu X., Liu J. HIF-1α and HDAC1 mediated regulation of FAM99A-miR92a signaling contributes to hypoxia induced HCC metastasis. Signal Transduct. Target. Ther. 2020;5:118. - PMC - PubMed
    1. Li X., Wang H., Li T., Wang L., Wu X., Liu J., Xu Y., Wei W. Circulating tumor DNA/circulating tumor cells and the applicability in different causes induced hepatocellular carcinoma. Curr. Probl. Cancer. 2020;44:100516. - PubMed
    1. Hou J., Zhang H., Liu J., Zhao Z., Wang J., Lu Z., Hu B., Zhou J., Zhao Z., Feng M. YTHDF2 reduction fuels inflammation and vascular abnormalization in hepatocellular carcinoma. Mol. Cancer. 2019;18:163. - PMC - PubMed
    1. Chen Z., Zheng Z., Feng L., Huo Z., Huang L., Fu M., Chen Q., Ke Y., Yang J., Hou B. Overexpression of miR-382 sensitizes hepatocellular carcinoma cells to γδ T cells by inhibiting the expression of c-FLIP. Mol. Ther. Oncolytics. 2020;18:467–475. - PMC - PubMed

LinkOut - more resources