Transcriptome analysis reveals liver metabolism programming in kids from nutritional restricted goats during mid-gestation
- PMID: 33575124
- PMCID: PMC7849524
- DOI: 10.7717/peerj.10593
Transcriptome analysis reveals liver metabolism programming in kids from nutritional restricted goats during mid-gestation
Abstract
Background: Maternal nutrient restriction during pregnancy causes a metabolic disorder that threatens the offspring's health in humans and animals. However, the molecular mechanism of how undernutrition affecting hepatic metabolism of fetal or postnatal offspring is still unclear. We aimed to investigate transcriptomic changes of fetal livers in response to maternal malnutrition in goats during mid-gestation and to explore whether these changes would disappear when the nutrition was recovered to normal level during mid-gestation using goats (Capra hircus) as the experimental animals.
Methods: Fifty-three pregnant goats were subjected to a control (100% of the maintenance requirements, CON) or a restricted (60% of the maintenance requirements on day 45 to day 100 of gestation and then realimentation, RES) diet. A total of 16 liver samples were collected from fetal goats on day 100 of gestation and goat kids of postnatal day 90 to obtain hepatic transcriptional profiles using RNA-Seq.
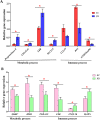
Results: Principal component analysis of the hepatic transcriptomes presented a clear separation by growth phase (fetus and kid) rather than treatment. Maternal undernutrition up-regulated 86 genes and down-regulated 76 genes in the fetal liver of the FR group as compared to the FC group. KEGG pathway analysis showed the DEGs mainly enriched in protein digestion and absorption, steroid biosynthesis, carbohydrate digestion and absorption and bile secretion. A total of 118 significant DEGs (fold change > 1.2 and FDR < 0.1) within KR vs. KC comparison was identified with 79 up-regulated genes and down-regulated 39 genes, and these DEGs mainly enriched in the biosynthesis of amino acids, citrate cycle, valine, leucine and isoleucine biosynthesis and carbon metabolism.
Conclusion: Hepatic transcriptome analysis showed that maternal undernutrition promoted protein digestion and absorption in the fetal livers, while which restrained carbohydrate metabolism and citric acid cycle in the livers of kid goats after realimentation. The results indicate that maternal undernutrition during mid-gestation causes hepatic metabolism programming in kid goats on a molecular level.
Keywords: Goat; Hepatic metabolism; Maternal undernutrition; RNA-sequencing.
©2021 Yang et al.
Conflict of interest statement
The authors declare there are no competing interests.
Figures


Similar articles
-
Evidence for liver energy metabolism programming in offspring subjected to intrauterine undernutrition during midgestation.Nutr Metab (Lond). 2019 Mar 18;16:20. doi: 10.1186/s12986-019-0346-7. eCollection 2019. Nutr Metab (Lond). 2019. PMID: 30923555 Free PMC article.
-
Transcriptome analysis reveals hepatic disordered lipid metabolism, lipotoxic injury, and abnormal development in IUGR sheep fetuses due to maternal undernutrition during late pregnancy.Theriogenology. 2024 Sep 15;226:350-362. doi: 10.1016/j.theriogenology.2024.06.020. Epub 2024 Jun 24. Theriogenology. 2024. PMID: 38968678
-
Effect of protein or energy restriction during late gestation on hormonal and metabolic status in pregnant goats and postnatal male offspring.Animal. 2015 Nov;9(11):1843-51. doi: 10.1017/S1751731115001147. Epub 2015 Aug 3. Animal. 2015. PMID: 26234201
-
The Effects of Maternal Nutrient Restriction during Mid to Late Gestation with Realimentation on Fetal Metabolic Profiles in the Liver, Skeletal Muscle, and Blood in Sheep.Metabolites. 2024 Aug 23;14(9):465. doi: 10.3390/metabo14090465. Metabolites. 2024. PMID: 39330472 Free PMC article.
-
Ontogeny and nutritional manipulation of the hepatic prolactin-growth hormone-insulin-like growth factor axis in the ovine fetus and in neonate and juvenile sheep.Proc Nutr Soc. 2004 Feb;63(1):127-35. doi: 10.1079/PNS2003324. Proc Nutr Soc. 2004. PMID: 15070443 Review.
Cited by
-
High-Throughput Sequencing Reveals Transcriptome Signature of Early Liver Development in Goat Kids.Genes (Basel). 2022 May 6;13(5):833. doi: 10.3390/genes13050833. Genes (Basel). 2022. PMID: 35627218 Free PMC article.
-
Maternal Nutrient Restriction Disrupts Gene Expression and Metabolites Associated with Urea Cycle, Steroid Synthesis, Glucose Homeostasis, and Glucuronidation in Fetal Calf Liver.Metabolites. 2022 Feb 24;12(3):203. doi: 10.3390/metabo12030203. Metabolites. 2022. PMID: 35323646 Free PMC article.
-
Prospect of potential intrauterine programming impacts associated with COVID-19.Front Public Health. 2022 Aug 24;10:986162. doi: 10.3389/fpubh.2022.986162. eCollection 2022. Front Public Health. 2022. PMID: 36091565 Free PMC article. Review.
References
-
- Bickhart DM, Rosen BD, Koren S, Sayre BL, Hastie AR, Chan S, Lee J, Lam ET, Liachko I, Sullivan ST. Single-molecule sequencing and chromatin conformation capture enable de novo reference assembly of the domestic goat genome. Nature Genetics. 2017;49:643–650. doi: 10.1038/ng.3802. - DOI - PMC - PubMed
LinkOut - more resources
Full Text Sources
Other Literature Sources

