. 2021 Jan 26:8:630246.
doi: 10.3389/fchem.2020.630246. eCollection 2020.

Confined Electrochemiluminescence Generation at Ultra-High-Density Gold Microwell Electrodes

Affiliations

Confined Electrochemiluminescence Generation at Ultra-High-Density Gold Microwell Electrodes

Jialian Ding et al. Front Chem. .

Abstract

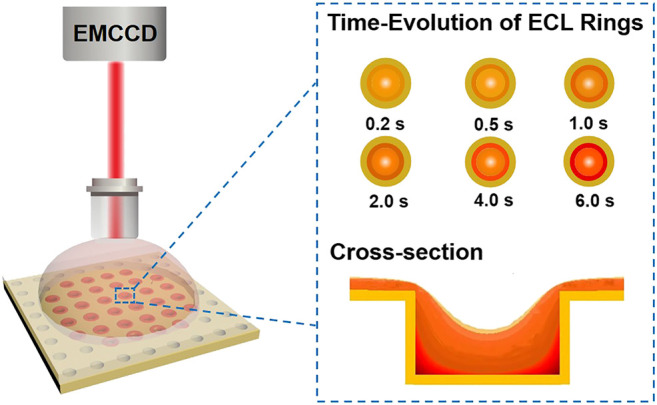
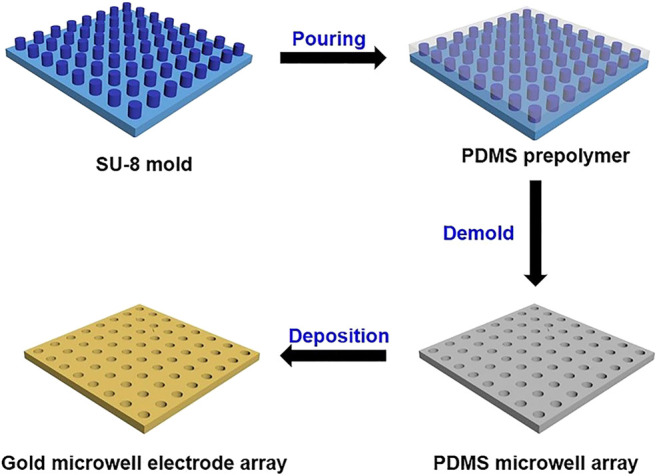
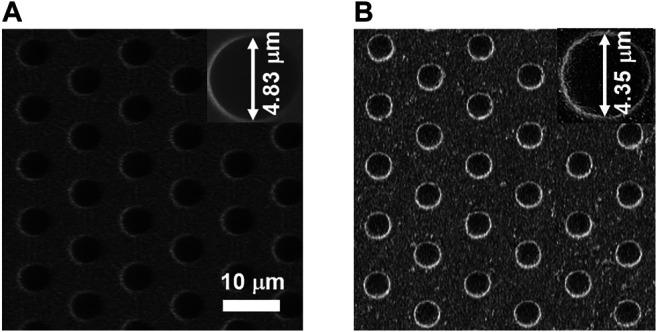
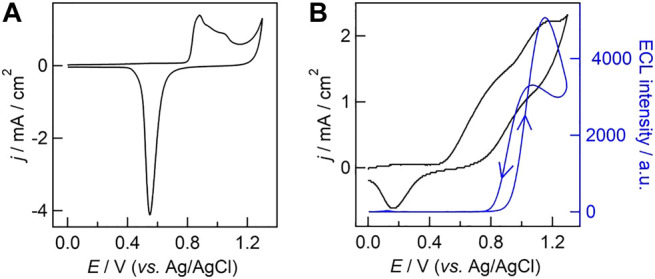
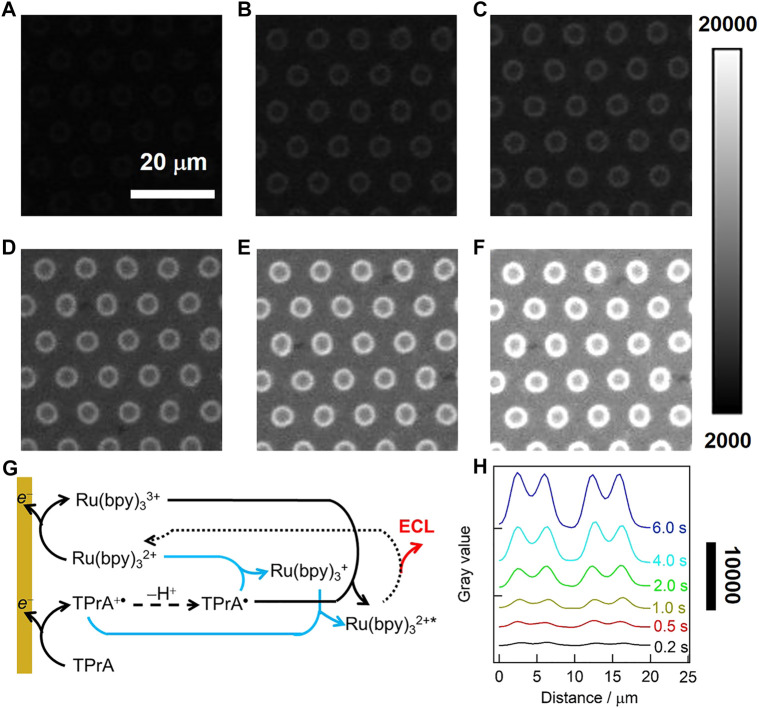
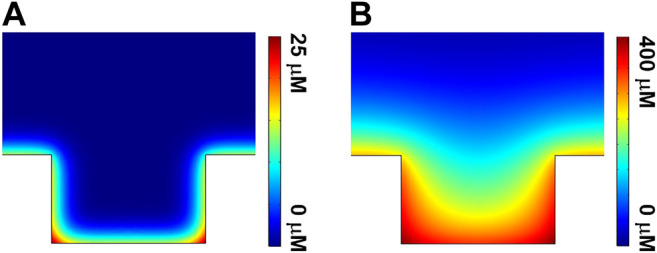
Electrochemiluminescence (ECL) imaging analysis based on the ultra-high-density microwell electrode array (UMEA) has been successfully used in biosensing and diagnostics, while the studies of ECL generation mechanisms with spatial resolution remain scarce. Herein we fabricate a gold-coated polydimethylsiloxane (PDMS) UMEA using electroless deposition method for the visualization of ECL reaction process at the single microwell level in conjunction with using microscopic ECL imaging technique, demonstrating that the microwell gold walls are indeed capable of enhancing the ECL generation. For the classical ECL system involving tris(2,2'-bipyridyl)ruthenium (Ru(bpy)3 2+) and tri-n-propylamine (TPrA), the ECL image of a single microwell appears as a surface-confined ring, indicating the ECL intensity generated inside the well is much stronger than that on the top surface of UMEA. Moreover, at a low concentration of Ru(bpy)3 2+, the ECL image remains to be ring-shaped with the increase of exposure time, because of the limited lifetime of TPrA radical cations TPrA+•. In combination with the theoretical simulation, the ring-shaped ECL image is resolved to originate from the superposition effect of the mass diffusion fields at both microwell wall and bottom surfaces.

Keywords: confinement; electrochemiluminescence; imaging; microwell electrode array; reaction mechanisms.


Conflict of interest statement

The authors declare that the research was conducted in the absence of any commercial or financial relationships that could be construed as a potential conflict of interest.

Figures

SCHEME 1
SCHEME 1
Illustration of confined ECL generation at the microwell electrode array probed by ECL microscopy. EMCCD = electron multiplying charge coupled device.
FIGURE 1
FIGURE 1
Schematic procedure for fabrication of gold-coated UMEA.
FIGURE 2
FIGURE 2
SEM images of PDMS microwell array (A) and gold-coated UMEA (B). The scale bar is 10 µm. The insets show the magnified SEM images of single microwells.
FIGURE 3
FIGURE 3
(A) Cyclic voltammogram (CV) obtained with gold-coated UMEA in 0.1 M H2SO4. (B) ECL intensity−potential curve (blue line) overlaid with CV (black line) obtained with gold-coated UMEA in phosphate buffer (PB, 0.1 M, pH 7.4) containing 500 μM Ru(bpy)3 2+ and 25 mM TPrA. The scan rate was 0.1 V/s. The photomultiplier tube was biased at 200 V.
FIGURE 4
FIGURE 4
Bright field (BF, A) and ECL (B–F) images of gold-coated UMEA in PB (0.1 M, pH 7.4) containing 50 μM Ru(bpy)3 2+ and 50 mM TPrA. The ECL imaging were triggered by a double-step potential (initial potential 0 V; respective pulse potentials 0.9, 1.0, 1.1, 1.2, 1.3 V; pulse period 2 s; pulse time 1 s). The exposure time of EMCCD was 4 s. (G) The grayscale variation of ECL along the radial direction of two adjacent microwells. (H) The variation of ECL intensity with the potential at the gold-coated UMEA at single microwell levels.
FIGURE 5
FIGURE 5
(A–F) ECL images in 0.1 M·PB (pH 7.4) containing 50 μM Ru(bpy)3 2+ and 50 mM TPrA. A double-step potential (initial potential 0 V, pulse potential 1.0 V) was applied to launch the ECL reaction. The pulse time was 0.2 s (A), 0.5 s (B), 1 s (C), 2 s (D), 4 s (E) and 6 s (F). The exposure time of EMCCD was in consistent with the time of the double-step potential. (G) ECL reaction pathways for Ru(bpy)3 2+/TPrA system at a low luminophore concentration. Oxidative reduction route (black line) is concomitant with LOP route (blue lines). (H) The grayscale variation of ECL along the radial direction of two adjacent microwells under different exposure time.
FIGURE 6
FIGURE 6
Side-view of simulated concentration contours of Ru(bpy)3 2+* at a single microwell for the cases of (A) 50 μM and (B) 500 μM Ru(bpy)3 2+.

Similar articles

Cited by

References

    1. Bist I., Bhakta S., Jiang D., Keyes T. E., Martin A., Forste R. J., et al. (2017). Evaluating metabolite-related DNA oxidation and adduct damage from aryl amines using a microfluidic ECL array. Anal. Chem. 89, 12441–12449. 10.1021/acs.analchem.7b03528 - DOI - PMC - PubMed
    1. Bottari F., Oliveri P., Ugo P. (2014). Electrochemical immunosensor based on ensemble of nanoelectrodes for immunoglobulin IgY detection: application to identify hen’s egg yolk in tempera paintings. Biosens. Bioelectron. 52, 403–410. 10.1016/j.bios.2013.09.025 - DOI - PubMed
    1. Chovin A., Garrigue P., Vinatier P., Sojic N. (2004). Development of an ordered array of optoelectrochemical individually readable sensors with submicrometer dimensions: application to remote electrochemiluminescence imaging. Anal. Chem. 76, 357–364. 10.1021/ac034974w - DOI - PubMed
    1. Cui C., Jin R., Jiang D. C., Zhang J. R., Zhu J. J. (2020). Electrogenerated chemiluminescence in submicrometer wells for very high-density biosensing. Anal. Chem. 92, 578–582. 10.1021/acs.analchem.9b04488 - DOI - PubMed
    1. Danis A. S., Potts K. P., Perry S. C., Mauzeroll J. (2018). Combined spectroelectrochemical and simulated insights into the electrogenerated chemiluminescence coreactant mechanism. Anal. Chem. 90, 7377–7382. 10.1021/acs.analchem.8b00773 - DOI - PubMed

LinkOut - more resources