. 2021 Jan;10(1):9-19.
doi: 10.21037/hbsn.2019.09.02.

Severity of early allograft dysfunction following donation after circulatory death liver transplantation: a multicentre study

Affiliations

Severity of early allograft dysfunction following donation after circulatory death liver transplantation: a multicentre study

Kun Wang et al. Hepatobiliary Surg Nutr. 2021 Jan.

Abstract

Background: Early allograft dysfunction (EAD) is associated with decreased graft and patient survival rates. This study aimed to identify the severity of EAD and develop a predictive model for EAD after donation after circulatory death (DCD) liver transplantation (LT). Furthermore, the influence of operative time on EAD incidence was also evaluated.

Methods: In this retrospective, multicentre cohort study, nomograms were established based on a single-centre training cohort (n=321) and validated in a 3-center validation cohort (n=501).

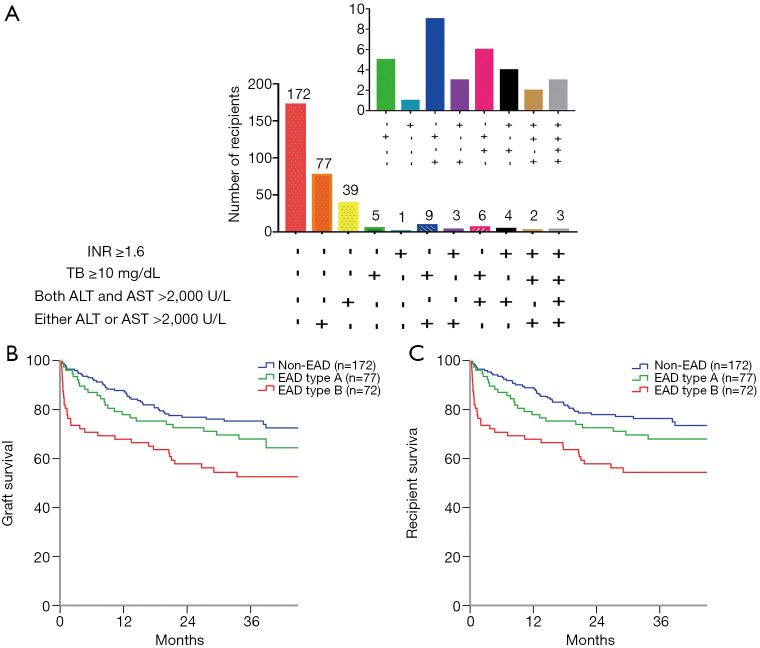
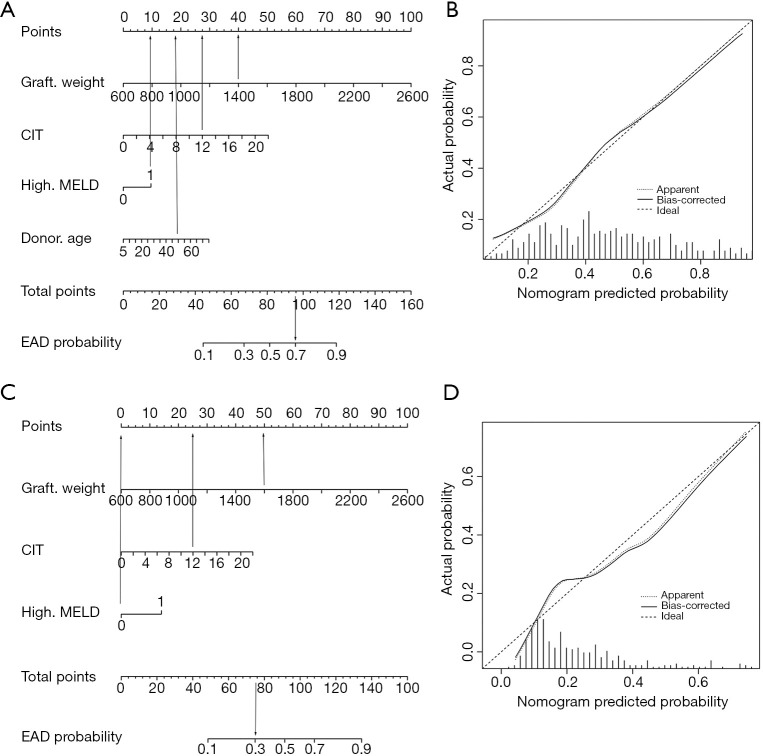
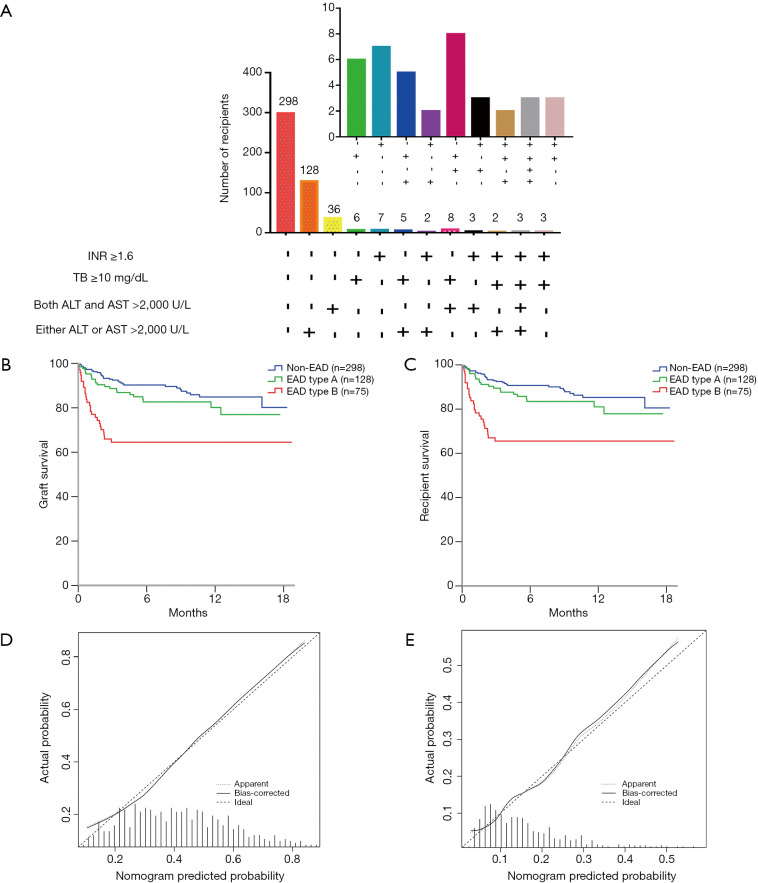
Results: The incidence rate of EAD was 46.4% (149/321) in the training cohort and 40.5% (203/501) in the validation cohort. Of the 149 EAD patients in the training cohort, 77 patients with either elevated alanine aminotransferase (ALT) or aspartate aminotransferase (AST) were classified as having EAD type A, and the rest of the EAD patients were classified as having EAD type B. Recipients with EAD type B had lower graft and patient survival rates than recipients with EAD type A (P=0.043 and 0.044, respectively). We further developed a nomogram to predict EAD (graft weight, cold ischemia time, donor age, model for end-stage liver disease (MELD) score) and another nomogram to predict EAD type B (graft weight, cold ischemia time, MELD score). The nomograms for the prediction of EAD and EAD type B had good discrimination [concordance index (C-index) =0.712 (0.666-0.758), 0.707 (0.641-0.773)] and calibration [Hosmer-Lemeshow (HL) P=0.384, P=0.425] in the validation cohort. An increased operative time (>6 h) was associated with increased EAD and EAD type B incidence in the high-risk group (P=0.005, P=0.020, respectively).

Conclusions: EAD type B was associated with decreased graft and patient survival rates. The novel nomograms effectively predicted the incidence of EAD and EAD type B in DCD LT patients.

Keywords: Liver transplantation; donation after circulatory death; early allograft dysfunction (EAD).


Conflict of interest statement

Conflicts of Interest: All authors have completed the ICMJE uniform disclosure form (available at http://dx.doi.org/10.21037/hbsn.2019.09.02). The authors have no conflicts of interest to declare.

Figures

Figure 1
Figure 1
The proportion and Kaplan-Meier curves for recipients in the training cohort (n=321). (A) The proportion of recipients based on the EAD criteria, (B) graft survival and (C) patient survival according to the EAD type. AST/ALT >2,000 U/L: alanine aminotransferase (ALT) or aspartate aminotransferase (AST) levels >2,000 U/L within the first 7 postoperative days: TB ≥10 mg/dL: total bilirubin (TB) ≥10 mg/dL on postoperative day 7; INR ≥1.6: INR ≥1.6 on postoperative day 7.
Figure 2
Figure 2
The nomograms to predict EAD and EAD type B. (A) the nomogram for the prediction of EAD. To use the nomogram, draw a line straight upward from the location on corresponding axis to the top line labeled “points”. Sum the points for all predictors then draw a line straight downward from the axis labeled “Total Points” to find the recipient’s probability of EAD. For example, in cases of a DCD liver transplant with graft weight (1,400 g), CIT (12 h), high MELD and donor age (50 years old), the points is 40, 28, 10 and 19, respectively. With the total points of 97, the predicted probability of EAD is 70%. (B) the calibration curves of the nomogram for the prediction of EAD in the internal validation. (C) the nomogram for the prediction of EAD type B. For example, in cases of a DCD liver transplant with graft weight (1,600 g), CIT (12 h), and not high MELD, the points is 50, 26 and 0, respectively. With the total points of 76, the predicted probability of EAD type B is 30%. (D) the calibration curves of the nomogram for the prediction of EAD type B in the internal validation. The unit of graft weight is gram. CIT represents cold ischemia time, and the unit is hour. High MELD represents a preoperative MELD score >30. Nomogram-predicted probability is plotted on the x-axis; actual probability is plotted on the y-axis. A plot along the ideal line indicates a perfectly calibrated nomogram in which the predicted probabilities are consistent with the actual outcomes.
Figure 3
Figure 3
The proportions, Kaplan-Meier curves and calibration plots for the recipients in the validation cohort (n=501). (A) The proportion of recipients based on the EAD criteria, (B) graft survival and (C) patient survival rates according to the EAD type, (D) calibration plots of the nomogram for the prediction of EAD in the external validation, (E) calibration plots of the nomogram for the prediction of EAD type B in the external validation. AST/ALT >2,000 U/L: alanine aminotransferase (ALT) or aspartate aminotransferase (AST) levels >2,000 U/L within the first 7 postoperative days: TB ≥10 mg/dL: total bilirubin (TB) ≥10 mg/dL on postoperative day 7; INR ≥1.6: INR ≥1.6 on postoperative day 7. Nomogram-predicted probability is plotted on the x-axis; actual probability is plotted on the y-axis. A plot along the ideal line indicates a perfectly calibrated nomogram in which the predicted probabilities are consistent with the actual outcomes.

References

    1. Lee BP, Mehta N, Platt L, et al. Outcomes of early liver transplantation for patients with severe alcoholic hepatitis. Gastroenterology 2018;155:422-30.e1. 10.1053/j.gastro.2018.04.009 - DOI - PMC - PubMed
    1. Orman ES, Mayorga ME, Wheeler SB, et al. Declining liver graft quality threatens the future of liver transplantation in the United States. Liver Transpl 2015;21:1040-50. 10.1002/lt.24160 - DOI - PMC - PubMed
    1. Kollmann D, Sapisochin G, Goldaracena N, et al. Expanding the donor pool: Donation after circulatory death and living liver donation do not compromise the results of liver transplantation. Liver Transpl 2018;24:779-89. 10.1002/lt.25068 - DOI - PMC - PubMed
    1. Okamura Y, Yagi S, Sato T, et al. Coexistence of Bilirubin ≥10 mg/dL and Prothrombin Time-International Normalized Ratio ≥1.6 on Day 7: A Strong Predictor of Early Graft Loss After Living Donor Liver Transplantation. Transplantation 2018;102:440-7. - PubMed
    1. Golse N, Guglielmo N, El MA, et al. Arterial lactate concentration at the end of liver transplantation is an early predictor of primary graft dysfunction. Ann Surg 2019;270:131-8. 10.1097/SLA.0000000000002726 - DOI - PubMed

LinkOut - more resources