. 2021 Jan;10(1):31-48.
doi: 10.21037/hbsn-20-671.

Age-specific microbiota in altering host inflammatory and metabolic signaling as well as metabolome based on the sex

Affiliations

Age-specific microbiota in altering host inflammatory and metabolic signaling as well as metabolome based on the sex

Lili Sheng et al. Hepatobiliary Surg Nutr. 2021 Jan.

Abstract

Background: Metabolism is sex-different, and the direct link between gut microbiota and aging-associated metabolic changes needs to be established in both sexes.

Methods: Gene expression, metabolic and inflammatory signaling, gut microbiota profile, and metabolome were studied during aging and after fecal microbiota transplantation (FMT) in mice of both sexes.

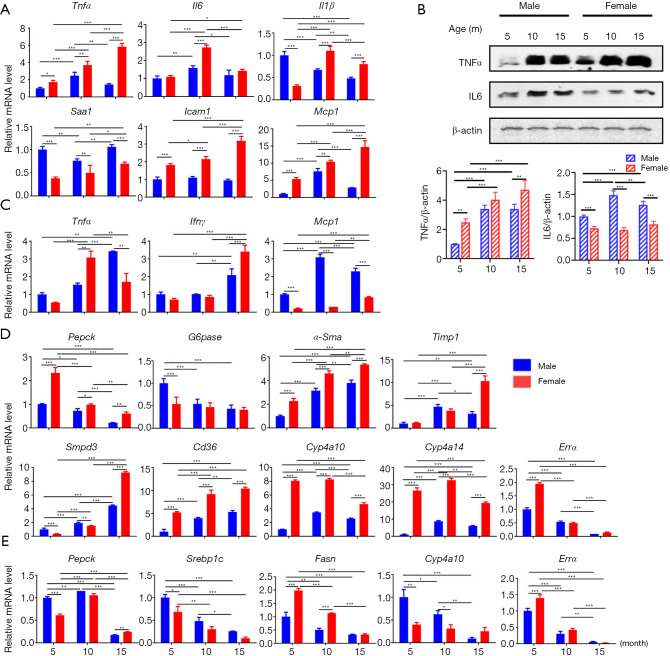
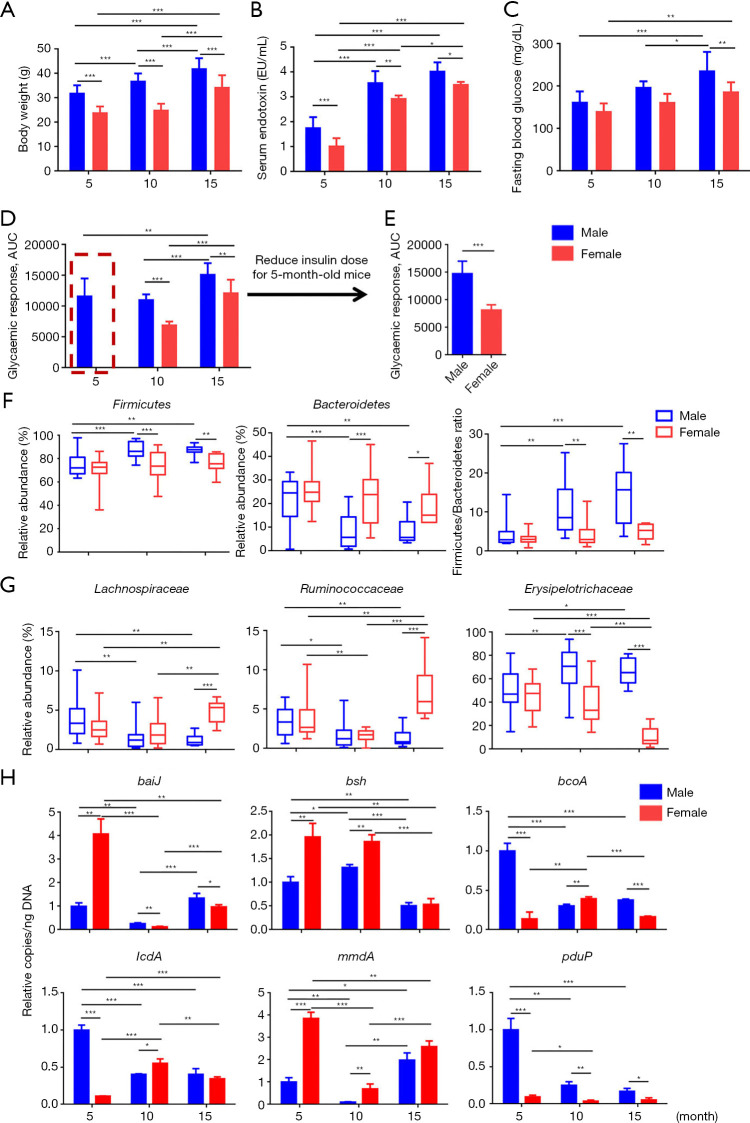
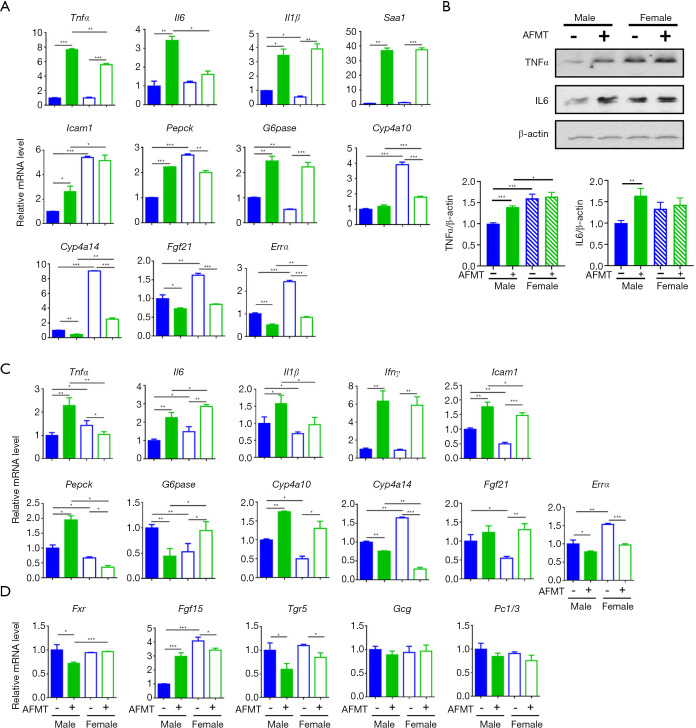
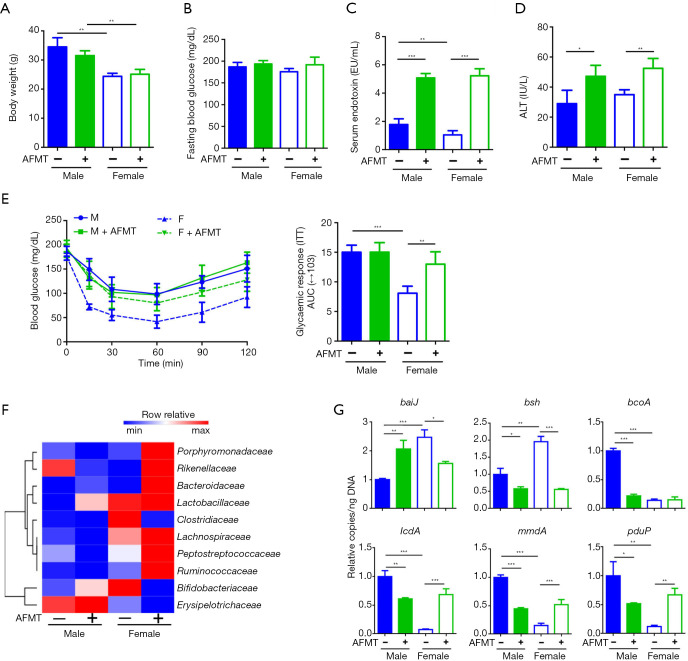
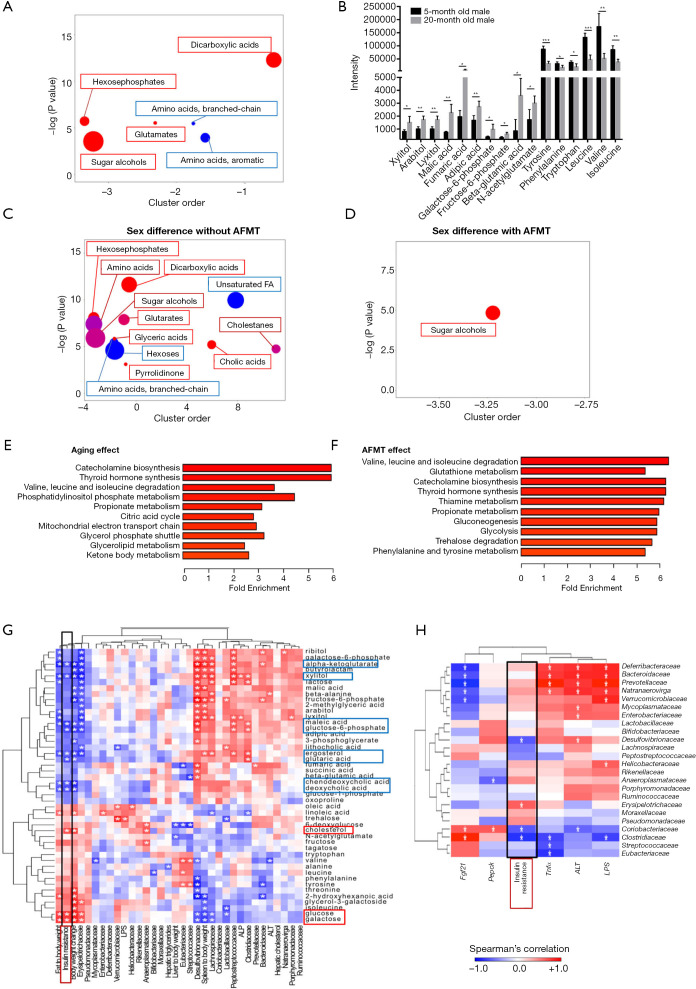
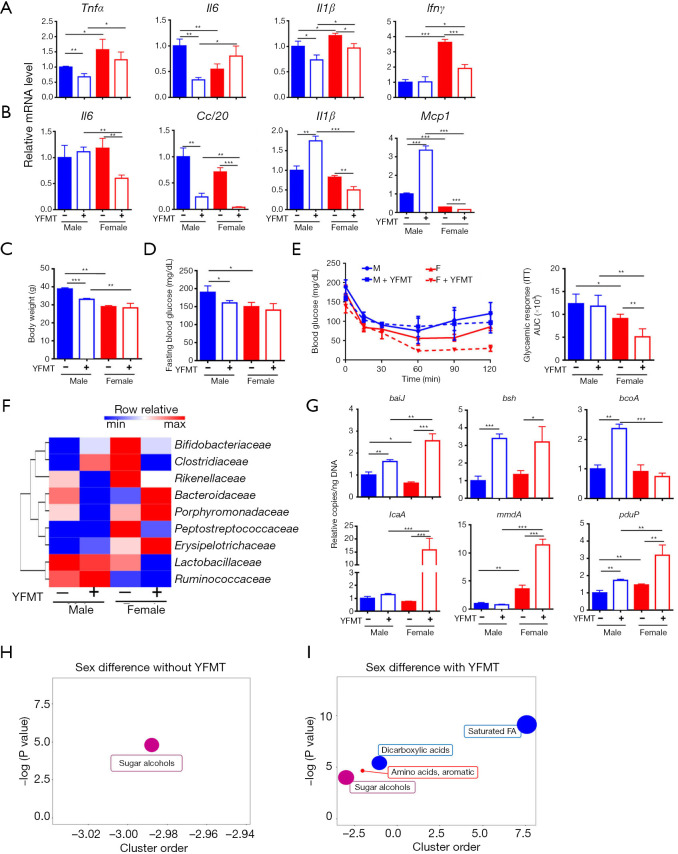
Results: Our data revealed young female mice and aged male mice were the most insulin sensitive and resistant group, respectively. In addition, aging reduced sex difference in insulin sensitivity. Such age- and sex-dependent metabolic phenotypes were accompanied by shifted gut microbiota profile and altered abundance of bacterial genes that produce butyrate, propionate, and bile acids. After receiving feces from the aged males (AFMT), the most insulin-resistant group, recipients of both sexes had increased hepatic inflammation and serum endotoxin. However, AFMT only increased insulin resistance in female mice and abolished sex difference in insulin sensitivity. Additionally, such changes were accompanied by narrowed sex difference in metabolome. Metabolomics data revealed that age-associated insulin resistance in males was accompanied by increased sugar alcohols and dicarboxylic acids as well as reduced aromatic and branched-chain amino acids. Further, receiving feces from the young females (YFMT), the most insulin-sensitive group, reduced body weight and fasting blood glucose in male recipients and improved insulin sensitivity in females, leading to enhanced sex differences in insulin sensitivity and metabolome.

Conclusions: Aging systemically affected inflammatory and metabolic signaling based on the sex. Gut microbiome is age and sex-specific, which affects inflammation and metabolism in a sex-dependent manner.

Keywords: Aging; fecal transplantation; insulin sensitivity; metabolome; microbiome.


Conflict of interest statement

Conflicts of Interest: All authors have completed the ICMJE uniform disclosure form (available at http://dx.doi.org/10.21037/hbsn-20-671). Dr. YJYW serves as an unpaid editorial board member of Hepatobiliary Surgery and Nutrition. The other authors have no conflicts of interest to declare.

Figures

Figure 1
Figure 1
Aging regulates inflammatory and metabolic signaling in the livers and adipose tissue. Hepatic inflammatory gene expression (A) and protein expression (B), inflammatory gene expression in adipose tissue (C), metabolic related gene expression in liver (D) and adipose tissue (E) in 5-, 10-, and 15-month-old mice of both sexes. n=8 per group. Data are expressed as mean ± SD. Two-way ANOVA with Tukey’s correction. *, P<0.05; **, P<0.01; ***, P<0.001. Tnfα, tumor necrosis factor alpha; Il6, interleukin 6; Il1β, interleukin 1 beta; Saa1, serum amyloid A1; Icam1, intercellular adhesion molecule 1; Mcp1, monocyte chemoattractant protein 1; Ifnγ, interferon gamma; Mcp1, monocyte chemoattractant protein 1; Pepck, phosphoenolpyruvate carboxykinase; G6pase, glucose-6-phosphatase; α-Sma, alpha smooth muscle actin; Timp1, tissue inhibitor of metalloproteinases 1; Smpd3, sphingomyelin phosphodiesterase 3; Srebp1c, sterol regulatory element-binding protein 1c.
Figure 2
Figure 2
The changes of mouse phenotype and gut microbiota profile during aging. (A) Body weight; (B) serum endotoxin (LPS); (C) fasting blood glucose level; (D,E) area under curve (AUC) of insulin tolerance test in 5-, 10-, and 15-month-old mice of both sexes. Two-way ANOVA with Tukey’s correction. (F,G) Relative abundance of fecal microbiota changes at phylum (F) and family (G) level. (H) Targeted functional quantitative PCR analysis of microbial genes. Kruskal-Wallis test. Copy number per ng DNA was calculated in each group and the relative changes to 5-month-old male mice were shown. n=6–8 per group. *, P<0.05; **, P<0.01; ***, P<0.001. baiJ, bile acid inducible operon gene J; bsh, bile salt hydrolase.
Figure 3
Figure 3
Transplantation of aged male fecal microbiota causes systemic inflammation and metabolic disorders. The expression of inflammation and metabolism related genes and protein in the liver (A,B), adipose tissue (C), and ileum (D) in mice of both sexes with and without aged male fecal microbiota transplantation (AFMT). n=4 per group. Data are expressed as mean ± SD. One-way ANOVA with Tukey’s correction. *, P<0.05; **, P<0.01; ***, P<0.001. Tnfα, tumor necrosis factor alpha; Il6, interleukin 6; Il1β, interleukin 1 beta; Saa1, serum amyloid A1; Icam1, intercellular adhesion molecule 1; Pepck, phosphoenolpyruvate carboxykinase; G6pase, glucose-6-phosphatase; Ifnγ, interferon gamma; Tgr5, Takeda G protein receptor 5.
Figure 4
Figure 4
The changes of mouse phenotype and microbiota profile by aged male fecal microbiota transplantation (AFMT). (A) Body weight; (B) fasting blood glucose level; (C) serum endotoxin; (D) serum alanine transaminase (ALT); (E) insulin tolerance test after AFMT; (F) a heat map of fecal microbiota changes at family level; (G) targeted functional quantitative PCR analysis of microbial genes. n=4 per group. Data are expressed as mean ± SD. One-way ANOVA with Tukey’s correction. *, P<0.05; **, P<0.01; ***, P<0.001. baiJ, bile acid inducible operon gene J; bsh, bile salt hydrolase.
Figure 5
Figure 5
Untargeted metabolomics study of aged male fecal microbiota transplantation (AFMT) and Spearman’s correlation between metabolites, phenotypes, and bacterial family. ChemRICH metabolite set enrichment statistics plot (A) and the intensity of metabolites detected by GC-TOFMS (B) in 5- and 20-month-old male mice. The node color shows increased (red) or decreased (blue) metabolite sets in 20-month-old compared to 5-month-old mice (A). The node sizes represent the total number of metabolites in each cluster set. ChemRICH metabolite set enrichment statistics plot showed sex difference in metabolite set without (female control vs. male control) (C) and with AFMT (female + AFMT vs. male + AFMT) (D). Metabolite set enrichment analysis due to aging effect (5-month-old male vs. 20-month-old male) (E) and AFMT effect (5-month-old male with and without aged fecal microbiota transplantation) (F). n=4 per group. Data are expressed as mean ± SD. Student’s t-test. *, P<0.05; **, P<0.01; ***, P<0.001. GC-TOFMS, gas chromatography time-of-flight mass spectrometry. (G) Spearman’s correlation analysis of metabolites with phenotypes and bacterial families. (H) Spearman’s correlation analysis of bacterial families with phenotypes and hepatic gene expression.
Figure 6
Figure 6
The changes of mouse phenotype and microbiota profile as well as untargeted metabolomics study after young female fecal microbiota transplantation (YFMT). (A) Hepatic gene expression; (B) hepatic protein level; (C) body weight; (D) fasting blood glucose level; (E) insulin tolerance test after YFMT; (F) a heat map of fecal microbiota changes at family level; (G) targeted functional quantitative PCR analysis of microbial genes. Copy number per ng DNA was calculated in each group and the relative changes to 11.5-month-old male mice were shown. ChemRICH metabolite set enrichment statistics plot showed sex difference in metabolite set without (male control vs. female control) (H) and with YFMT (male + YFMT vs. female + YFMT) (I). n=3–4 per group. Data are expressed as mean ± SD. One-way ANOVA with Tukey’s correction. *, P<0.05; **, P<0.01; ***, P<0.001. Tnfα, tumor necrosis factor alpha; Il6, interleukin 6; Il1β, interleukin 1 beta; Ifnγ, interferon gamma; Mcp1, monocyte chemoattractant protein 1; baiJ, bile acid inducible operon gene J; bsh, bile salt hydrolase.

References

    1. Boulange CL, Neves AL, Chilloux J, et al. Impact of the gut microbiota on inflammation, obesity, and metabolic disease. Genome Med 2016;8:42. 10.1186/s13073-016-0303-2 - DOI - PMC - PubMed
    1. Wang L, Wan YY. The role of gut microbiota in liver disease development and treatment. Liver Res 2019;3:3-18. 10.1016/j.livres.2019.02.001 - DOI - PMC - PubMed
    1. Rea IM, Gibson DS, McGilligan V, et al. Age and Age-Related Diseases: Role of Inflammation Triggers and Cytokines. Front Immunol 2018;9:586. 10.3389/fimmu.2018.00586 - DOI - PMC - PubMed
    1. Belikov AV. Age-related diseases as vicious cycles. Ageing Res Rev 2019;49:11-26. 10.1016/j.arr.2018.11.002 - DOI - PubMed
    1. Vaiserman AM, Koliada AK, Marotta F. Gut microbiota: A player in aging and a target for anti-aging intervention. Ageing Res Rev 2017;35:36-45. 10.1016/j.arr.2017.01.001 - DOI - PubMed

LinkOut - more resources