

Racial, Ethnic, and Geographic Disparities in Novel Coronavirus (Severe Acute Respiratory Syndrome Coronavirus 2) Test Positivity in North Carolina
- PMID: 33575416
- PMCID: PMC7499753
- DOI: 10.1093/ofid/ofaa413
Racial, Ethnic, and Geographic Disparities in Novel Coronavirus (Severe Acute Respiratory Syndrome Coronavirus 2) Test Positivity in North Carolina
Abstract
Background: Emerging evidence suggests that black and Hispanic communities in the United States are disproportionately affected by coronavirus disease 2019 (COVID-19). A complex interplay of socioeconomic and healthcare disparities likely contribute to disproportionate COVID-19 risk.
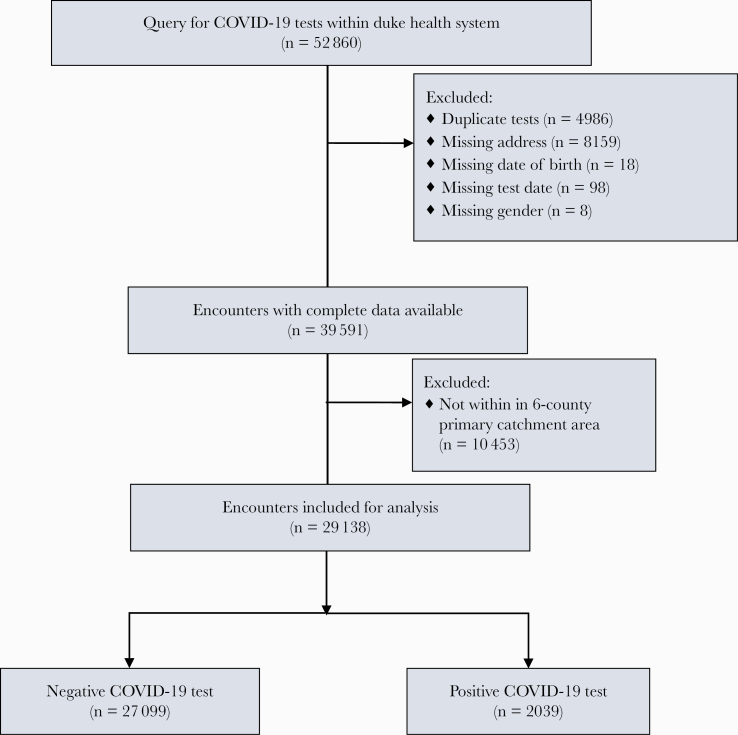
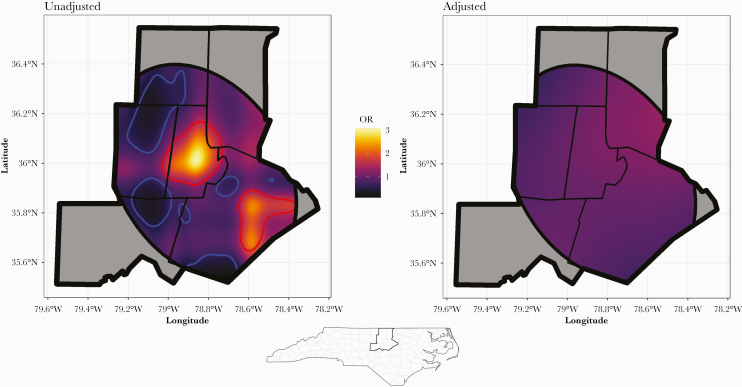
Methods: We conducted a geospatial analysis to determine whether individual- and neighborhood-level attributes predict local odds of testing positive for severe acute respiratory syndrome coronavirus 2 (SARS-CoV-2). We analyzed 29 138 SARS-CoV-2 tests within the 6-county catchment area for Duke University Health System from March to June 2020. We used generalized additive models to analyze the spatial distribution of SARS-CoV-2 positivity. Adjusted models included individual-level age, gender, and race, as well as neighborhood-level Area Deprivation Index, population density, demographic composition, and household size.
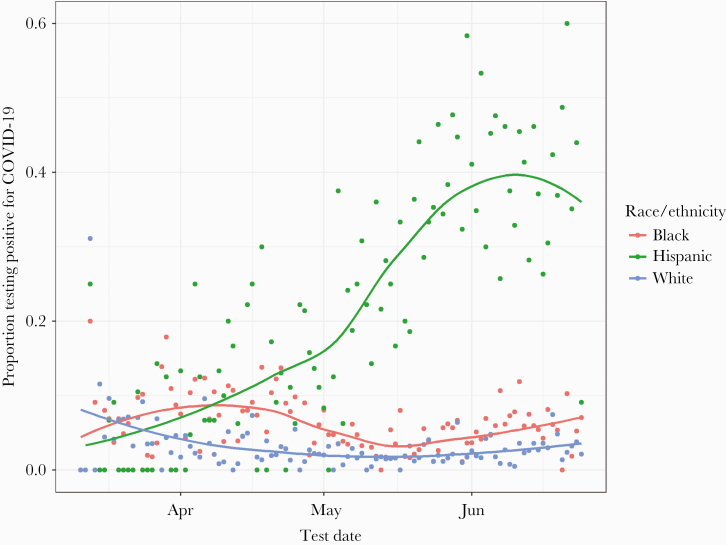
Results: Our dataset included 27 099 negative and 2039 positive unique SARS-CoV-2 tests. The odds of a positive SARS-CoV-2 test were higher for males (odds ratio [OR], 1.43; 95% credible interval [CI], 1.30-1.58), blacks (OR, 1.47; 95% CI, 1.27-1.70), and Hispanics (OR, 4.25; 955 CI, 3.55-5.12). Among neighborhood-level predictors, percentage of black population (OR, 1.14; 95% CI, 1.05-1.25), and percentage Hispanic population (OR, 1.23; 95% CI, 1.07-1.41) also influenced the odds of a positive SARS-CoV-2 test. Population density, average household size, and Area Deprivation Index were not associated with SARS-CoV-2 test results after adjusting for race.
Conclusions: The odds of testing positive for SARS-CoV-2 were higher for both black and Hispanic individuals, as well as within neighborhoods with a higher proportion of black or Hispanic residents-confirming that black and Hispanic communities are disproportionately affected by SARS-CoV-2.
Keywords: Bayesian statistics; COVID-19; SARS-CoV-2; disparities; geographic information systems.
© The Author(s) 2020. Published by Oxford University Press on behalf of Infectious Diseases Society of America.
Figures
Similar articles
-
Beyond the 405 and the 5: Geographic Variations and Factors Associated With Severe Acute Respiratory Syndrome Coronavirus 2 (SARS-CoV-2) Positivity Rates in Los Angeles County.Clin Infect Dis. 2021 Nov 2;73(9):e2970-e2975. doi: 10.1093/cid/ciaa1692. Clin Infect Dis. 2021. PMID: 33141164 Free PMC article.
-
Disparities in SARS-CoV-2 Positivity Rates: Associations with Race and Ethnicity.Popul Health Manag. 2021 Feb;24(1):20-26. doi: 10.1089/pop.2020.0163. Epub 2020 Sep 23. Popul Health Manag. 2021. PMID: 32985959 Free PMC article.
-
Dialysis, COVID-19, Poverty, and Race in Greater Chicago: An Ecological Analysis.Kidney Med. 2020 Sep-Oct;2(5):552-558.e1. doi: 10.1016/j.xkme.2020.06.005. Epub 2020 Jul 30. Kidney Med. 2020. PMID: 32838290 Free PMC article.
-
Assessment of 135 794 Pediatric Patients Tested for Severe Acute Respiratory Syndrome Coronavirus 2 Across the United States.JAMA Pediatr. 2021 Feb 1;175(2):176-184. doi: 10.1001/jamapediatrics.2020.5052. JAMA Pediatr. 2021. PMID: 33226415 Free PMC article.
-
Coronavirus Disease 2019-Related Health Disparities in Ophthalmology with a Retrospective Analysis at a Large Academic Public Hospital.Adv Ophthalmol Optom. 2022 Aug;7(1):311-323. doi: 10.1016/j.yaoo.2022.04.005. Epub 2022 Apr 22. Adv Ophthalmol Optom. 2022. PMID: 35474943 Free PMC article. Review.
Cited by
-
Pharmacist-provided SARS-CoV-2 testing targeting a majority-Hispanic community during the early COVID-19 pandemic: Results of a patient perception survey.J Am Pharm Assoc (2003). 2022 Jan-Feb;62(1):187-193. doi: 10.1016/j.japh.2021.08.015. Epub 2021 Aug 19. J Am Pharm Assoc (2003). 2022. PMID: 34465524 Free PMC article.
-
Inclusive research and social determinants of health: 2 critical concepts at the forefront of furthering our understanding of COVID-19's impact on sleep and resilience.J Clin Sleep Med. 2021 Feb 1;17(2):117-118. doi: 10.5664/jcsm.9038. J Clin Sleep Med. 2021. PMID: 33283750 Free PMC article.
-
Small Towns, Big Cities: Rural and Urban Disparities Among Hospitalized Patients With COVID-19 in the Central Savannah River Area.Open Forum Infect Dis. 2022 Feb 2;9(3):ofac050. doi: 10.1093/ofid/ofac050. eCollection 2022 Mar. Open Forum Infect Dis. 2022. PMID: 35198652 Free PMC article.
-
Descriptive Assessment of Race, Ethnicity, Comorbidities, and SARS-CoV-2 Infection- Fatality in North Carolina.N C Med J. 2023 Mar;84(2):134-142. doi: 10.18043/001c.73026. N C Med J. 2023. PMID: 39302335
-
Promoting Latinx health equity through community-engaged policy and practice reforms in North Carolina.Front Public Health. 2023 Nov 23;11:1227853. doi: 10.3389/fpubh.2023.1227853. eCollection 2023. Front Public Health. 2023. PMID: 38074704 Free PMC article.
References
-
- Centers for Disease Control and Prevention. Coronavirus disease 2019 (COVID-19) cases in the U.S. 2020. Available at: https://www.cdc.gov/coronavirus/2019-ncov/cases-updates/cases-in-us.html. Accessed 28 October 2020..
-
- HIPxChange. Area deprivation index databases. Available at: https://www.hipxchange.org/ADI. Accessed 28 October 2020.
LinkOut - more resources
Full Text Sources
Miscellaneous
