. 2019 Oct 5;2(1):lqz007.
doi: 10.1093/nargab/lqz007. eCollection 2020 Mar.

Identifying microbial species by single-molecule DNA optical mapping and resampling statistics

Affiliations

Identifying microbial species by single-molecule DNA optical mapping and resampling statistics

Arno Bouwens et al. NAR Genom Bioinform. .

Abstract

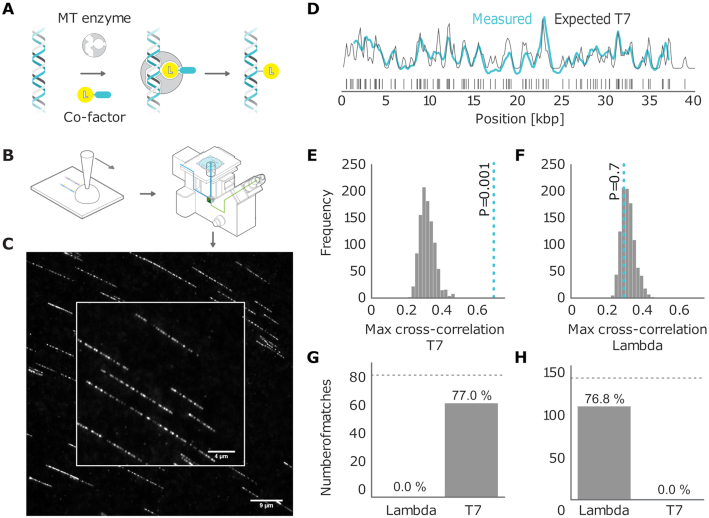
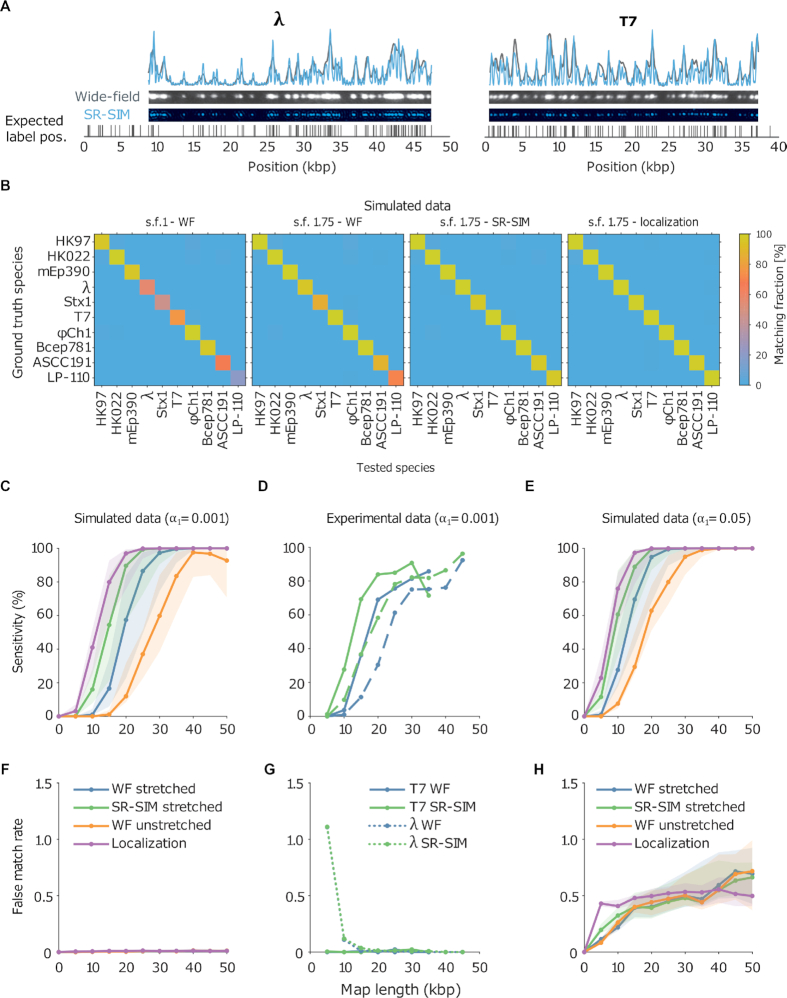
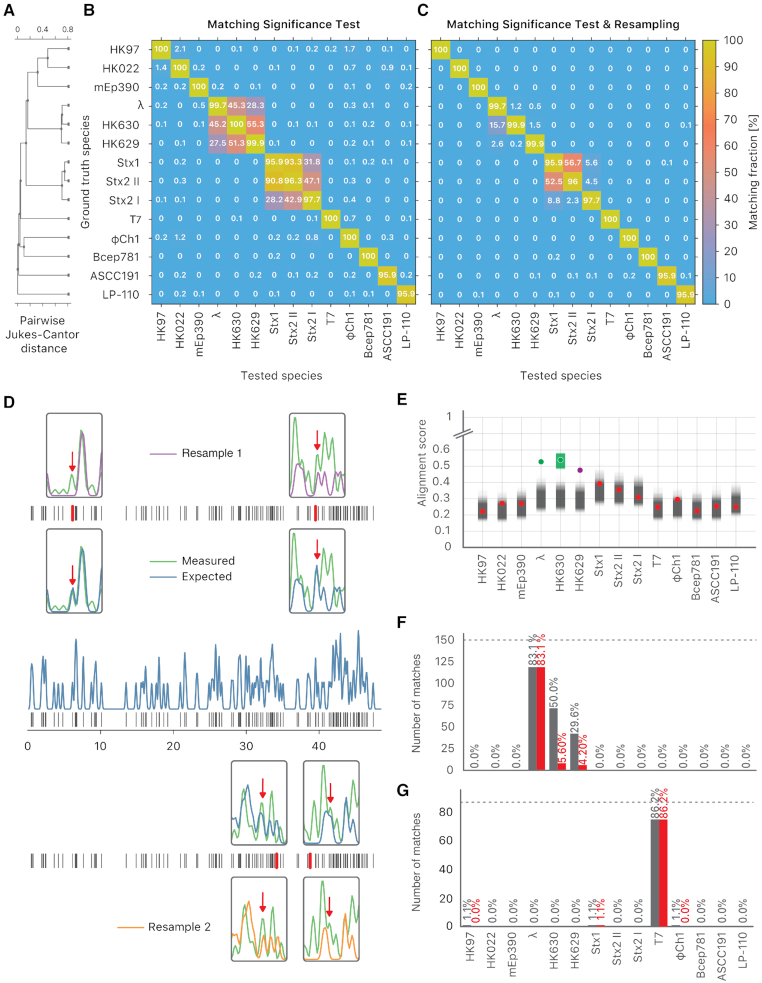
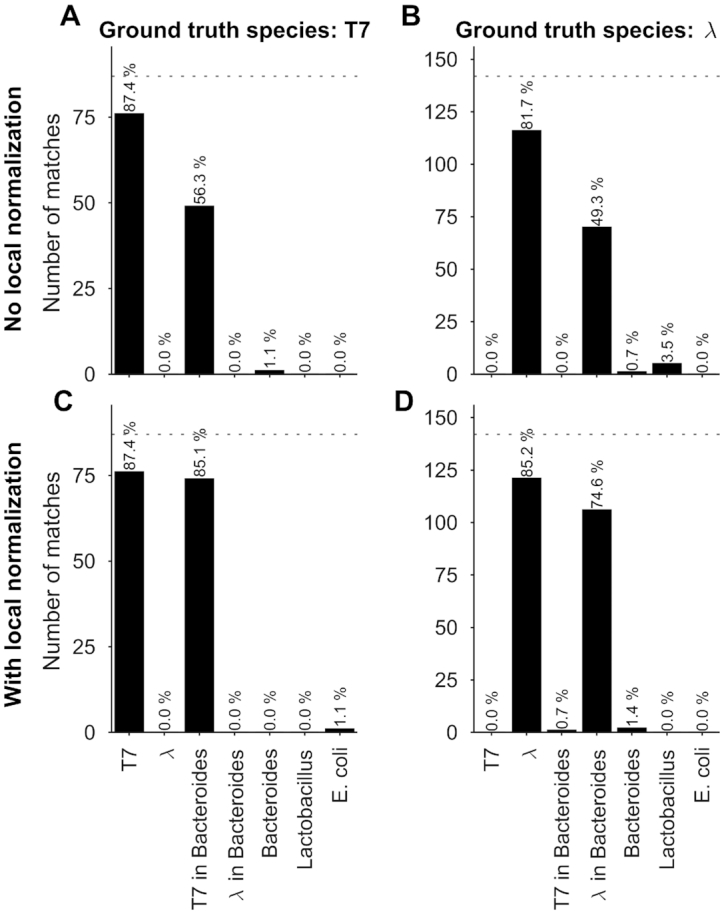
Single-molecule DNA mapping has the potential to serve as a powerful complement to high-throughput sequencing in metagenomic analysis. Offering longer read lengths and forgoing the need for complex library preparation and amplification, mapping stands to provide an unbiased view into the composition of complex viromes and/or microbiomes. To fully enable mapping-based metagenomics, sensitivity and specificity of DNA map analysis and identification need to be improved. Using detailed simulations and experimental data, we first demonstrate how fluorescence imaging of surface stretched, sequence specifically labeled DNA fragments can yield highly sensitive identification of targets. Second, a new analysis technique is introduced to increase specificity of the analysis, allowing even closely related species to be resolved. Third, we show how an increase in resolution improves sensitivity. Finally, we demonstrate that these methods are capable of identifying species with long genomes such as bacteria with high sensitivity.


Figures

Figure 1.
Figure 1.
(A) Graphical sketch of the enzymatic labeling procedure. (B) After enzymatic labeling, DNA fragments are surface deposited and overstretched using a ‘rolling droplet’ procedure (28), followed by fluorescence imaging. (C) Representative image of labeled T7 DNA molecules stretched on a coated coverslip, obtained by wide-field fluorescence microscopy imaging. (D) Measured DNA map of one of the imaged molecules (cyan) overlaid with the T7 expected DNA map (black). (E and F) Histograms of the randomized matching scores corresponding to the maximum cross-correlations of the measured DNA map with the reshuffled expected DNA maps of T7 and lambda. The vertical dotted line indicates the observed matching score of the measured DNA map with the expected DNA map, with low formula image-value for T7 (ground truth) (E) and high formula image-value for lambda (control) (F). (G) Results of the matching of 87 T7 DNA molecules imaged by wide-field microscopy to the expected DNA maps of bacteriophages lambda and T7 (formula image). (H) Results of the matching of 142 lambda DNA molecules imaged by wide-field microscopy to the expected DNA maps of bacteriophages lambda and T7 (formula image). The horizontal dotted line indicates the total amount of DNA maps concerned.
Figure 2.
Figure 2.
(A) Examples of experimental microscopy images of bacteriophage lambda and T7 DNA fragments, obtained in wide-field (blue) and by SR-SIM (green). The corresponding fluorescence intensity traces are shown at the top. The traces are placed at the location of the genome found by maximizing the cross-correlation as described in the ‘Materials and Methods’ section. The black vertical lines below the traces indicate the expected dye positions (i.e. the locations of the recognition sequence in the full genome). (B) Assignation matrices for 10000 simulated DNA fragments drawn from the full genome of 10 different bacteriophage species and matched to the same 10 species. Significance threshold formula image. Different methods for collecting the DNA fragment measurements are compared. From left to right: Unstretched DNA fragments imaged by wide-field microscopy; Overstretched DNA fragments (stretching factor 1.75) imaged by wide-field microscopy; Overstretched DNA fragments (stretching factor 1.75) imaged by SR-SIM microscopy; Overstretched DNA fragments (stretching factor 1.75) imaged by localization microscopy. See Supplementary Section S3.3, for more detailed versions of the assignation matrices. (C) Simulated data: Bacteriophage identification sensitivity as a function of simulated DNA fragment length (). Solid lines indicate the median sensitivity over all the 10 species. The shaded areas are circumscribed by the 25th and the 75th percentile of the sensitivity values obtained for the set of 10 different species. (D) Experimental data: Identification sensitivity as a function of DNA fragment length (formula image). (E) Simulated data: Identification sensitivity as a function of simulated DNA fragment length (formula image). (F) Simulated data: False matching rate as a function of simulated DNA fragment length (formula image). The shaded areas are circumscribed by the 25th and the 75th percentile of the false matching rate values obtained for the set of 10 different species. (G) Experimental data: False matching rate as a function of DNA fragment length (formula image). (H) Simulated data: False matching rate as a function of simulated DNA fragment length (formula image).
Figure 3.
Figure 3.
The resampling step improves specificity. (A) Phylogenetic tree of the selected bacteriophages, constructed from the pairwise Jukes-Cantor distance between their sequences. (B) Assignation matrix showing matching percentages yielded by the matching significance test for 1000 simulated wide-field data traces per ground truth species. Significance threshold formula image. Note how the regions of confusion between species correspond to short sequence distances in panel (A). (C) Assignation matrix showing matching percentages yielded by the matching significance test and the resampling step for the same data traces as in panel (B). Significance threshold formula image. Note the reduced confusion in the regions of short sequence distances. (D) Schematic representation of the resampling step. Intensity trace of a measured lambda DNA molecule (green) overlaid with the ideal trace of the same molecule (blue). Underlying dye locations are indicated by black vertical lines. The resampling of the ideal trace is performed by randomly removing two dye locations (red vertical lines) from the matching region (gray box). Two examples of resampled ideal traces are shown (orange and purple). (E) Schematic representation showing the distributions of the maximum cross-correlation scores yielded by the matching significance test and the resampling step, respectively. Experimental data for one measured lambda DNA molecule. The scores for the expected DNA traces are shown by colored dots. The greyscale distributions refer to the randomized scores used for the matching significance test. Red dots indicate nonsignificant scores (formula image). The green and purple dots indicate significant scores (formula image). The highest score was found for the tested species HK630 whose ideal trace is therefore resampled within the matching region (green distribution). The score for the tested species lambda was found to be reasonably drawn from the green distribution. The additional match to HK629 can be safely ruled out since its score falls significantly outside the green distribution. The algorithm therefore assigns the DNA map to HK630 and lambda at the same time. (F, gray bars) Results of the matching of 142 lambda DNA molecules, yielded by the matching significance test (experimental data, SR-SIM microscopy, formula image). The dotted line indicates the total amount of DNA maps concerned. (F, red bars) Results of the matching of the same molecules, yielded by additionally applying the resampling step (formula image). (G, gray bars) Results of the matching of 87 T7 DNA molecules, yielded by the matching significance test (experimental data, SR-SIM microscopy, formula image). The dotted line indicates the total amount of DNA maps concerned. (G, red bars) Results of the matching of the same molecules yielded by additionally applying the resampling step (formula image).
Figure 4.
Figure 4.
Identification of bacteria simulated by using experimental bacteriophage data recorded with SR-SIM. Results of the matching of bacteriophage T7 and lambda DNA molecules to phage and artificial bacterial genomes, yielded by matching significance testing (formula image). (A) Ground truth species: T7, no local normalization. (B) Ground truth species: lambda, no local normalization. (C) Ground truth species: T7, 5kb-window local normalization. (D) Ground truth species: lambda, 5kb-window local normalization.
Figure 5.
Figure 5.
(A) Schematic representation of the genetic content of V. Harveyi. (B) Abundance of chromosome #1 (accession number CP000789.1), chromosome #2 (accession number CP000790.1) and plasmids (accession number CP000791.1) relative to the total amount of assigned optical maps sampled from V. Harveyi DNA (formula image, formula image, 5 kb-window local normalization). The results reflect the expected occurrence of the three different constituents.

References

    1. White R.A., Callister S.J., Moore R.J., Baker E.S., Jansson J.K., White R. III, J Callister S., Moore R.J., Baker E.S., Jansson J.K. et al. .. The past, present and future of microbiome analyses. Nat. Protoc. 2016; 11:2049–2053.
    1. Shreiner A.B., Kao J.Y., Young V.B.. The gut microbiome in health and in disease. Curr. Opin. Gastroenterol. 2015; 31:69–75. - PMC - PubMed
    1. Huttenhower C., Gevers D., Knight R., Abubucker S., Badger J.H., Chinwalla A.T., Creasy H.H., Earl A.M., FitzGerald M.G., Fulton R.S. et al. .. Structure, function and diversity of the healthy human microbiome. Nature. 2012; 486:207–214. - PMC - PubMed
    1. Cho I., Blaser M.J.. The human microbiome: at the interface of health and disease. Nat. Rev. Genet. 2012; 13:260–270. - PMC - PubMed
    1. Columpsi P., Sacchi P., Zuccaro V., Cima S., Sarda C., Mariani M., Gori A., Bruno R.. Beyond the gut bacterial microbiota: The gut virome. J. Med. Virol. 2016; 88:1467–1472. - PMC - PubMed

LinkOut - more resources