. 2020 May 25;2(2):lqaa037.
doi: 10.1093/nargab/lqaa037. eCollection 2020 Jun.

Benchmarking of long-read correction methods

Affiliations

Benchmarking of long-read correction methods

Juliane C Dohm et al. NAR Genom Bioinform. .

Abstract

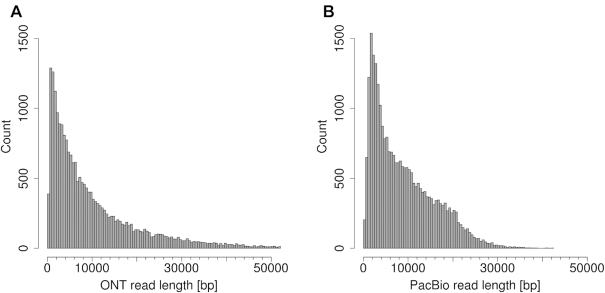
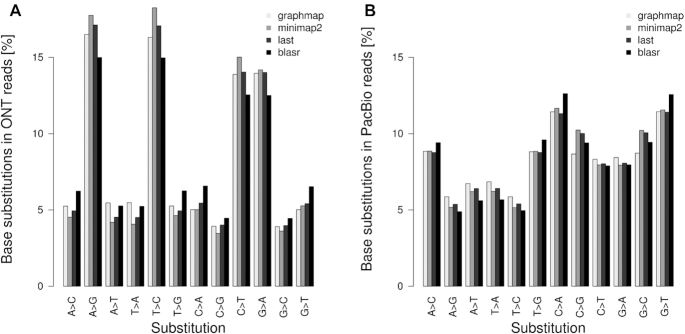
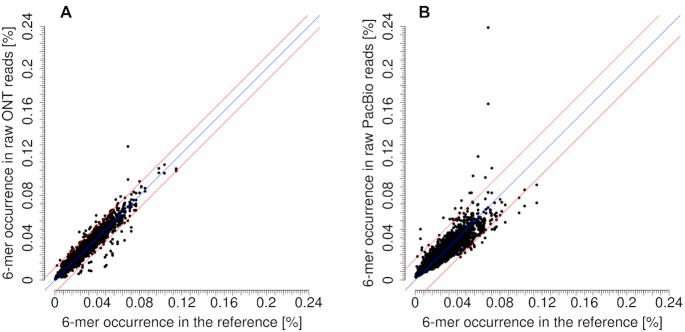
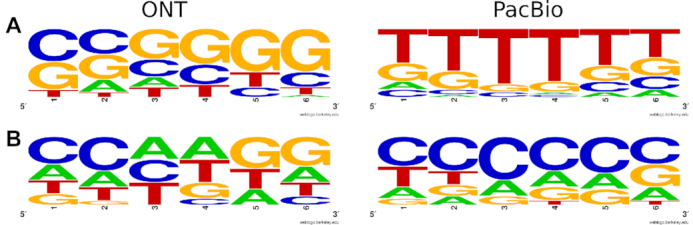
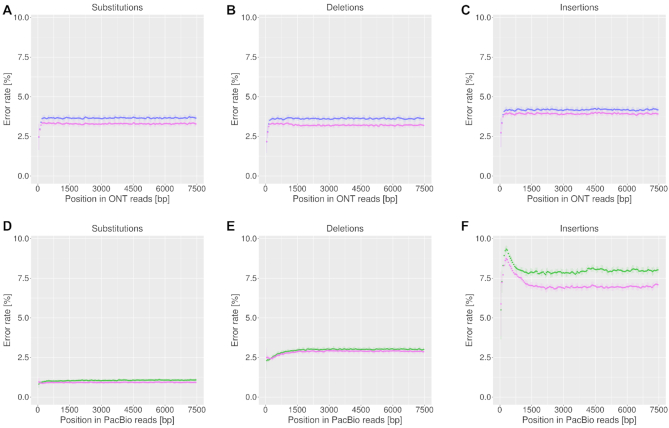
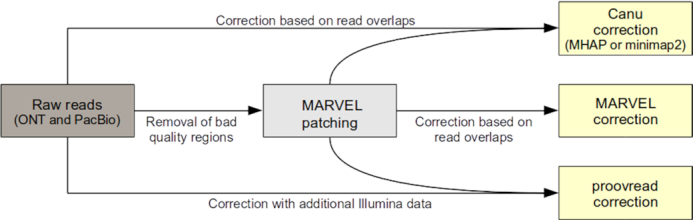
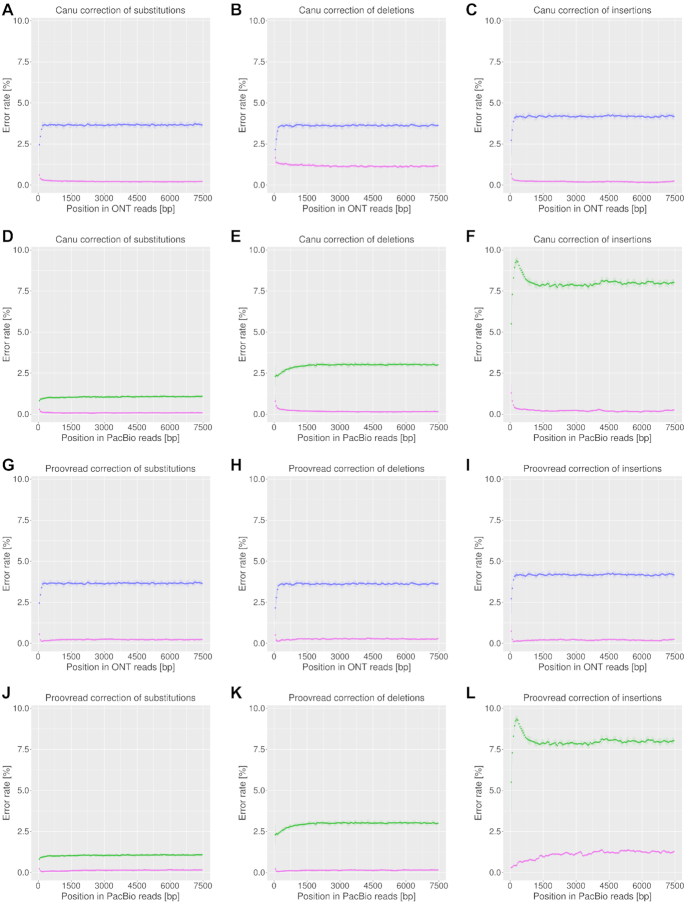
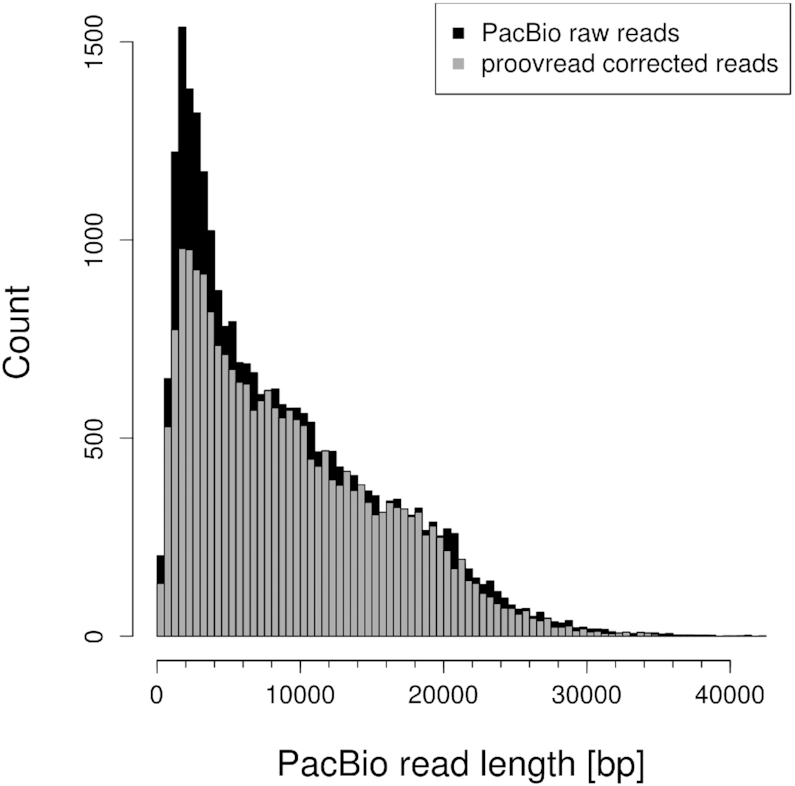
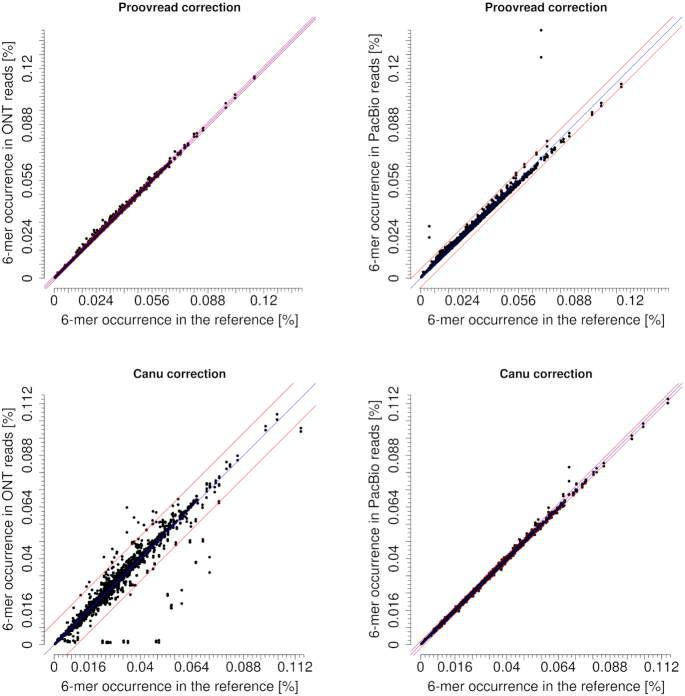
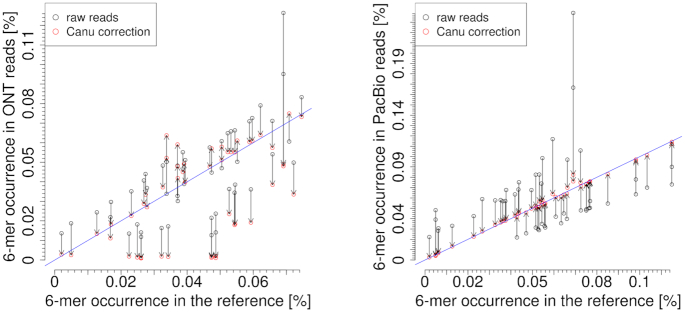
Third-generation sequencing technologies provided by Pacific Biosciences and Oxford Nanopore Technologies generate read lengths in the scale of kilobasepairs. However, these reads display high error rates, and correction steps are necessary to realize their great potential in genomics and transcriptomics. Here, we compare properties of PacBio and Nanopore data and assess correction methods by Canu, MARVEL and proovread in various combinations. We found total error rates of around 13% in the raw datasets. PacBio reads showed a high rate of insertions (around 8%) whereas Nanopore reads showed similar rates for substitutions, insertions and deletions of around 4% each. In data from both technologies the errors were uniformly distributed along reads apart from noisy 5' ends, and homopolymers appeared among the most over-represented kmers relative to a reference. Consensus correction using read overlaps reduced error rates to about 1% when using Canu or MARVEL after patching. The lowest error rate in Nanopore data (0.45%) was achieved by applying proovread on MARVEL-patched data including Illumina short-reads, and the lowest error rate in PacBio data (0.42%) was the result of Canu correction with minimap2 alignment after patching. Our study provides valuable insights and benchmarks regarding long-read data and correction methods.


Figures

Figure 1.
Figure 1.
Read length distributions up to 50 kbp for ONT (A) and PacBio (B). The longest ONT read was 136 kbp.
Figure 2.
Figure 2.
Base substitution rates of aligned reads by four alignment methods for ONT (A) and PacBio (B) sequencing data. Rates were determined by NanoOK and in-house scripts.
Figure 3.
Figure 3.
Comparison of occurrences of six-mers in the reference genomes and the raw read datasets of ONT (A) and PacBio (B). The diagonal blue line stands for perfect representation. The two red lines show the 3-fold standard deviation (ONT stddev = 0.0039, PacBio stddev = 0.0066).
Figure 4.
Figure 4.
Sequence logos of the top 30 over-represented (A) six-mers (excluding homopolymers) and top 30 under-represented (B) six-mers in the raw read datasets of ONT (left) and PacBio (right) compared to the reference.
Figure 5.
Figure 5.
Error distribution along raw PacBio reads (green) and raw ONT reads (purple) for substitutions (A, D), deletions (B, E) and insertions (C, F). Error rates slightly decreased after MARVEL patching (pink). The error rates were determined in sliding windows of length 1 kbp with 0.5 kbp overlap for positions 1–7500 of reads longer than 7500 bp. Error bars show the standard deviation per window.
Figure 6.
Figure 6.
Workflow of the applied correction steps.
Figure 7.
Figure 7.
Alignments of ONT reads against two example regions of the Escherichia coli DH5α reference sequence as raw reads and after applying correction steps. Red asterisks indicate deletions, red characters indicate insertions, characters highlighted in red indicate mismatches. Left side: positions 1816110–1816169, right side: positions 1813540–1813599. Ref: reference, raw: raw read, mp: MARVEL patched, cmh: Canu MHAP, cmm: Canu minimap2, pr: proovread.
Figure 8.
Figure 8.
Error distributions along unpatched PacBio and ONT reads before (green and purple, respectively) and after (pink) consensus correction by Canu (AF) or proovread (GL) for substitutions, deletions and insertions. Reads were analyzed as in Figure 5.
Figure 9.
Figure 9.
Read length distributions for raw PacBio reads and after proovread correction.
Figure 10.
Figure 10.
Frequencies of six-mers after correction by proovread and Canu (MHAP), respectively, in ONT reads (left) and PacBio reads (right) compared to the reference. Unpatched input reads were used. The diagonal blue line stands for perfect representation. The two red lines indicate the 3-fold standard deviation (proovread: ONT stddev = 0.0004, PacBio stddev = 0.0017, Canu: ONT stddev = 0.0035, PacBio stddev = 0.0005).
Figure 11.
Figure 11.
Change in frequencies of six-mers when applying the Canu (MHAP) correction on ONT raw reads (left) and PacBio raw reads (right) in relation to the reference frequencies. The top 50 six-mers with the greatest change in frequency are displayed.

References

    1. English A.C., Richards S., Han Y., Wang M., Vee V., Qu J., Qin X., Muzny D.M., Reid J.G., Worley K.C. et al.. Mind the gap: upgrading genomes with Pacific Biosciences RS long-read sequencing technology. PLoS One. 2012; 7:e47768. - PMC - PubMed
    1. Huddleston J., Ranade S., Malig M., Antonacci F., Chaisson M., Hon L., Sudmant P.H., Graves T.A., Alkan C., Dennis M.Y. et al.. Reconstructing complex regions of genomes using long-read sequencing technology. Genome Res. 2014; 24:688–696. - PMC - PubMed
    1. Steinberg K.M., Schneider V.A., Graves-Lindsay T.A., Fulton R.S., Agarwala R., Huddleston J., Shiryev S.A., Morgulis A., Surti U., Warren W.C. et al.. Single haplotype assembly of the human genome from a hydatidiform mole. Genome Res. 2014; 24:2066–2076. - PMC - PubMed
    1. Sharon D., Tilgner H., Grubert F., Snyder M.. A single-molecule long-read survey of the human transcriptome. Nat. Biotechnol. 2013; 31:1009–1014. - PMC - PubMed
    1. Minoche A.E., Dohm J.C., Schneider J., Holtgräwe D., Viehöver P., Montfort M., Sörensen T.R., Weisshaar B., Himmelbauer H.. Exploiting single-molecule transcript sequencing for eukaryotic gene prediction. Genome Biol. 2015; 16:184. - PMC - PubMed