

Authentication, characterization and contamination detection of cell lines, xenografts and organoids by barcode deep NGS sequencing
- PMID: 33575611
- PMCID: PMC7671372
- DOI: 10.1093/nargab/lqaa060
Authentication, characterization and contamination detection of cell lines, xenografts and organoids by barcode deep NGS sequencing
Abstract
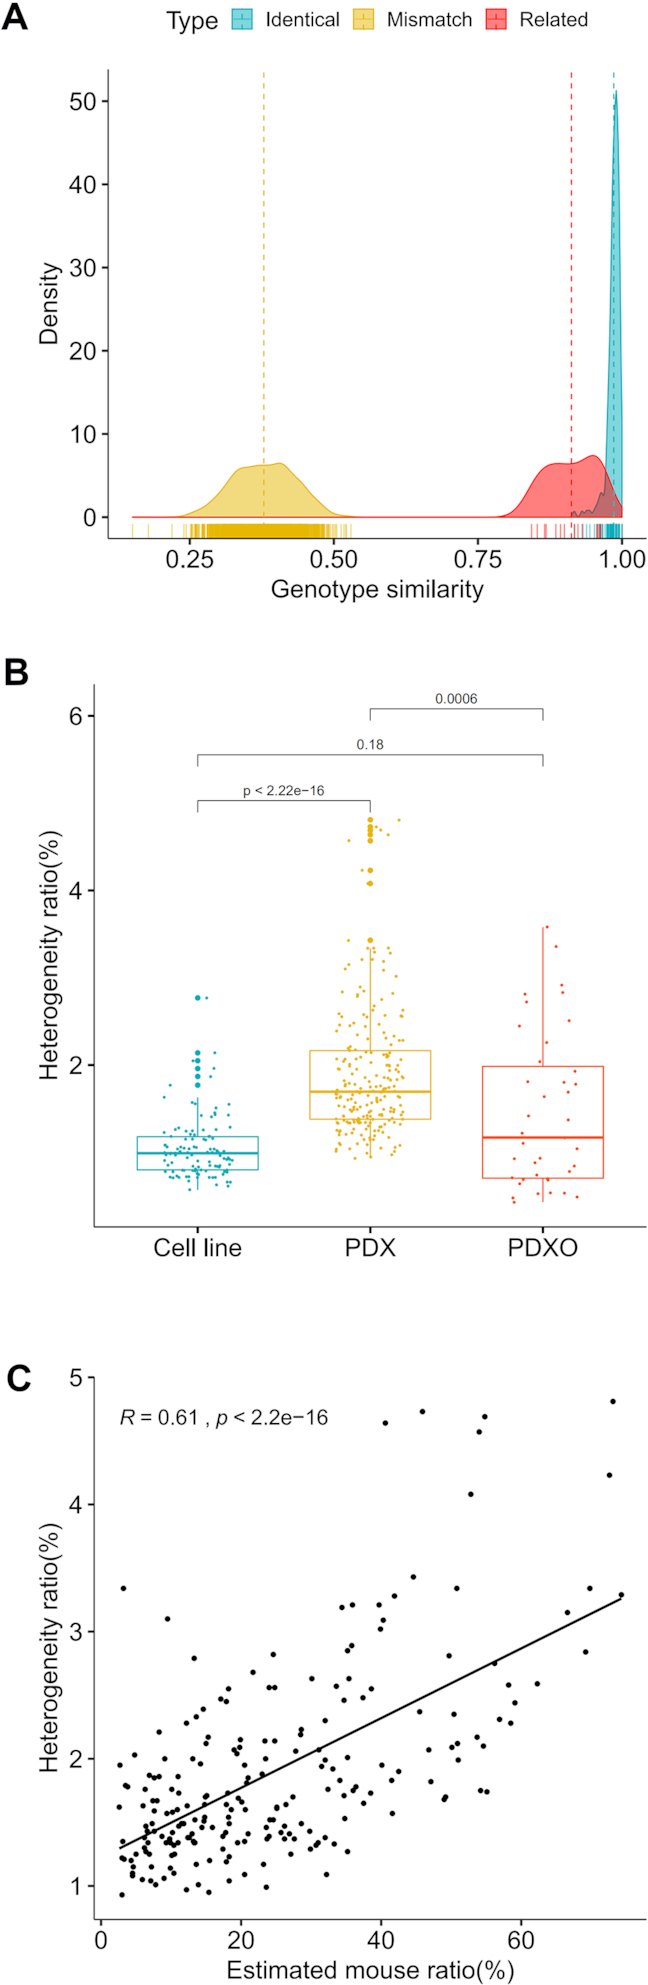
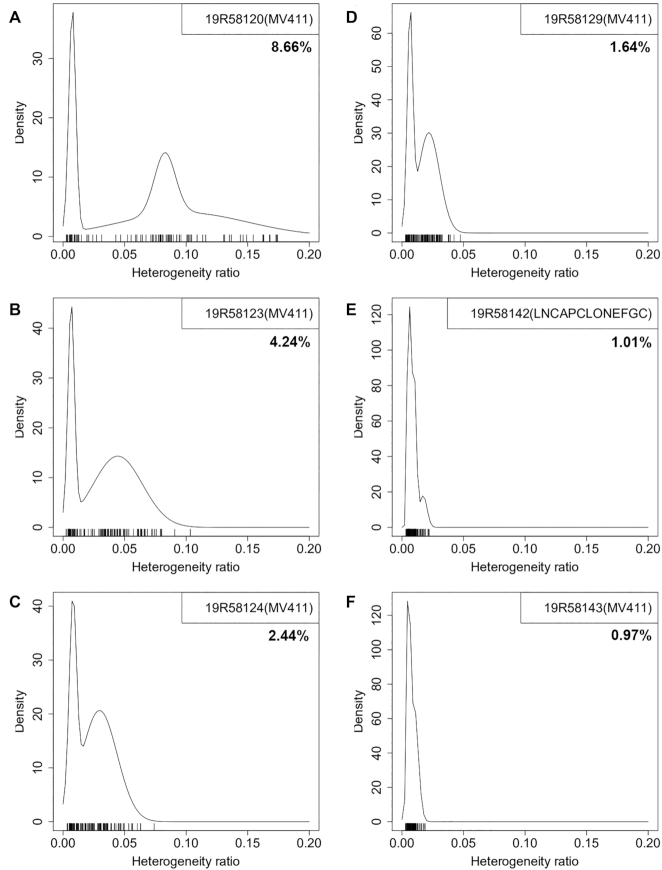
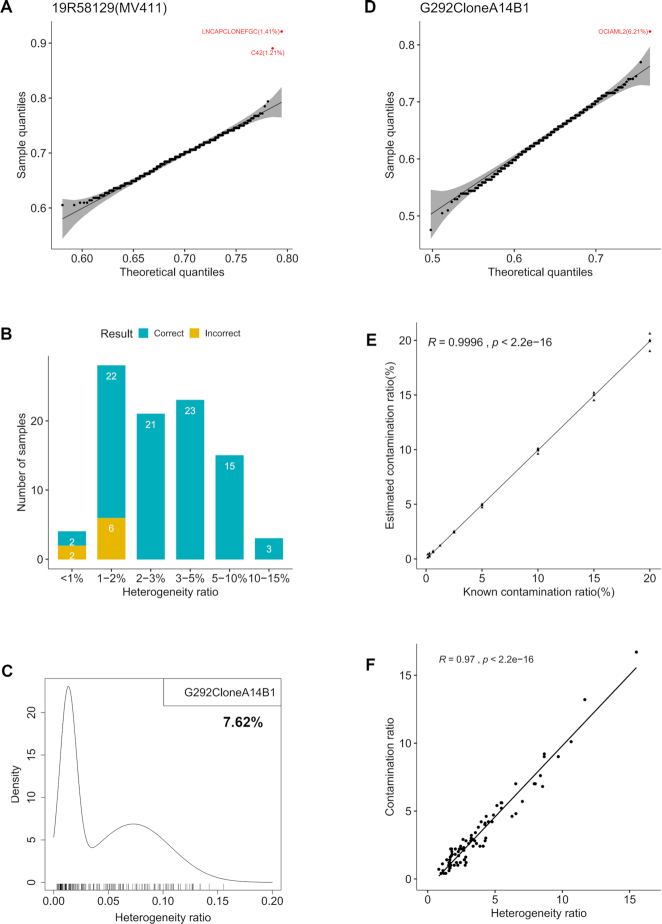
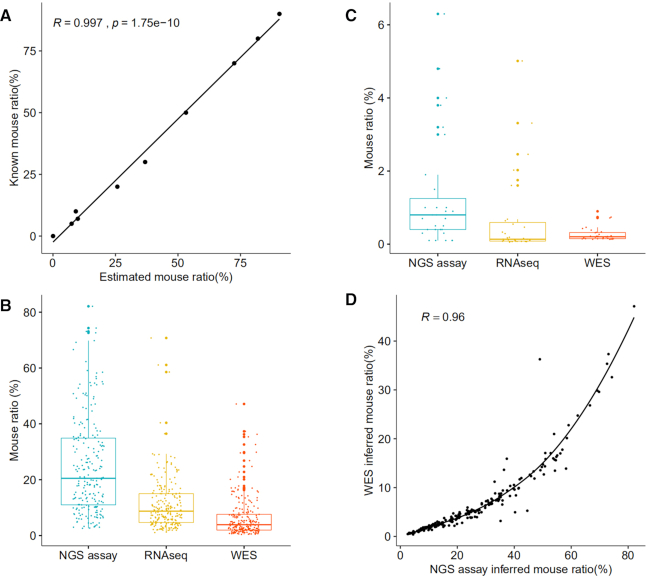
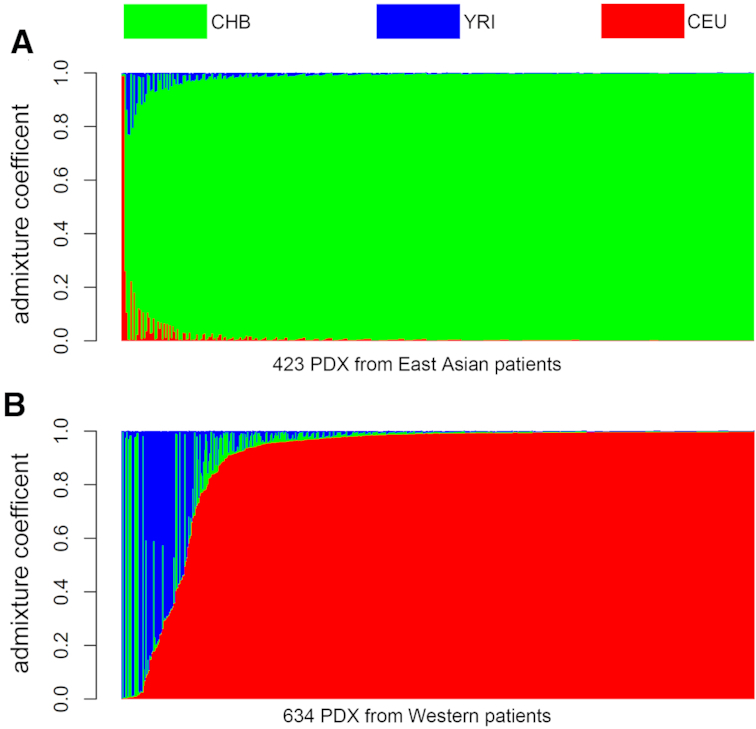
Misidentification and contamination of biobank samples (e.g. cell lines) have plagued biomedical research. Short tandem repeat (STR) and single-nucleotide polymorphism assays are widely used to authenticate biosamples and detect contamination, but with insufficient sensitivity at 5-10% and 3-5%, respectively. Here, we describe a deep NGS-based method with significantly higher sensitivity (≤1%). It can be used to authenticate human and mouse cell lines, xenografts and organoids. It can also reliably identify and quantify contamination of human cell line samples, contaminated with only small amount of other cell samples; detect and quantify species-specific components in human-mouse mixed samples (e.g. xenografts) with 0.1% sensitivity; detect mycoplasma contamination; and infer population structure and gender of human samples. By adopting DNA barcoding technology, we are able to profile 100-200 samples in a single run at per-sample cost comparable to conventional STR assays, providing a truly high-throughput and low-cost assay for building and maintaining high-quality biobanks.
© The Author(s) 2019. Published by Oxford University Press on behalf of NAR Genomics and Bioinformatics.
Figures
Similar articles
-
Short tandem repeat profiling via next-generation sequencing for cell line authentication.Dis Model Mech. 2023 Oct 1;16(10):dmm050150. doi: 10.1242/dmm.050150. Epub 2023 Oct 23. Dis Model Mech. 2023. PMID: 37712227 Free PMC article.
-
SNP array profiling of mouse cell lines identifies their strains of origin and reveals cross-contamination and widespread aneuploidy.BMC Genomics. 2014 Oct 3;15(1):847. doi: 10.1186/1471-2164-15-847. BMC Genomics. 2014. PMID: 25277546 Free PMC article.
-
Mouse cell line authentication.Cytotechnology. 2014 Jan;66(1):133-47. doi: 10.1007/s10616-013-9545-7. Epub 2013 Feb 22. Cytotechnology. 2014. PMID: 23430347 Free PMC article.
-
Human biosample authentication using the high-throughput, cost-effective SNPtrace(TM) system.PLoS One. 2015 Feb 25;10(2):e0116218. doi: 10.1371/journal.pone.0116218. eCollection 2015. PLoS One. 2015. PMID: 25714623 Free PMC article.
-
Essential role for gene profiling analysis in the authentication of human cell lines.Hum Cell. 2006 Feb;19(1):43-8. doi: 10.1111/j.1749-0774.2005.00007.x. Hum Cell. 2006. PMID: 16643607
Cited by
-
Human sample authentication in biomedical research: comparison of two platforms.Sci Rep. 2021 Jul 7;11(1):13982. doi: 10.1038/s41598-021-92978-3. Sci Rep. 2021. PMID: 34234171 Free PMC article.
-
Mouse Stromal Cells Confound Proteomic Characterization and Quantification of Xenograft Models.Cancer Res Commun. 2023 Feb 6;3(2):202-214. doi: 10.1158/2767-9764.CRC-22-0431. eCollection 2023 Feb. Cancer Res Commun. 2023. PMID: 36968139 Free PMC article.
-
Reference genomes for BALB/c Nude and NOD/SCID mouse models.G3 (Bethesda). 2023 Sep 30;13(10):jkad188. doi: 10.1093/g3journal/jkad188. G3 (Bethesda). 2023. PMID: 37594081 Free PMC article.
-
Patient-derived models facilitate precision medicine in liver cancer by remodeling cell-matrix interaction.Front Immunol. 2023 May 4;14:1101324. doi: 10.3389/fimmu.2023.1101324. eCollection 2023. Front Immunol. 2023. PMID: 37215109 Free PMC article. Review.
-
Characterization of Razi Bovine Kidney (RBK) Cell Line as a Sensitive Cell to Bovine Herpesvirus-1 (BoHV-1).Arch Razi Inst. 2023 Oct 31;78(5):1528-1541. doi: 10.22092/ARI.2023.78.5.1410. eCollection 2023 Oct. Arch Razi Inst. 2023. PMID: 38590682 Free PMC article.
References
-
- Editorial. Identity crisis. Nature. 2009; 457:935–936. - PubMed
-
- American Type Culture Collection Standards Development Organization Workgroup ASN-0002. Cell line misidentification: the beginning of the end. Nat. Rev. Cancer. 2010; 10:441–448. - PubMed
-
- Capes-Davis A., Reid Y.A., Kline M.C., Storts D.R., Strauss E., Dirks W.G., Drexler H.G., MacLeod R.A., Sykes G., Kohara A. et al. .. Match criteria for human cell line authentication: where do we draw the line. Int. J. Cancer. 2013; 132:2510–2519. - PubMed
-
- Gartler S.M. Apparent HeLa cell contamination of human heteroploid cell lines. Nature. 1968; 217:750–751. - PubMed
-
- Lacroix M. Persistent use of ‘false’ cell lines. Int. J. Cancer. 2008; 122:1–4. - PubMed
LinkOut - more resources
Full Text Sources
Other Literature Sources
