. 2020 Nov 19;2(4):lqaa093.
doi: 10.1093/nargab/lqaa093. eCollection 2020 Dec.

dearseq: a variance component score test for RNA-seq differential analysis that effectively controls the false discovery rate

Affiliations

dearseq: a variance component score test for RNA-seq differential analysis that effectively controls the false discovery rate

Marine Gauthier et al. NAR Genom Bioinform. .

Abstract

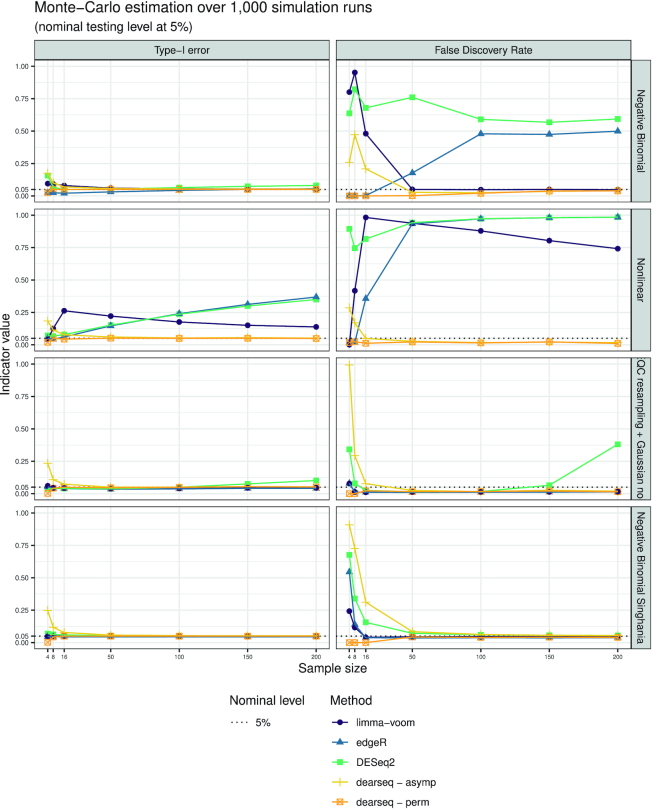
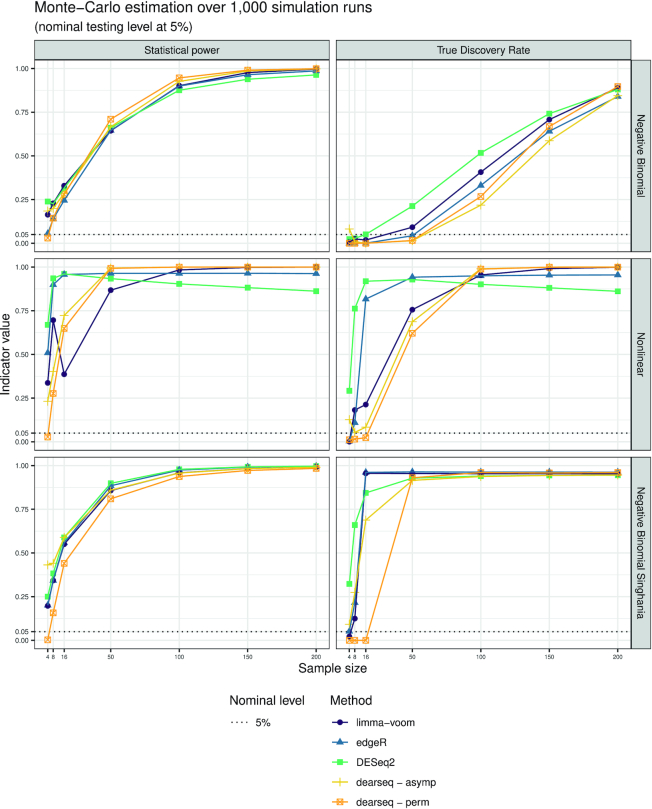
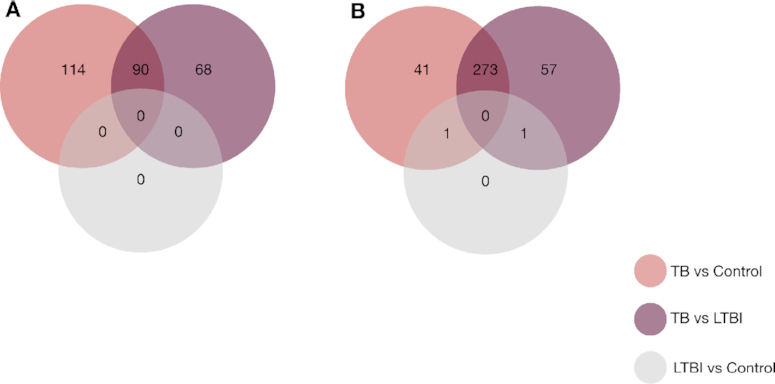
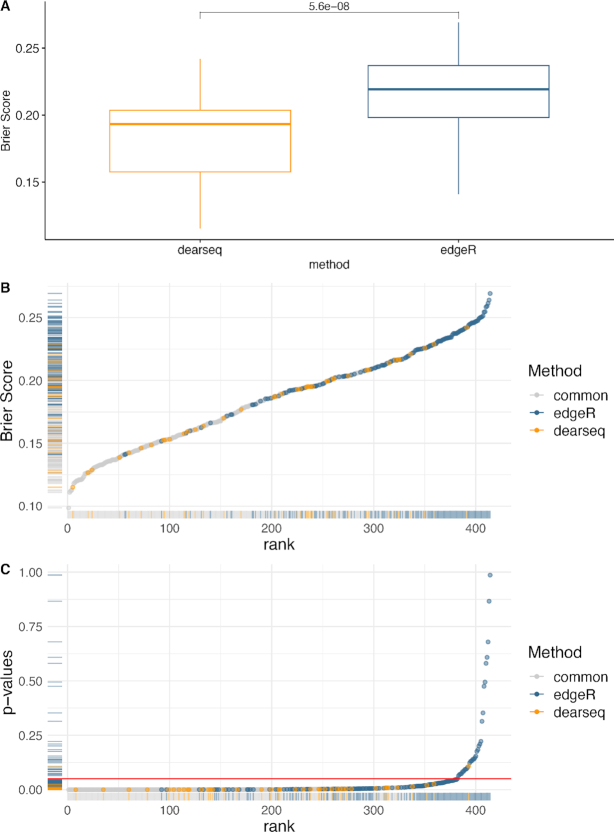
RNA-seq studies are growing in size and popularity. We provide evidence that the most commonly used methods for differential expression analysis (DEA) may yield too many false positive results in some situations. We present dearseq, a new method for DEA that controls the false discovery rate (FDR) without making any assumption about the true distribution of RNA-seq data. We show that dearseq controls the FDR while maintaining strong statistical power compared to the most popular methods. We demonstrate this behavior with mathematical proofs, simulations and a real data set from a study of tuberculosis, where our method produces fewer apparent false positives.


Figures

Figure 1.
Figure 1.
Type I error and FDR curves for each DEA method with increasing sample sizes. In each setting (negative binomial, nonlinear, SEQC data resampling and data-driven negative binomial), the type I error is computed as the number of significant genes among the true negative, and the FDR as the average number of false positives among the genes declared DE.
Figure 2.
Figure 2.
Power and TDR curves for each DEA method with increasing sample sizes. Because SEQC data resampling only generates nonsignificant genes, this setting does not allow to estimate statistical power or TDR.
Figure 3.
Figure 3.
Venn diagram showing overlap of DE genes using dearseq and the original edgeR signature among the three comparisons performed. (A) Venn diagram showing the results of the three DEA using dearseq. Note that no DE gene was found with our method comparing the LTBI group and the control group, unlike edgeR that found two such genes to be DE. (B) Venn diagram showing the results of the DEA using edgeR (Singhania et al.).
Figure 4.
Figure 4.
Comparing edgeR-based signature to the signature derived by dearseq. (A) Boxplots of the Brier scores of the 41 genes private to dearseq (i.e. not also declared DE by edger) and the 142 genes private to the original edgeR analysis. (B) Univariate Brier scores. The blue points correspond to genes found only in the original edgeR signature, the yellow points correspond to genes found only in the dearseq signature and the gray points correspond to genes found in both signatures. (C) Marginal P-values from a univariate logistic regression combined with a leave-one-out cross-validation for the 40 dearseq-private and the 142 edgeR-private genes. The red line indicates the common 5% P-value threshold.
Figure 5.
Figure 5.
Venn diagram summarizing the different signatures from the four methods. Venn diagram of the genes declared DE by dearseq, DESeq2, limma-voom and edgeR (Singhania et al.) under an FDR-adjusted P-value of 0.05. None of the genes is found with dearseq only.
Figure 6.
Figure 6.
Boxplots of the Brier scores of all the genes declared DE by the four methods. Boxplots of the Brier scores of all the DE genes called by dearseq, DESeq2, limma-voom and edgeR (Singhania et al.). The predictions are derived from a logistic regression combined with a leave-one-out cross-validation. Smaller Brier scores are better.
Figure 7.
Figure 7.
Comparison of the dearseq-derived signature with both the DESeq2- and limma-voom-derived signatures. (A) Boxplots of the Brier scores of the DE genes private to limma-voom and the DE genes common to both dearseq and limma-voom. Note that only five genes are identified only by dearseq and not limma-voom. Therefore, we exclude the associated boxplot. (B) Univariate Brier scores. The purple points correspond to the DE genes called by limma-voom and the gray points correspond to the genes common with dearseq. (C) Marginal P-values. (D) Boxplots of the Brier scores of the DE genes private to dearseq and the DE genes common to both dearseq and DESeq2. All genes declared DE by dearseq were also declared DE by DESeq2. (E) Univariate Brier scores. The green points correspond to the DE genes called by DESeq2 and the gray points correspond to the genes common with dearseq. All genes declared DE by dearseq were also declared DE by DESeq2. (F) Marginal P-values.

References

    1. Robinson M.D., McCarthy D.J., Smyth G.K. edgeR: a Bioconductor package for differential expression analysis of digital gene expression data. Bioinformatics. 2010; 26:139–140. - PMC - PubMed
    1. Love M.I., Huber W., Anders S. Moderated estimation of fold change and dispersion for RNA-seq data with DESeq2. Genome Biol. 2014; 15:550. - PMC - PubMed
    1. Law C.W., Chen Y., Shi W., Smyth G.K. Voom: precision weights unlock linear model analysis tools for RNA-seq read counts. Genome Biol. 2014; 15:R29. - PMC - PubMed
    1. Benjamini Y., Hochberg Y. Controlling the false discovery rate: a practical and powerful approach to multiple testing. J. R. Stat. Soc. Ser. B Methodol. 1995; 57:289–300.
    1. Zhang Z.H., Jhaveri D.J., Marshall V.M., Bauer D.C., Edson J., Narayanan R.K., Robinson G.J., Lundberg A.E., Bartlett P.F., Wray N.R. et al. . A comparative study of techniques for differential expression analysis on RNA-seq data. PLoS One. 2014; 9:e103207. - PMC - PubMed