

Shrinkage improves estimation of microbial associations under different normalization methods
- PMID: 33575644
- PMCID: PMC7745771
- DOI: 10.1093/nargab/lqaa100
Shrinkage improves estimation of microbial associations under different normalization methods
Abstract
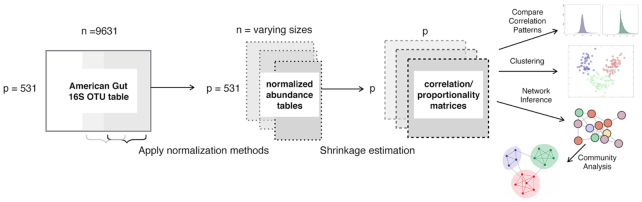
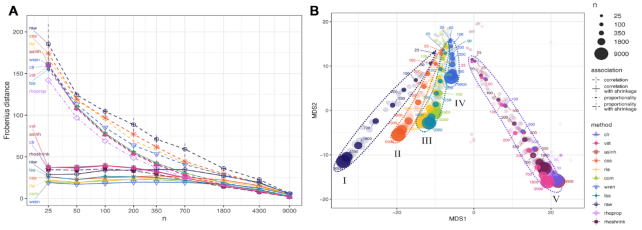
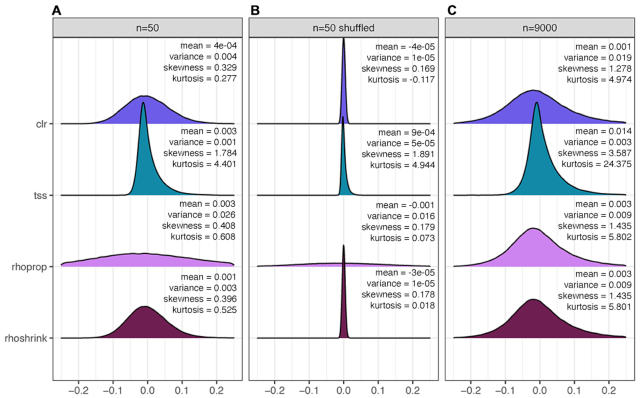
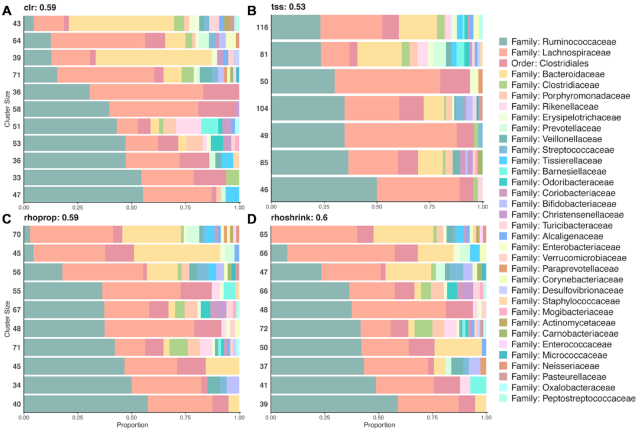
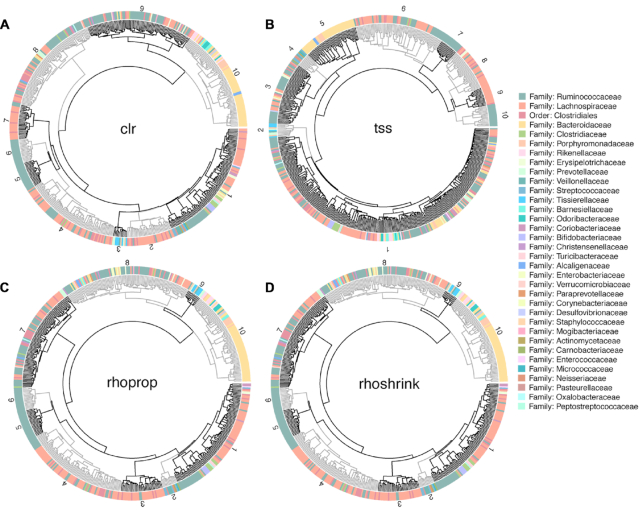
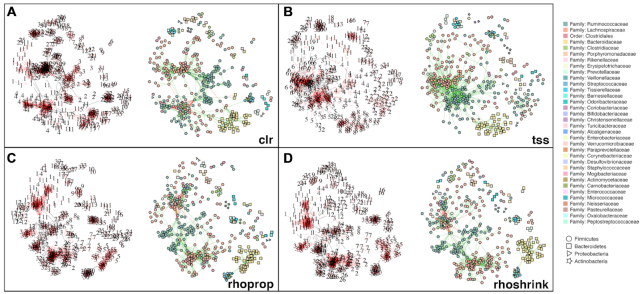
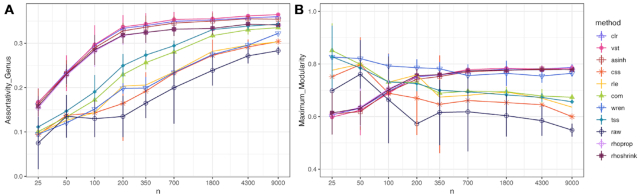
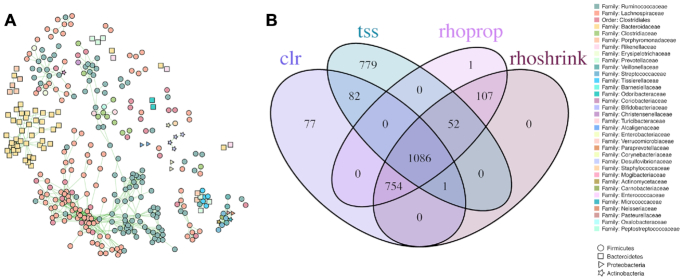
Estimation of statistical associations in microbial genomic survey count data is fundamental to microbiome research. Experimental limitations, including count compositionality, low sample sizes and technical variability, obstruct standard application of association measures and require data normalization prior to statistical estimation. Here, we investigate the interplay between data normalization, microbial association estimation and available sample size by leveraging the large-scale American Gut Project (AGP) survey data. We analyze the statistical properties of two prominent linear association estimators, correlation and proportionality, under different sample scenarios and data normalization schemes, including RNA-seq analysis workflows and log-ratio transformations. We show that shrinkage estimation, a standard statistical regularization technique, can universally improve the quality of taxon-taxon association estimates for microbiome data. We find that large-scale association patterns in the AGP data can be grouped into five normalization-dependent classes. Using microbial association network construction and clustering as downstream data analysis examples, we show that variance-stabilizing and log-ratio approaches enable the most taxonomically and structurally coherent estimates. Taken together, the findings from our reproducible analysis workflow have important implications for microbiome studies in multiple stages of analysis, particularly when only small sample sizes are available.
© The Author(s) 2020. Published by Oxford University Press on behalf of NAR Genomics and Bioinformatics.
Figures
Similar articles
-
Microbial Networks in SPRING - Semi-parametric Rank-Based Correlation and Partial Correlation Estimation for Quantitative Microbiome Data.Front Genet. 2019 Jun 6;10:516. doi: 10.3389/fgene.2019.00516. eCollection 2019. Front Genet. 2019. PMID: 31244881 Free PMC article.
-
NetCoMi: network construction and comparison for microbiome data in R.Brief Bioinform. 2021 Jul 20;22(4):bbaa290. doi: 10.1093/bib/bbaa290. Brief Bioinform. 2021. PMID: 33264391 Free PMC article.
-
Rank normalization empowers a t-test for microbiome differential abundance analysis while controlling for false discoveries.Brief Bioinform. 2021 Sep 2;22(5):bbab059. doi: 10.1093/bib/bbab059. Brief Bioinform. 2021. PMID: 33822893 Free PMC article.
-
Correlation and association analyses in microbiome study integrating multiomics in health and disease.Prog Mol Biol Transl Sci. 2020;171:309-491. doi: 10.1016/bs.pmbts.2020.04.003. Epub 2020 May 23. Prog Mol Biol Transl Sci. 2020. PMID: 32475527 Review.
-
Microbiome Multi-Omics Network Analysis: Statistical Considerations, Limitations, and Opportunities.Front Genet. 2019 Nov 8;10:995. doi: 10.3389/fgene.2019.00995. eCollection 2019. Front Genet. 2019. PMID: 31781153 Free PMC article. Review.
Cited by
-
Tree-aggregated predictive modeling of microbiome data.Sci Rep. 2021 Jul 15;11(1):14505. doi: 10.1038/s41598-021-93645-3. Sci Rep. 2021. PMID: 34267244 Free PMC article.
-
Metagenomic study of the gut microbiota associated with cow milk consumption in Chinese peri-/postmenopausal women.Front Microbiol. 2022 Aug 16;13:957885. doi: 10.3389/fmicb.2022.957885. eCollection 2022. Front Microbiol. 2022. PMID: 36051762 Free PMC article.
-
Poisson hurdle model-based method for clustering microbiome features.Bioinformatics. 2023 Jan 1;39(1):btac782. doi: 10.1093/bioinformatics/btac782. Bioinformatics. 2023. PMID: 36469352 Free PMC article.
-
Is There a Universal Endurance Microbiota?Microorganisms. 2022 Nov 9;10(11):2213. doi: 10.3390/microorganisms10112213. Microorganisms. 2022. PMID: 36363806 Free PMC article.
-
Bacterial low-abundant taxa are key determinants of a healthy airway metagenome in the early years of human life.Comput Struct Biotechnol J. 2021 Dec 15;20:175-186. doi: 10.1016/j.csbj.2021.12.008. eCollection 2022. Comput Struct Biotechnol J. 2021. PMID: 35024091 Free PMC article.
References
-
- Schloss P.D., Westcott S.L., Ryabin T., Hall J.R., Hartmann M., Hollister E.B., Lesniewski R.A., Oakley B.B., Parks D.H., Robinson C.J. et al. . Introducing mothur: open-source, platform-independent, community-supported software for describing and comparing microbial communities. Appl. Environ. Microbiol. 2009; 75:7537–7541. - PMC - PubMed
LinkOut - more resources
Full Text Sources
