. 2021 Jan 15;2(1):49-73.
doi: 10.1016/j.medj.2020.06.004. Epub 2020 Jul 9.

Fatal perinatal mitochondrial cardiac failure caused by recurrent de novo duplications in the ATAD3 locus

Affiliations

Fatal perinatal mitochondrial cardiac failure caused by recurrent de novo duplications in the ATAD3 locus

Ann E Frazier et al. Med. .

Abstract

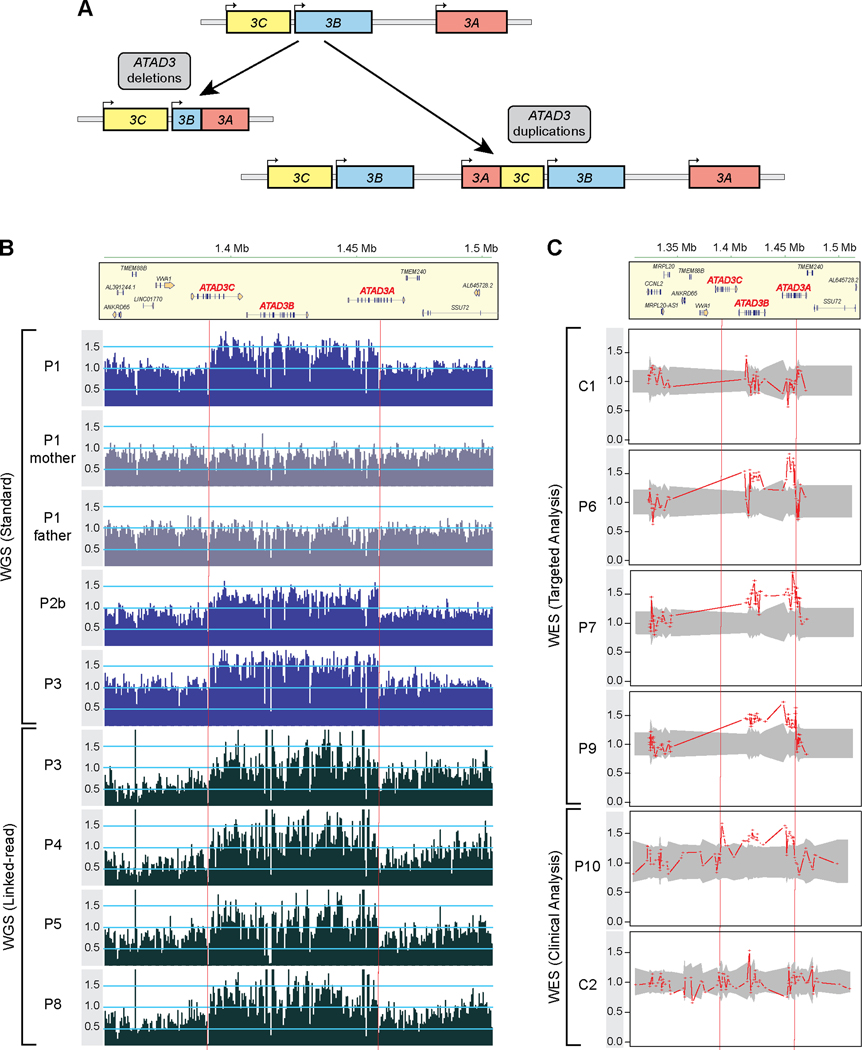
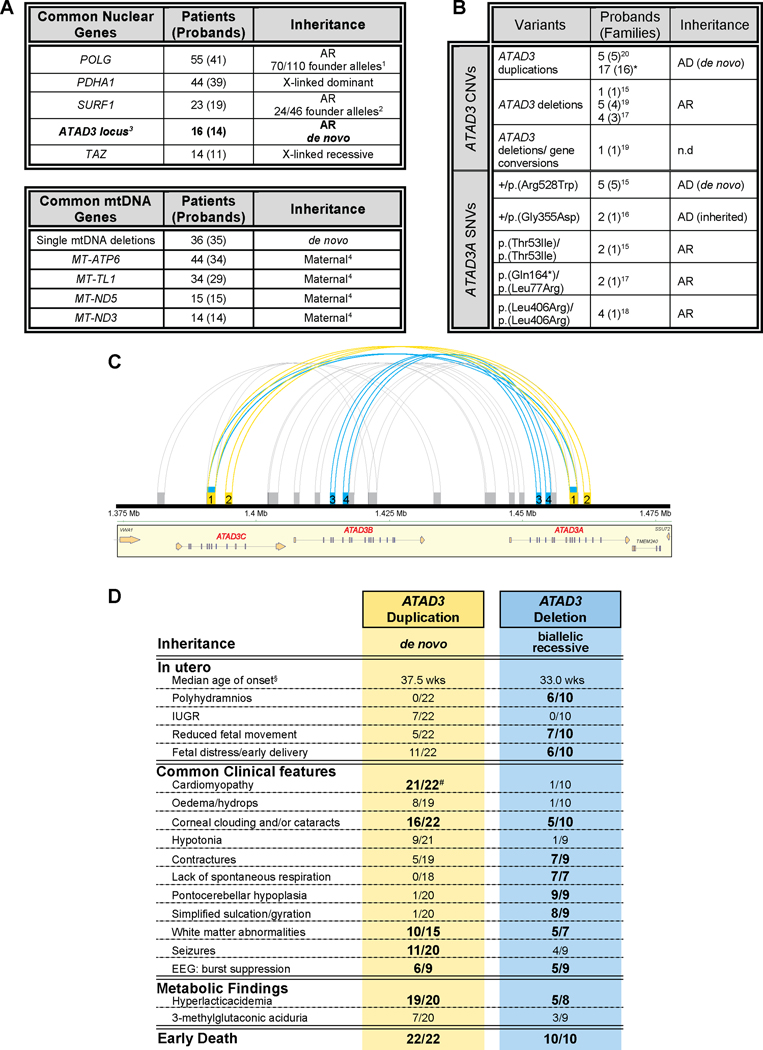
Background: In about half of all patients with a suspected monogenic disease, genomic investigations fail to identify the diagnosis. A contributing factor is the difficulty with repetitive regions of the genome, such as those generated by segmental duplications. The ATAD3 locus is one such region, in which recessive deletions and dominant duplications have recently been reported to cause lethal perinatal mitochondrial diseases characterized by pontocerebellar hypoplasia or cardiomyopathy, respectively.

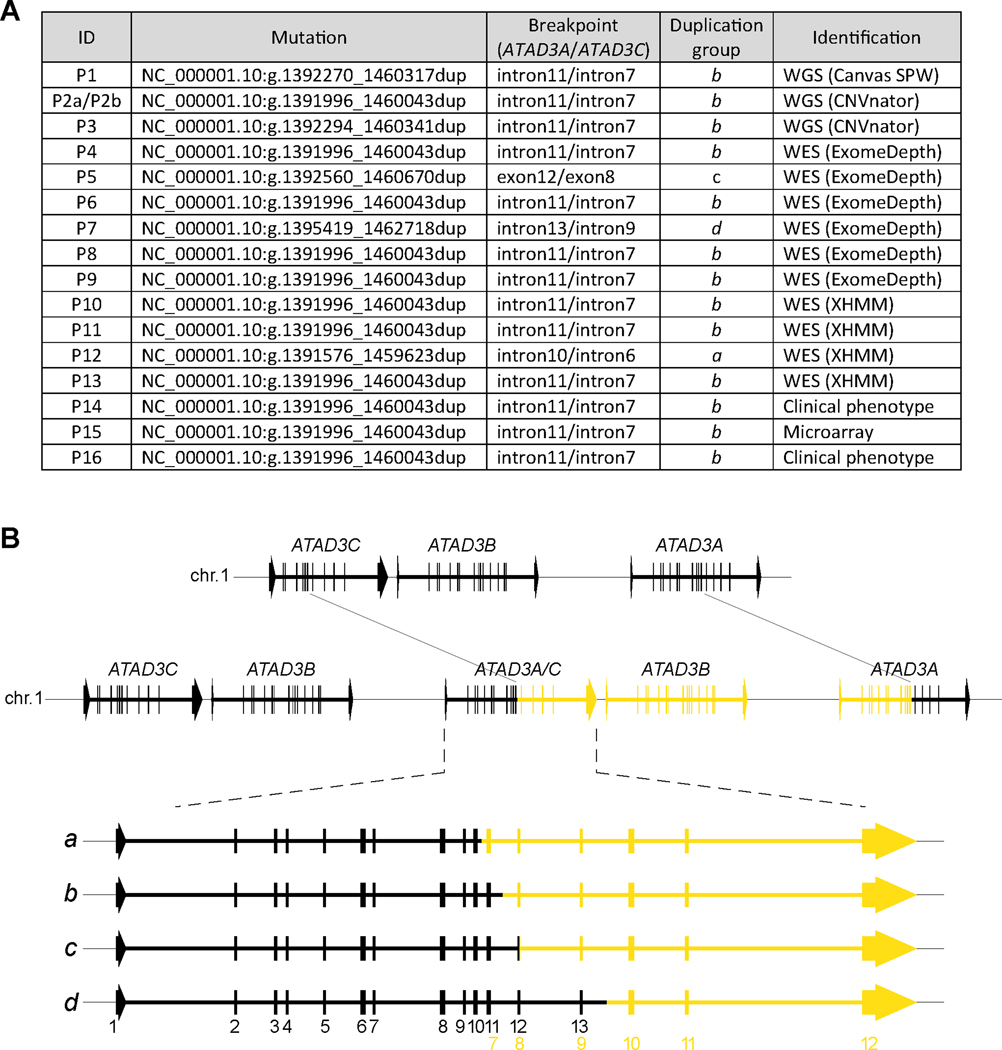
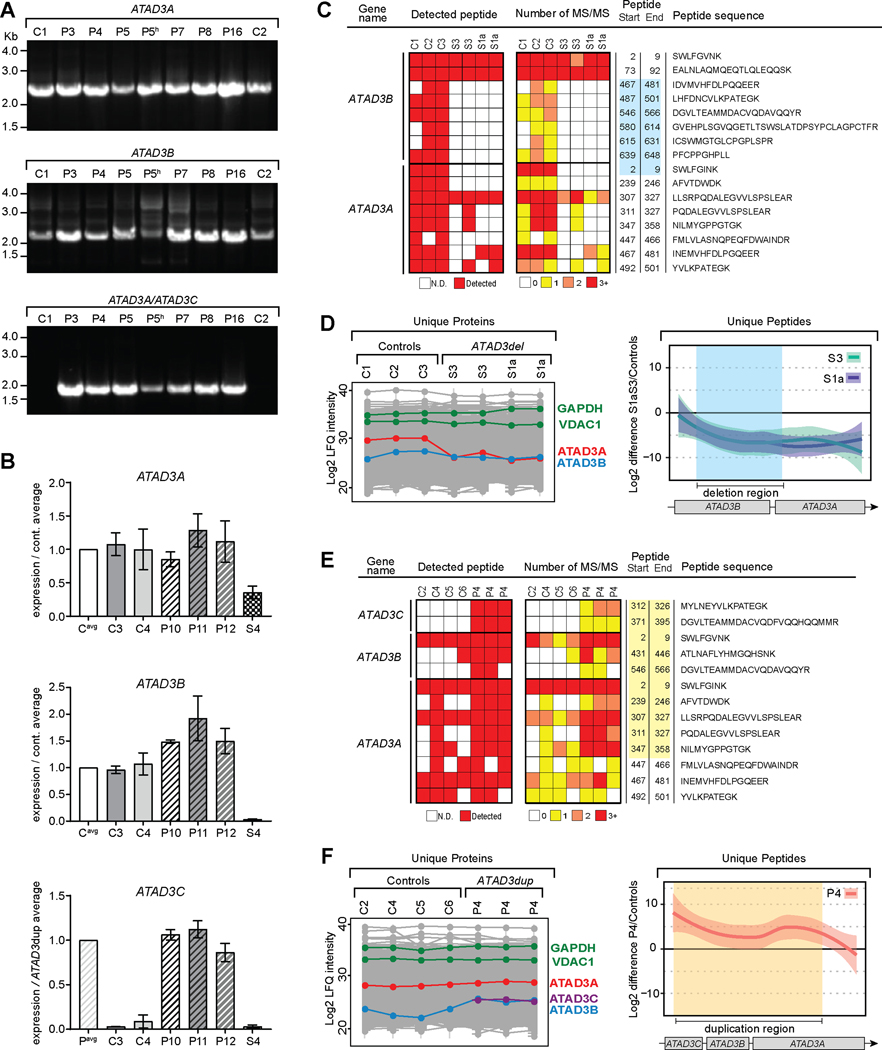
Methods: Whole exome, whole genome and long-read DNA sequencing techniques combined with studies of RNA and quantitative proteomics were used to investigate 17 subjects from 16 unrelated families with suspected mitochondrial disease.

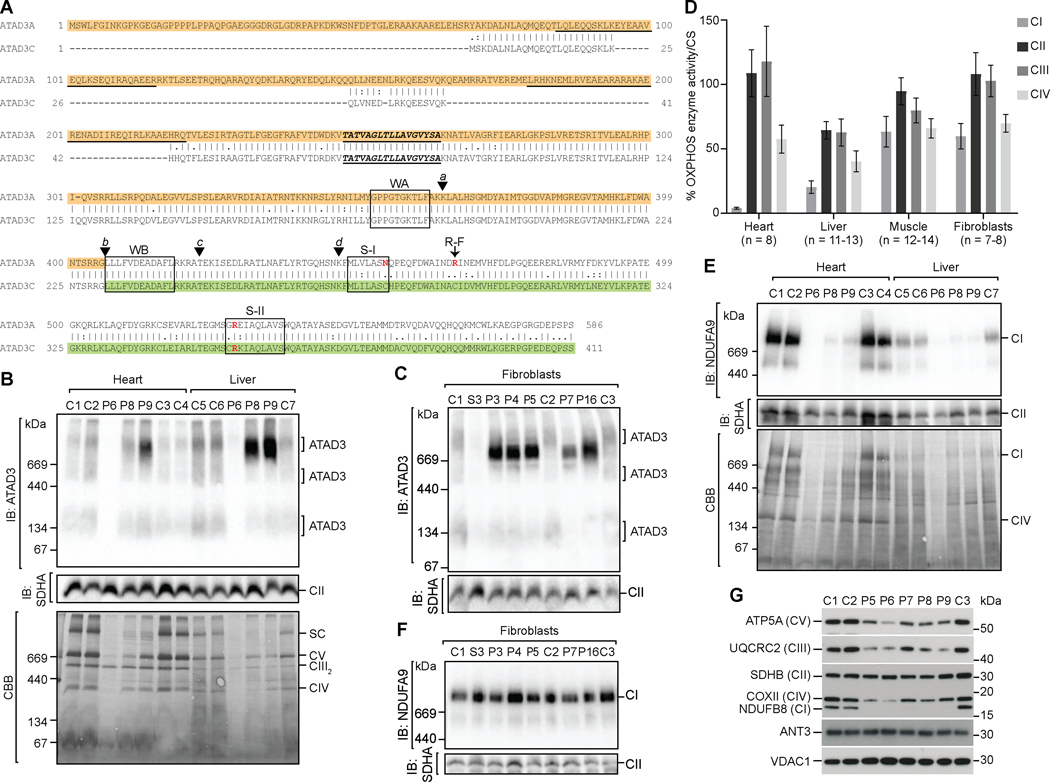
Findings: We report six different de novo duplications in the ATAD3 gene locus causing a distinctive presentation including lethal perinatal cardiomyopathy, persistent hyperlactacidemia, and frequently corneal clouding or cataracts and encephalopathy. The recurrent 68 Kb ATAD3 duplications are identifiable from genome and exome sequencing but usually missed by microarrays. The ATAD3 duplications result in the formation of identical chimeric ATAD3A/ATAD3C proteins, altered ATAD3 complexes and a striking reduction in mitochondrial oxidative phosphorylation complex I and its activity in heart tissue.

Conclusions: ATAD3 duplications appear to act in a dominant-negative manner and the de novo inheritance infers a low recurrence risk for families, unlike most pediatric mitochondrial diseases. More than 350 genes underlie mitochondrial diseases. In our experience the ATAD3 locus is now one of the five most common causes of nuclear-encoded pediatric mitochondrial disease but the repetitive nature of the locus means ATAD3 diagnoses may be frequently missed by current genomic strategies.

Funding: Australian NHMRC, US Department of Defense, Japanese AMED and JSPS agencies, Australian Genomics Health Alliance and Australian Mito Foundation.

Keywords: ATAD3; cardiomyopathy; genomics; mitochondrial disease; quantitative proteomics; segmental duplication.


Figures

Figure 1.
Figure 1.. Detection of ATAD3 duplications by genomic investigations.
A) The ATAD3 locus is a site of genetic instability with recurrent pathogenic biallelic deletions and de novo duplications, resulting in chimeric ATAD3B/ATAD3A genes (deletions; expressed under the ATAD3B promoter) or ATAD3A/ATAD3C genes (duplications; expressed under the ATAD3A promoter). B) Read coverage across the chr1 region spanning the ATAD3 locus and flanking genes as determined by either standard WGS in patients P1 and parents, P2b and P3 (upper panels with dark blue (patients) or grey (parents) bars) or 10x Genomics linked-read WGS in P3-P5 and P8 (lower panels with black bars). The number of uniquely mapping reads was determined for each 500 nt non-overlapping window. Read depths per bin were normalized by dividing by the median read count of all chr1 bins with non-zero read counts. Dashed red vertical lines indicate approximate breakpoints of the duplicated region. C) Samples were subjected to WES with either a targeted analysis of mitochondrial genes (control C1, patients P6, P7, and P9) or clinical analysis (control C2 and P10). ExomeDepth analysis across the ATAD3 locus plotted as the ratio of the observed versus expected read depth. Shaded grey areas indicate 95% confidence interval across the matched reference set. See also Figure S1.
Figure 2.
Figure 2.. Analysis of ATAD3 duplication breakpoints.
A) Sanger sequencing was used to determine genomic coordinates (GRCh37/hg19) for the ATAD3 duplication in all patients, with the corresponding position of the breakpoint in the ATAD3A and ATAD3C genes indicated. The duplications were assigned to a group according to the location of the breakpoint within the genes. As well, the initial method and variant caller that led to the duplication identification is indicated. Duplications NC_000001.10:g.1392270_1460317dup and NC_000001.10:g.1391996_1460043dup have been previously reported. B) Schematic of the most common ATAD3 tandem duplication within the cohort (top, in yellow) validated by Sanger sequencing of gDNA breakpoints. The duplicated region (yellow) encompasses part of ATAD3C, all of ATAD3B and part of ATAD3A, resulting in a chimeric ATAD3A/ATAD3C gene. An expanded view of the chimeric ATAD3A/ATAD3C gene (bottom) indicates the different duplication groups (listed in A) and their impact on the gene structure. Corresponding exons are numbered at the bottom. black, ATAD3A; yellow, ATAD3C. See also Figure S2 and Table S2.
Figure 3.
Figure 3.. A chimeric ATAD3A/ATAD3C gene generated by the duplication is expressed.
A) cDNA generated from patient and control skin fibroblasts, and P5 heart (indicated by “h”) was used for PCR amplification of transcripts from ATAD3A, ATAD3B and chimeric ATAD3A/ATAD3C genes. Transcripts were amplified using a primer targeting both ATAD3A and ATAD3B, and specific reverse primers for ATAD3A, ATAD3B, and ATAD3C. B) qRT-PCR was performed using cDNA from control and patient skin fibroblasts for quantitative analysis of transcripts using regions corresponding to ATAD3A and ATAD3B exons 15/16 and ATAD3C exons 11/12, which are the last exons of the genes. Values expressed relative to control average (ATAD3A and ATAD3B) or ATAD3dup patient average (ATAD3C). Shaded boxes, controls; dashed boxes, ATAD3dup patients; checked box, ATAD3del patient (S4). n = 3, error = SD. C) Label-free quantitative (LFQ) proteomics was performed on skin fibroblasts from controls (C; n=3) and ATAD3del patients S3 and S1a (in duplicate). Unique ATAD3A and ATAD3B peptides were plotted according to their presence, as well as the number of MS/MS spectra observed. The blue box indicates the peptides encoded within the deleted ATAD3 region. ATAD3C peptides were not detected in these samples. N.D., not detected. D) Using the LFQ proteomics data for all unique peptides from C, the relative levels of ATAD3A and ATAD3B proteins in each sample were compared (left panel), alongside the levels of cytosolic (GAPDH) and mitochondrial (VDAC1) marker proteins. The mean difference of Log2 LFQ intensities between S3 and S1a to controls for individual peptides were plotted across the ATAD3 locus with the deleted region indicated (blue shading) (right panel). Missing values for individual peptides were imputed as described in the methods and the loess smoothed curve plotted along with the 95% confidence interval (right panel). E) LFQ proteomics was performed on skin fibroblasts for controls (n=4) and ATAD3dup patient P4 (in triplicate), with unique peptides for ATAD3A, ATAD3B and ATAD3C plotted as in C. The yellow box indicates the peptides encoded within the duplicated ATAD3 region. F) Using the LFQ proteomics data from E, the relative levels of ATAD3A, ATAD3B and ATAD3C proteins were compared across all samples (left panel). The mean difference of Log2 LFQ intensities between P4 to controls were plotted across the ATAD3 locus as in D, with the duplication region indicated (yellow shading) (right panel). See also Figures S3 and S4.
Figure 4.
Figure 4.. ATAD3 duplication leads to OXPHOS complex I deficiency and ATAD3 oligomerization defects.
A) An alignment of ATAD3A (NP_001164006) with ATAD3C (NP_001034300) showing predicted protein domains and key residues,,: coiled coil regions (underlined); transmembrane domain (underlined/ bold italic text); Walker A and Walker B motifs (WA and WB, boxed); Sensor I and Sensor II motifs (S-I and S-II, key residue in red); and arginine finger residue (R-F, red). The location of the breakpoints corresponding to the deletion groups (a-d) are indicated by arrowheads. The predicted chimeric ATAD3A/ATAD3C protein generated by the most common duplication group group (b) corresponds to the ATAD3A region highlighted in orange, and the ATAD3C region highlighted in green. B) Mitochondria isolated from control and patient heart and liver biopsies were solubilized in 1% digitonin and subjected to blue native (BN)-PAGE and analysis of ATAD3 complexes by immunoblotting (anti-ATAD3), in comparison to OXPHOS complex II (anti-SDHA) (upper panels). Coomassie brilliant blue (CBB) staining of the membrane is shown to compare loading and sample integrity (lower panels). SC, supercomplex. C) Fibroblast mitochondria isolated from control, ATAD3dup patients and ATAD3del patient S3 cell lines analyzed by BN-PAGE as in B. D) OXPHOS enzyme activity normalized to citrate synthase (CS) activity and expressed as the percent of control mean was determined in patient tissue samples. Error = SEM. E) Mitochondria isolated from control and patient heart and liver biopsies were solubilized in 1% Triton X-100 and subjected to BN-PAGE and analysis by immunoblotting for OXPHOS complex I (anti-NDUFA9) and complex II (anti-SDHA) (upper panels), with CBB staining shown for comparison. F) Fibroblast mitochondria isolated from control, ATAD3dup and ATAD3del patient S3 cell lines analyzed by BN-PAGE as in E. G) Total heart tissue lysates from controls and patients (2 μg) analyzed by SDS-PAGE and western blotting with antibodies against an antibody cocktail targeting individual OXPHOS complex subunits, and controls VDAC1 (porin) and ANT3. See also Figure S5 and Table S3.
Figure 5.
Figure 5.. ATAD3 regions prone to recurrent rearrangements causing overlapping clinical symptoms.
A) Summary of the five most common nuclear or mtDNA loci in which mutations cause pediatric mitochondrial disease, from our experience with molecular diagnosis of >500 pediatric-onset cases from Australia & New Zealand, including mutations in a total of 74 nuclear genes and 12 mtDNA genes plus mtDNA deletions. aPOLG founder mutations of ancient European origin comprise 40 p.(Ala467Thr) alleles, 15 p.(Trp748Ser) alleles and 15 p.(Gly848Ser) alleles; bSURF1 c.311_312insATdel10 founder mutation appears to be of European origin; cATAD3 defects encompass pathogenic duplication and deletion rearrangements; dUp to a quarter of mtDNA mutations found in pediatric cases appear to be de novo mutations. AR, autosomal recessive. B) Numerous pathogenic CNVs in the ATAD3 locus and SNVs in ATAD3A have been identified. ATAD3A variants correspond to transcript NM_001170535. *, this study; AD, autosomal dominant; n.d., no data. C) Graphical illustration of tandem repeats in the ATAD3 locus generated using Miropeats with a similarity threshold of 900 bp. Regions of similarity associated with pathological ATAD3 rearrangements are indicated for biallelic deletions (blue) and de novo duplications (yellow). All other regions of intragenic similarity in grey. ATAD3 duplication groups a-c fall within region of similarity “1” and duplication group d within similarity region “2”. ATAD3C/ATAD3A deletion breakpoints fall within similarity region “1” and ATAD3B/ATAD3A deletion breakpoints within regions “3” and “4”. Region “1” spans across ATAD3C introns 4–7 and ATAD3A introns 8–11; region “2” across ATAD3C introns 8–9 and ATAD3A introns 12–13; region “3” across ATAD3A and ATAD3B introns 2–4; region “4” across ATAD3A and ATAD3B introns 4–5. D) Comparison of clinical features across all reported patients with ATAD3 duplications and biallelic deletions,,, leading to severe presentations. Clinical features associated with more than 50% of ATAD3dup or ATAD3del patients in bold. §, median age of onset in weeks from conception; ATAD3dup patients n = 22 (average age of onset ± SD, 37.0 ± 3.4 weeks) or ATAD3del patients n = 10 (average age of onset ± SD, 32.7 ± 3.4). #, P4 with “borderline contractility” was not considered to have cardiomyopathy; 16/21 patients with cardiomyopathy were diagnosed with hypertrophic cardiomyopathy (HCM). EEG, electroencephalogram; MRI, magnetic resonance imaging.

Comment in

References

    1. Gorman GS, Chinnery PF, DiMauro S, Hirano M, Koga Y, McFarland R, Suomalainen A, Thorburn DR, Zeviani M, and Turnbull DM (2016). Mitochondrial diseases. Nat Rev Dis Primers 2, 16080. - PubMed
    1. Rahman J, and Rahman S. (2018). Mitochondrial medicine in the omics era. Lancet 391, 2560–2574. - PubMed
    1. Stenton SL, and Prokisch H. (2018). Advancing genomic approaches to the molecular diagnosis of mitochondrial disease. Essays Biochem 62, 399–408. - PubMed
    1. Stankiewicz P, and Lupski JR (2002). Genome architecture, rearrangements and genomic disorders. Trends Genet 18, 74–82. - PubMed
    1. Bailey JA, Gu Z, Clark RA, Reinert K, Samonte RV, Schwartz S, Adams MD, Myers EW, Li PW, and Eichler EE (2002). Recent segmental duplications in the human genome. Science 297, 1003–1007. - PubMed

Publication types

Substances

LinkOut - more resources