. 2021 Apr 26;30(3-4):305-317.
doi: 10.1093/hmg/ddab029.

Genetically regulated expression underlies cellular sensitivity to chemotherapy in diverse populations

Affiliations

Genetically regulated expression underlies cellular sensitivity to chemotherapy in diverse populations

Ashley J Mulford et al. Hum Mol Genet. .

Abstract

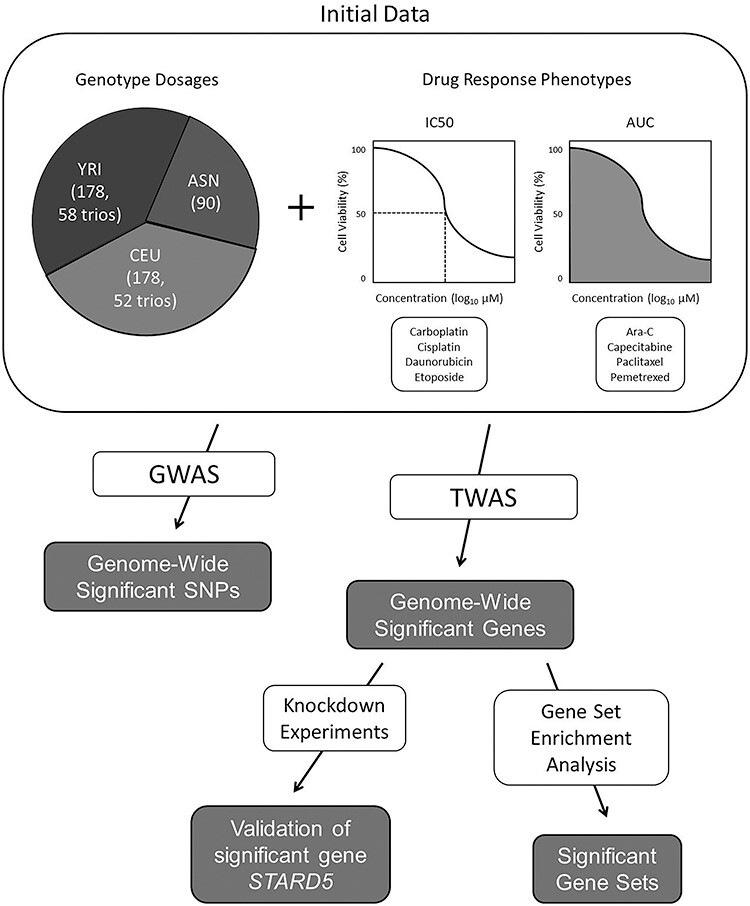
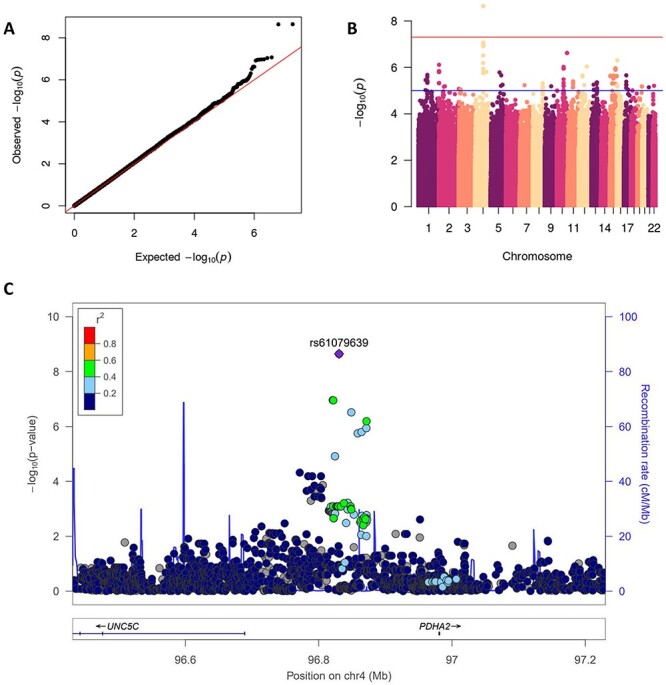
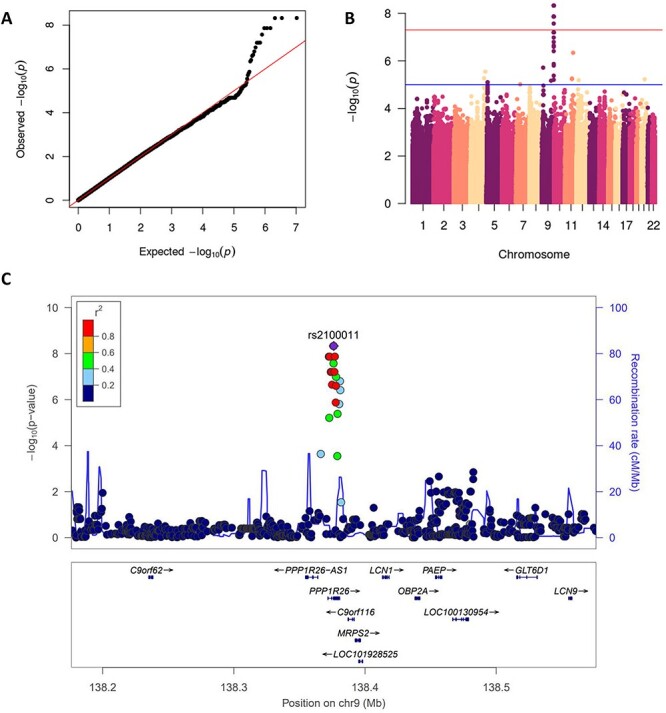
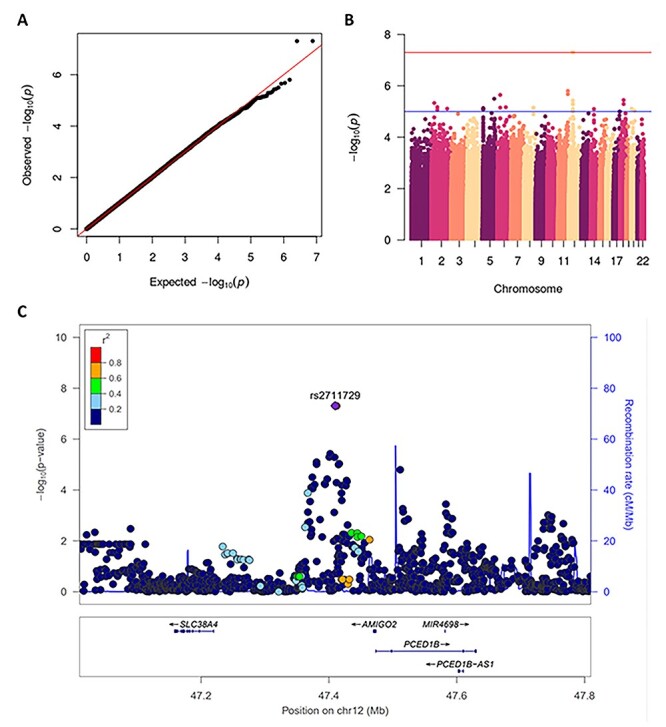
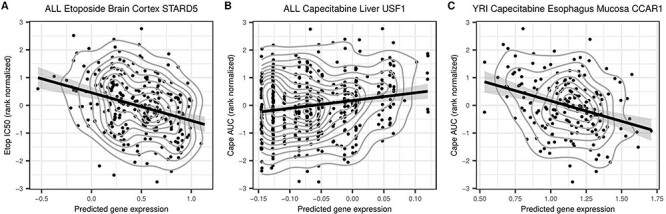
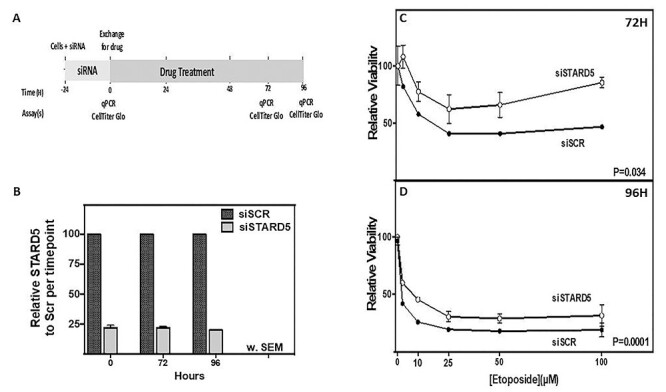
Most cancer chemotherapeutic agents are ineffective in a subset of patients; thus, it is important to consider the role of genetic variation in drug response. Lymphoblastoid cell lines (LCLs) in 1000 Genomes Project populations of diverse ancestries are a useful model for determining how genetic factors impact the variation in cytotoxicity. In our study, LCLs from three 1000 Genomes Project populations of diverse ancestries were previously treated with increasing concentrations of eight chemotherapeutic drugs, and cell growth inhibition was measured at each dose with half-maximal inhibitory concentration (IC50) or area under the dose-response curve (AUC) as our phenotype for each drug. We conducted both genome-wide association studies (GWAS) and transcriptome-wide association studies (TWAS) within and across ancestral populations. We identified four unique loci in GWAS and three genes in TWAS to be significantly associated with the chemotherapy-induced cytotoxicity within and across ancestral populations. In the etoposide TWAS, increased STARD5 predicted expression associated with decreased etoposide IC50 (P = 8.5 × 10⁻⁸). Functional studies in A549, a lung cancer cell line, revealed that knockdown of STARD5 expression resulted in the decreased sensitivity to etoposide following exposure for 72 (P = 0.033) and 96 h (P = 0.0001). By identifying loci and genes associated with cytotoxicity across ancestral populations, we strive to understand the genetic factors impacting the effectiveness of chemotherapy drugs and to contribute to the development of future cancer treatment.


Figures

Figure 1
Figure 1
Overview of data and analysis methods. Genotype dosages are from three ancestral populations: Yoruba individuals from Nigeria (YRI), individuals with European ancestries from Utah (CEU), and Japanese individuals from Tokyo and Han Chinese individuals from Beijing (ASN). Sample sizes and parent–child trio counts are listed in parentheses. Drug concentration measurements were taken as either IC50 or AUC. GWAS were conducted with GEMMA for all ancestral populations and drug response phenotypes. TWAS were conducted with PrediXcan and MultiXcan for all ancestral populations and drug response phenotypes; GTEx v7 and MESA prediction models were used. Gene set enrichment analyses, which utilized significant gene results, were conducted with FUMA. Knockdown experiments were performed in the A549 lung cancer cell line to validate the most significant gene-based association.
Figure 2
Figure 2
GWAS results for the YRI population and Daunorubicin cytotoxicity phenotype. QQ plot of GWAS results showing expected versus observed P-values, red line at x = y. Manhattan plot of GWAS results, red line at genome-wide significance threshold. LocusZoom plot of rs61079639 (P = 2.3 × 10⁻⁹), the blue line measures the recombination rate at a certain position and each point is colored to indicate linkage disequilibrium (r2) with rs61079639 in the 1000 Genomes November 2014 AFR population. AFR, African; UNC5C, Unc-5 Netrin Receptor C; PDHA2, Pyruvate Dehydrogenase E1 Subunit Alpha 2.
Figure 3
Figure 3
GWAS results for the ASN population and carboplatin cytotoxicity phenotype. QQ plot of GWAS results showing expected versus observed P-values, red line at x = y. Manhattan plot of GWAS results, red line at genome-wide significance threshold. LocusZoom plot of rs2100011 (P = 4.7 × 10⁻⁹), the blue line measures the recombination rate at a certain position and each point is colored to indicate linkage disequilibrium (r2) with rs2100011 in the 1000 Genomes November 2014 ASN population. ASN, Asian; C9orf62, Chromosome 9 Open Reading Frame 62; PPP1R26-AS1, PPP1R26 Antisense RNA 1; PPP1R26, Protein Phosphatase 1 Regulatory Subunit 26; C9orf116, Chromosome 9 Open Reading Frame 116; MRPS2, Mitochondrial Ribosomal Protein S2; LOC101928525, Uncharacterized LOC101928525; LCN1, Lipocalin 1; OBP2A, Odorant Binding Protein 2A; PAEP, Progestagen Associated Endometrial Protein; LOC100130954, Uncharacterized LOC100130954; GLT6D1, Glycosyltransferase 6 Domain Containing 1; LCN9, Lipocalin 9.
Figure 4
Figure 4
GWAS results for the ALL population and etoposide cytotoxicity phenotype. QQ plot of GWAS results showing expected versus observed P-values, red line at x = y. Manhattan plot of GWAS results, red line at genome-wide significance threshold. LocusZoom plot of rs2711729 (P = 4.9 × 10⁻⁸), the blue line measures the recombination rate at a certain position and each point is colored to indicate linkage disequilibrium (r2) with rs2711729 in the 1000 Genomes November 2014 AFR population. SLC38A4, Solute Carrier Family 38 Member 4; AMIGO2, Adhesion Molecule With Ig Like Domain 2; PCED1B, PC-Esterase Domain Containing 1B; MIR4698, MicroRNA 4698; PCED1B-AS1, PCED1B Antisense RNA 1.
Figure 5
Figure 5
Predicted Expression of significant TWAS gene hits versus drug measured drug cytotoxicity levels. (A) Predicted expression of STARD5 in the ALL population as determined by PrediXcan using the GTEx v7 Brain Cortex prediction model plotted against RN etoposide IC50 levels as measured in LCLs from the ALL population. (B) Predicted expression of USF1 in the ALL population as determined by PrediXcan using the GTEx v7 Liver prediction model plotted against RN Capecitabine AUC levels as measured in LCLs from the ALL population. (C) Predicted expression of CCAR1 in the YRI population as determined by MultiXcan plotted against RN Capecitabine AUC levels as measured in LCLs from the YRI population. CCAR1 expression was best predicted by the GTEx v7 Esophagus Mucosa prediction model. Each point represents an individual, the curved gray lines convey density in regard to the distribution of the black points and the straight black line is the best fit determined by linear regression, which shows the direction of effect.
Figure 6
Figure 6
Evaluation of the effect of STARD5 knockdown on sensitivity of A549 lung cancer cells to etoposide. (A) Experimental scheme for knockdown of STARD5 in A549 and treatment with etoposide. (B) STARD5 expression was reduced <25% for cells treated with siSTARD5 (gray bars) compared with expression in siSCR (black bars) at time of drug treatment (0 h) and at 72 and 96 h as determined by qRT-PCR. (C, D) Relative viability, determined by CellTiter-Glo 2.0 assay, for A549 cells treated with increasing concentrations of etoposide at (C) 72 h and (D) 96 h after treatment with siSTARD5 (open circle) or siSCR control (closed circle). Data represent two independent experiments, including at least three replicates analyzed by two-way ANOVA showing the SEM.

Similar articles

Cited by

  • Analysis of immune cell infiltration in the tumor microenvironment of cervical cancer and its impact on immunotherapy.
    Qin F, Huan L, Shi X, Hua Y, Wu Y. Qin F, et al. Front Oncol. 2025 Jul 3;15:1608597. doi: 10.3389/fonc.2025.1608597. eCollection 2025. Front Oncol. 2025. PMID: 40678068 Free PMC article.
  • FinnGen provides genetic insights from a well-phenotyped isolated population.
    Kurki MI, Karjalainen J, Palta P, Sipilä TP, Kristiansson K, Donner KM, Reeve MP, Laivuori H, Aavikko M, Kaunisto MA, Loukola A, Lahtela E, Mattsson H, Laiho P, Della Briotta Parolo P, Lehisto AA, Kanai M, Mars N, Rämö J, Kiiskinen T, Heyne HO, Veerapen K, Rüeger S, Lemmelä S, Zhou W, Ruotsalainen S, Pärn K, Hiekkalinna T, Koskelainen S, Paajanen T, Llorens V, Gracia-Tabuenca J, Siirtola H, Reis K, Elnahas AG, Sun B, Foley CN, Aalto-Setälä K, Alasoo K, Arvas M, Auro K, Biswas S, Bizaki-Vallaskangas A, Carpen O, Chen CY, Dada OA, Ding Z, Ehm MG, Eklund K, Färkkilä M, Finucane H, Ganna A, Ghazal A, Graham RR, Green EM, Hakanen A, Hautalahti M, Hedman ÅK, Hiltunen M, Hinttala R, Hovatta I, Hu X, Huertas-Vazquez A, Huilaja L, Hunkapiller J, Jacob H, Jensen JN, Joensuu H, John S, Julkunen V, Jung M, Junttila J, Kaarniranta K, Kähönen M, Kajanne R, Kallio L, Kälviäinen R, Kaprio J; FinnGen; Kerimov N, Kettunen J, Kilpeläinen E, Kilpi T, Klinger K, Kosma VM, Kuopio T, Kurra V, Laisk T, Laukkanen J, Lawless N, Liu A, Longerich S, Mägi R, Mäkelä J, Mäkitie A, Malarstig A, Mannermaa A, Maranville J, Matakidou A, Meretoja T, Mozaffari SV, Niemi MEK, Niemi M, Niiranen T, O Donnell CJ, Obeidat… See abstract for full author list ➔ Kurki MI, et al. Nature. 2023 Jan;613(7944):508-518. doi: 10.1038/s41586-022-05473-8. Epub 2023 Jan 18. Nature. 2023. PMID: 36653562 Free PMC article.
  • Protein prediction for trait mapping in diverse populations.
    Schubert R, Geoffroy E, Gregga I, Mulford AJ, Aguet F, Ardlie K, Gerszten R, Clish C, Van Den Berg D, Taylor KD, Durda P, Johnson WC, Cornell E, Guo X, Liu Y, Tracy R, Conomos M, Blackwell T, Papanicolaou G, Lappalainen T, Mikhaylova AV, Thornton TA, Cho MH, Gignoux CR, Lange L, Lange E, Rich SS, Rotter JI; NHLBI TOPMed Consortium; Manichaikul A, Im HK, Wheeler HE. Schubert R, et al. PLoS One. 2022 Feb 24;17(2):e0264341. doi: 10.1371/journal.pone.0264341. eCollection 2022. PLoS One. 2022. PMID: 35202437 Free PMC article.
  • Eleven metabolism‑related genes composed of Stard5 predict prognosis and contribute to EMT phenotype in HCC.
    Li D, Lin X, Li J, Liu X, Zhang F, Tang W, Zhang S, Dong L, Xue R. Li D, et al. Cancer Cell Int. 2023 Nov 17;23(1):277. doi: 10.1186/s12935-023-03097-0. Cancer Cell Int. 2023. PMID: 37978523 Free PMC article.
  • AteMeVs: An R package for the estimation of the average treatment effect with measurement error and variable selection for confounders.
    Chen LP, Yi GY. Chen LP, et al. PLoS One. 2024 Sep 30;19(9):e0296951. doi: 10.1371/journal.pone.0296951. eCollection 2024. PLoS One. 2024. PMID: 39348368 Free PMC article.

References

    1. Torre, L.A., Siegel, R.L., Ward, E.M. and Jemal, A. (2016) Global cancer incidence and mortality rates and trends—an update. Cancer Epidemiol. Biomark. Prev., 25, 16–27. - PubMed
    1. Galmarini, D., Galmarini, C.M. and Galmarini, F.C. (2012) Cancer chemotherapy: a critical analysis of its 60 years of history. Crit. Rev. Oncol. Hematol., 84, 181–199. - PubMed
    1. Stordal, B., Hamon, M., McEneaney, V., Roche, S., Gillet, J., O’Leary, J.J., Gottesman, M. and Clynes, M. (2012) Resistance to paclitaxel in a cisplatin-resistant ovarian cancer cell line is mediated by P-glycoprotein. PLoS One, 7, e40717. - PMC - PubMed
    1. Marin, J.J.G., Romero, M.R., Blazquez, A.G., Herraez, E., Keck, E. and Briz, O. (2009) Importance and limitations of chemotherapy among the available treatments for gastrointestinal tumours. Anti Cancer Agents Med. Chem., 9, 162–184. - PubMed
    1. Roy, P.S. and Saikia, B.J. (2016) Cancer and cure: a critical analysis. Indian J. Cancer, 53, 441–442. - PubMed

Publication types

MeSH terms