. 2021 Apr;23(4):267.
doi: 10.3892/mmr.2021.11906. Epub 2021 Feb 12.

Procyanidin B2 inhibits lipopolysaccharide‑induced apoptosis by suppressing the Bcl‑2/Bax and NF‑κB signalling pathways in human umbilical vein endothelial cells

Affiliations

Procyanidin B2 inhibits lipopolysaccharide‑induced apoptosis by suppressing the Bcl‑2/Bax and NF‑κB signalling pathways in human umbilical vein endothelial cells

Da-Qiang Song et al. Mol Med Rep. 2021 Apr.

Abstract

Human umbilical vein endothelial cells (HUVECs) serve a critical role in maintaining normal vascular function. Lipopolysaccharide (LPS), which is released from pathogenic bacteria in the blood, induces HUVEC apoptosis and injury to cause vascular dysfunction and infectious vascular diseases. Procyanidin B2 (PB2) possesses numerous functions, including antioxidant, antitumor, anti‑inflammatory and antiapoptosis effects, but the molecular mechanism is not completely understood. The present study investigated the effects of PB2 on LPS‑induced cytotoxicity and apoptosis in HUVECs, as well as the underlying mechanisms. The effects of PB2 on LPS‑mediated alterations to cytotoxicity, mitochondrial membrane potential, apoptosis were assessed by performing Cell Counting Kit‑8, JC‑1 fluorescence, Hoechst 33258 staining assays, respectively. IL‑1β, IL‑6 and TNF‑α mRNA expression and protein levels were measured by performing reverse transcription‑quantitative PCR and ELISAs, respectively. Bcl‑2, Bax, cleaved caspase‑3, cleaved caspase‑7, cleaved caspase‑9, phosphorylated (p)‑IκB‑α, p‑IκB‑β, p‑NF‑κB‑p65 and total NF‑κB p65 protein expression levels were determined via western blotting. NF‑κB p65 nuclear translocation was assessed via immunofluorescence. PB2 pretreatment markedly attenuated LPS‑induced cytotoxicity and apoptosis in HUVECs. PB2 also significantly downregulated the expression levels of IL‑1β, IL‑6, TNF‑α, Bax, cleaved caspase‑3, cleaved caspase‑7, cleaved caspase‑9 and p‑NF‑κB‑p65, but upregulated the expression levels of Bcl‑2, p‑IκB‑α and p‑IκB‑β in LPS‑induced HUVECs. Moreover, PB2 markedly inhibited LPS‑induced NF‑κB p65 nuclear translocation in HUVECs. The results suggested that the potential molecular mechanism underlying PB2 was associated with the Bax/Bcl‑2 and NF‑κB signalling pathways. Therefore, PB2 may serve as a useful therapeutic for infectious vascular diseases.

Keywords: PB2; LPS; apoptosis; NF‑κB; cytokine; HUVECs.


Conflict of interest statement

The authors declare that they have no competing interests.

Figures
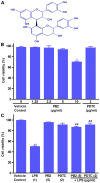
Figure 1.
Figure 1.
Chemical structure of PB2, and the effects of LPS, PB2 and PDTC on HUVEC viability. Cells were treated with serum-free medium for 24 h (vehicle control) or with serum-free medium for 12 h followed by LPS (1 µg/ml) for 12 h, PB2 (1.25–10 µg/ml) or PDTC (2 µg/ml) for 12 h followed by serum-free medium or LPS for 12 h. (A) Chemical structure of PB2. (B) Effects of PB2 and PDTC on HUVEC viability. (C) Effects of LPS, PB2 and PDTC on HUVEC viability. Data are presented as the mean ± SD of at least three independent experiments run in triplicate (n=3). Data were analysed using one-way ANOVA followed by Tukey's post hoc test. *P<0.05, **P<0.01 vs. vehicle control; ##P<0.01 vs. LPS. PB2, procyanidin B2; LPS, lipopolysaccharide; PDTC, pyrrolidinedithiocarbamate ammonium; HUVEC, human umbilical vein endothelial cell.
Figure 2.
Figure 2.
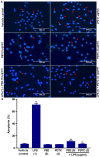
Effects of PB2 and PDTC on LPS-induced HUVEC apoptosis. Cells were treated with serum-free medium alone for 24 h in the vehicle control group; cells were treated with serum-free medium for 12 h followed by LPS (1 µg/ml) for 12 h in the LPS group; cells were treated with serum-free medium for 12 h followed by PB2 (5 µg/ml) for 12 h in the PB2 group; cells were treated with serum-free medium for 12 h followed by PDTC (2 µg/ml) for 12 h in the PDTC group; cells were treated with PB2 (5 µg/ml) for 12 h followed by LPS (1 µg/ml) for 12 h in the LPS + PB2 group; cells were treated with PDTC (2 µg/ml) for 12 h followed by LPS (1 µg/ml) for 12 h in the LPS + PDTC group. (A) Representative images of apoptotic cells identified by Hoechst staining via fluorescence microscopy (magnification, ×400). Red arrows indicate apoptotic cells. The vehicle control group displayed the typical features of HUVECs with the appearance of normal blue fluorescence in the cell nuclei. In LPS-treated HUVECs, apoptotic cells with condensation of nuclear chromatin and fragmentation, which was indicated by white staining, were observed. Pretreatment with PB2 or PDTC prior to LPS treatment markedly reduced the number of apoptotic cells compared with the LPS group. However, PB2 or PDTC treatment alone displayed no obvious effect on HUVEC apoptosis compared with the vehicle control group. (B) Quantification of the percentage of apoptotic cells. Data are presented as the mean ± SD of at least three independent experiments run in triplicate (n=3). Data were analysed using one-way ANOVA followed by Tukey's post hoc test. **P<0.01 vs. vehicle control; ##P<0.01 vs. LPS. PB2, procyanidin B2; PDTC, pyrrolidinedithiocarbamate ammonium; LPS, lipopolysaccharide; HUVEC, human umbilical vein endothelial cell.
Figure 3.
Figure 3.
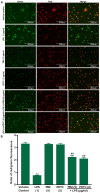
Effects of LPS, PB2 and PDTC on mitochondrial membrane potential in HUVECs. Cells were treated with serum-free medium for 24 h in the vehicle control group; cells were treated with serum-free medium for 12 h followed by LPS (1 µg/ml) for 12 h in the LPS group; cells were treated with serum-free medium for 12 h followed by PB2 (5 µg/ml) for 12 h in the PB2 group; cells were treated with serum-free medium for 12 h followed by PDTC (2 µg/ml) for 12 h in the PDTC group; cells were treated with PB2 (5 µg/ml) for 12 h followed by LPS (1 µg/ml) for 12 h in the LPS + PB2 group; cells were treated with PDTC (2 µg/ml) for 12 h followed by LPS (1 µg/ml) for 12 h in the LPS + PDTC group. (A) Representative images of mitochondrial membrane potential identified using JC-1 fluorescent dye (green as a monomer; red-orange as a dimer) via fluorescence microscopy (magnification, ×400). (B) Quantification of the ratio of red/green fluorescence. The red fluorescence intensity and ratio of red/green fluorescence were notably increased in LPS-treated cells pretreated with PB2 or PDTC compared with cells treated with LPS alone. Compared with the vehicle control group, LPS significantly decreased the mitochondrial membrane potential, but pretreatment with PB2 and PDTC reversed LPS-induced reductions in the mitochondrial membrane potential in HUVECs. Data are presented as the mean ± SD of at least three independent experiments run in triplicate (n=3). Data were analysed using one-way ANOVA followed by Tukey's post hoc test. **P<0.01 vs. vehicle control; ##P<0.01 vs. LPS. LPS, lipopolysaccharide; PB2, procyanidin B2; PDTC, pyrrolidinedithiocarbamate ammonium; HUVEC, human umbilical vein endothelial cell.
Figure 4.
Figure 4.
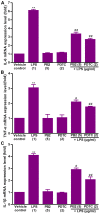
Effect of LPS, PB2 and PDTC on the mRNA expression levels of inflammatory cytokines in HUVECs. Cells were treated with serum-free medium for 24 h in the vehicle control group; cells were treated with serum-free medium for 12 h followed by LPS (1 µg/ml) for 12 h in the LPS group; cells were treated with serum-free medium for 12 h followed by PB2 (5 µg/ml) for 12 h in the PB2 group; cells were treated with serum-free medium for 12 h followed by PDTC (2 µg/ml) for 12 h in the PDTC group; cells were treated with PB2 (5 µg/ml) for 12 h followed by LPS (1 µg/ml) for 12 h in the LPS + PB2 group; cells were treated with PDTC (2 µg/ml) for 12 h followed by LPS (1 µg/ml) for 12 h in the LPS + PDTC group. (A) IL-6, (B) TNF-α and (C) IL-1β mRNA expression levels were measured via reverse transcription-quantitative PCR in HUVECs. mRNA expression levels were normalized to the internal reference gene GAPDH. Data are presented as the mean ± SD of at least three independent experiments run in triplicate (n=3). Data were analysed using one-way ANOVA followed by Tukey's post hoc test. **P<0.01 vs. vehicle control; #P<0.05, ##P<0.01 vs. LPS. LPS, lipopolysaccharide; PB2, procyanidin B2; PDTC, pyrrolidinedithiocarbamate ammonium; HUVEC, human umbilical vein endothelial cell.
Figure 5.
Figure 5.
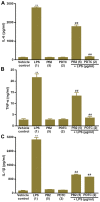
Effect of LPS, PB2 and PDTC on the protein expression levels of inflammatory cytokines in HUVECs. Cells were treated with serum-free medium for 24 h in the vehicle control group; cells were treated with serum-free medium for 12 h followed by LPS (1 µg/ml) for 12 h in the LPS group; cells were treated with serum-free medium for 12 h followed by PB2 (5 µg/ml) for 12 h in the PB2 group; cells were treated with serum-free medium for 12 h followed by PDTC (2 µg/ml) for 12 h in the PDTC group; cells were treated with PB2 (5 µg/ml) for 12 h followed by LPS (1 µg/ml) for 12 h in the LPS + PB2 group; cells were treated with PDTC (2 µg/ml) for 12 h followed by LPS (1 µg/ml) for 12 h in the LPS + PDTC group. (A) IL-6, (B) TNF-α and (C) IL-1β protein expression levels in HUVECs were detected by performing ELISAs. Data are presented as the mean ± SD of at least three independent experiments run in triplicate (n=3). Data were analysed using one-way ANOVA followed by Tukey's post hoc test. **P<0.01 vs. vehicle control; ##P<0.01 vs. LPS. LPS, lipopolysaccharide; PB2, procyanidin B2; PDTC, pyrrolidinedithiocarbamate ammonium; HUVEC, human umbilical vein endothelial cell.
Figure 6.
Figure 6.
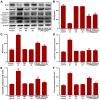
Effects of LPS, PB2 and PDTC on Bcl-2, Bax, cleaved caspase-3, cleaved caspase-7 and cleaved caspase-9 protein expression levels in HUVECs. Cells were treated with serum-free medium for 24 h in the vehicle control group; cells were treated with serum-free medium for 12 h followed by LPS (1 µg/ml) for 12 h in the LPS group; cells were treated with serum-free medium for 12 h followed by PB2 (5 µg/ml) for 12 h in the PB2 group; cells were treated with serum-free medium for 12 h followed by PDTC (2 µg/ml) for 12 h in the PDTC group; cells were treated with PB2 (5 µg/ml) for 12 h followed by LPS (1 µg/ml) for 12 h in the LPS + PB2 group; cells were treated with PDTC (2 µg/ml) for 12 h followed by LPS (1 µg/ml) for 12 h in the LPS + PDTC group. Protein expression levels in HUVECs were (A) determined via western blotting and semi-quantified for (B) Bcl-2, (C) Bax, (D) cleaved caspase-3, (E) cleaved caspase-7 and (F) cleaved caspase-9. β-actin was used as the loading control. Data are presented as the mean ± SD of at least three independent experiments run in triplicate (n=3). Data were analysed using one-way ANOVA followed by Tukey's post hoc test. **P<0.01 vs. vehicle control; #P<0.05, ##P<0.01 vs. LPS. LPS, lipopolysaccharide; PB2, procyanidin B2; PDTC, pyrrolidinedithiocarbamate ammonium; HUVEC, human umbilical vein endothelial cell.
Figure 7.
Figure 7.
Effects of LPS, PB2 and PDTC on p-IκB-α, p-IκB-β, p-NF-κB p65 and total NF-κB p65 protein expression levels in HUVECs. Cells were treated with serum-free medium for 24 h in the vehicle control group; cells were treated with serum-free medium for 12 h followed by LPS (1 µg/ml) for 12 h in the LPS group; cells were treated with serum-free medium for 12 h followed by PB2 (5 µg/ml) for 12 h in the PB2 group; cells were treated with serum-free medium for 12 h followed by PDTC (2 µg/ml) for 12 h in the PDTC group; cells were treated with PB2 (5 µg/ml) for 12 h followed by LPS (1 µg/ml) for 12 h in the LPS + PB2 group; cells were treated with PDTC (2 µg/ml) for 12 h followed by LPS (1 µg/ml) for 12 h in the LPS + PDTC group. Protein expression levels in HUVECs were (A) determined via western blotting and semi-quantified for (B) p-IκB-α/total IκB-α, (C) p-IκB-β/total IκB-β and (D) p-NF-κB p65/total NF-κB p65. β-actin was used as the loading control. Data are presented as the mean ± SD of at least three independent experiments run in triplicate (n=3). Data were analysed using one-way ANOVA followed by Tukey's post hoc test. **P<0.01 vs. vehicle control; #P<0.05, ##P<0.01 vs. LPS. LPS, lipopolysaccharide; PB2, procyanidin B2; PDTC, pyrrolidinedithiocarbamate ammonium; p, phosphorylated; HUVEC, human umbilical vein endothelial cell.
Figure 8.
Figure 8.
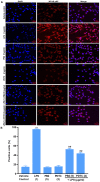
Effects of LPS, PB2 and PDTC on the nuclear translocation of NF-κB p65 in HUVECs. Cells were treated with serum-free medium for 24 h in the vehicle control group; cells were treated with serum-free medium for 12 h followed by LPS (1 µg/ml) for 12 h in the LPS group; cells were treated with serum-free medium for 12 h followed by PB2 (5 µg/ml) for 12 h in the PB2 group; cells were treated with serum-free medium for 12 h followed by PDTC (2 µg/ml) for 12 h in the PDTC group; cells were treated with PB2 (5 µg/ml) for 12 h followed by LPS (1 µg/ml) for 12 h in the LPS + PB2 group; cells were treated with PDTC (5 µg/ml) for 12 h followed by LPS (1 µg/ml) for 12 h in the LPS + PDTC group. (A) Representative images of the nuclear translocation of NF-κB p65 in HUVECs identified via immunofluorescence (magnification, ×400). (B) Quantification of the percentage of positive cells with nuclear translocation of NF-κB p65. LPS markedly increased the translocation of NF-κB p65 from the cytoplasm to the nucleus compared with the control, PB2 and PDTC groups in HUVECs. However, pretreatment with PB2 or PDTC markedly inhibited LPS-induced translocation of NF-κB p65 in HUVECs. Data are presented as the mean ± SD of at least three independent experiments run in triplicate (n=3). Data were analysed using one-way ANOVA followed by Tukey's post hoc test. **P<0.01 vs. vehicle control; ##P<0.01 vs. LPS. LPS, lipopolysaccharide; PB2, procyanidin B2; PDTC, pyrrolidinedithiocarbamate ammonium; HUVEC, human umbilical vein endothelial cell.
Figure 9.
Figure 9.
Proposed molecular mechanism underlying the effects of PB2 on LPS-induced inhibition of cell viability and apoptosis in HUVECs. PB2, procyanidin B2; LPS, lipopolysaccharide; Cyt-c, cytochrome c; Apaf1, apoptotic peptidase activating factor 1; HUVEC, human umbilical vein endothelial cell.

Similar articles

Cited by

References

    1. Gimbrone MJ, García-Cardeña G. Endothelial cell dysfunction and the pathobiology of atherosclerosis. Circ Res. 2016;118:620–636. doi: 10.1161/CIRCRESAHA.115.306301. - DOI - PMC - PubMed
    1. Yao Z, Mates JM, Cheplowitz AM, Hammer LP, Maiseyeu A, Phillips GS, Wewers MD, Rajaram MV, Robinson JM, Anderson CL, Ganesan LP. Blood-borne lipopolysaccharide is rapidly eliminated by liver sinusoidal endothelial cells via high-density lipoprotein. J Immunol. 2016;197:2390–2399. doi: 10.4049/jimmunol.1600702. - DOI - PMC - PubMed
    1. Li L, Wan G, Han B, Zha ZW. Echinacoside alleviated LPS-induced cell apoptosis and inflammation in rat intestine epithelial cells by inhibiting the mTOR/STAT3 pathway. Biomed Pharmacother. 2018;104:622–628. doi: 10.1016/j.biopha.2018.05.072. - DOI - PubMed
    1. Liang Z, Ren C. Emodin attenuates apoptosis and inflammation induced by LPS through up-regulating lncRNA TUG1 in murine chondrogenic ATDC5 cells. Biomed Pharmacother. 2018;103:897–902. doi: 10.1016/j.biopha.2018.04.085. - DOI - PubMed
    1. Ma H, Su L, He X, Miao J. Loss of HMBOX1 promotes LPS-induced apoptosis and inhibits LPS-induced autophagy of vascular endothelial cells in mouse. Apoptosis. 2019;24:946–957. doi: 10.1007/s10495-019-01572-6. - DOI - PubMed

MeSH terms