

Trends in US Pediatric Hospital Admissions in 2020 Compared With the Decade Before the COVID-19 Pandemic
- PMID: 33576819
- PMCID: PMC7881361
- DOI: 10.1001/jamanetworkopen.2020.37227
Trends in US Pediatric Hospital Admissions in 2020 Compared With the Decade Before the COVID-19 Pandemic
Erratum in
-
Error in Figure.JAMA Netw Open. 2021 Apr 1;4(4):e2111979. doi: 10.1001/jamanetworkopen.2021.11979. JAMA Netw Open. 2021. PMID: 33914055 Free PMC article. No abstract available.
Abstract
Importance: In early 2020, the United States declared a public health emergency in response to coronavirus disease 2019 (COVID-19) and implemented a variety of social distancing measures. The association between the COVID-19 pandemic and the number of pediatric admissions is unclear.
Objective: To determine the changes in patterns of pediatric admissions in 2020 compared with the prior decade.
Design, setting, and participants: This cross-sectional study included 49 US hospitals contributing to the Pediatric Health Information Systems database. Inpatient admissions were transformed into time-series data, and ensemble forecasting models were generated to analyze admissions across a range of diagnoses in 2020 compared with previous years. The setting was inpatient admissions. All patients discharged between January 1, 2010, and June 30, 2020, from an inpatient hospital encounter were included.
Main outcomes and measures: Number of hospital admissions by primary diagnosis for each encounter.
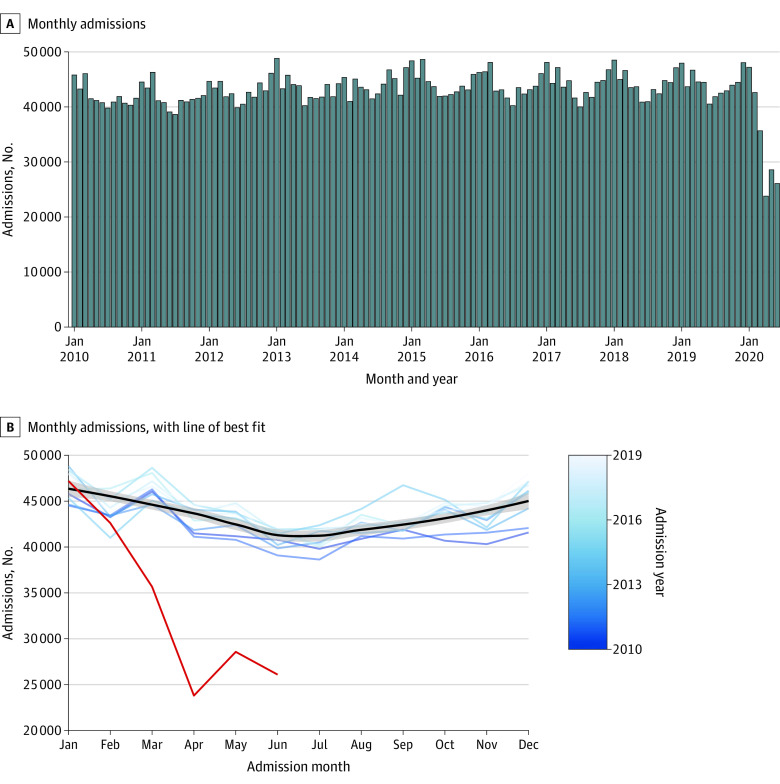
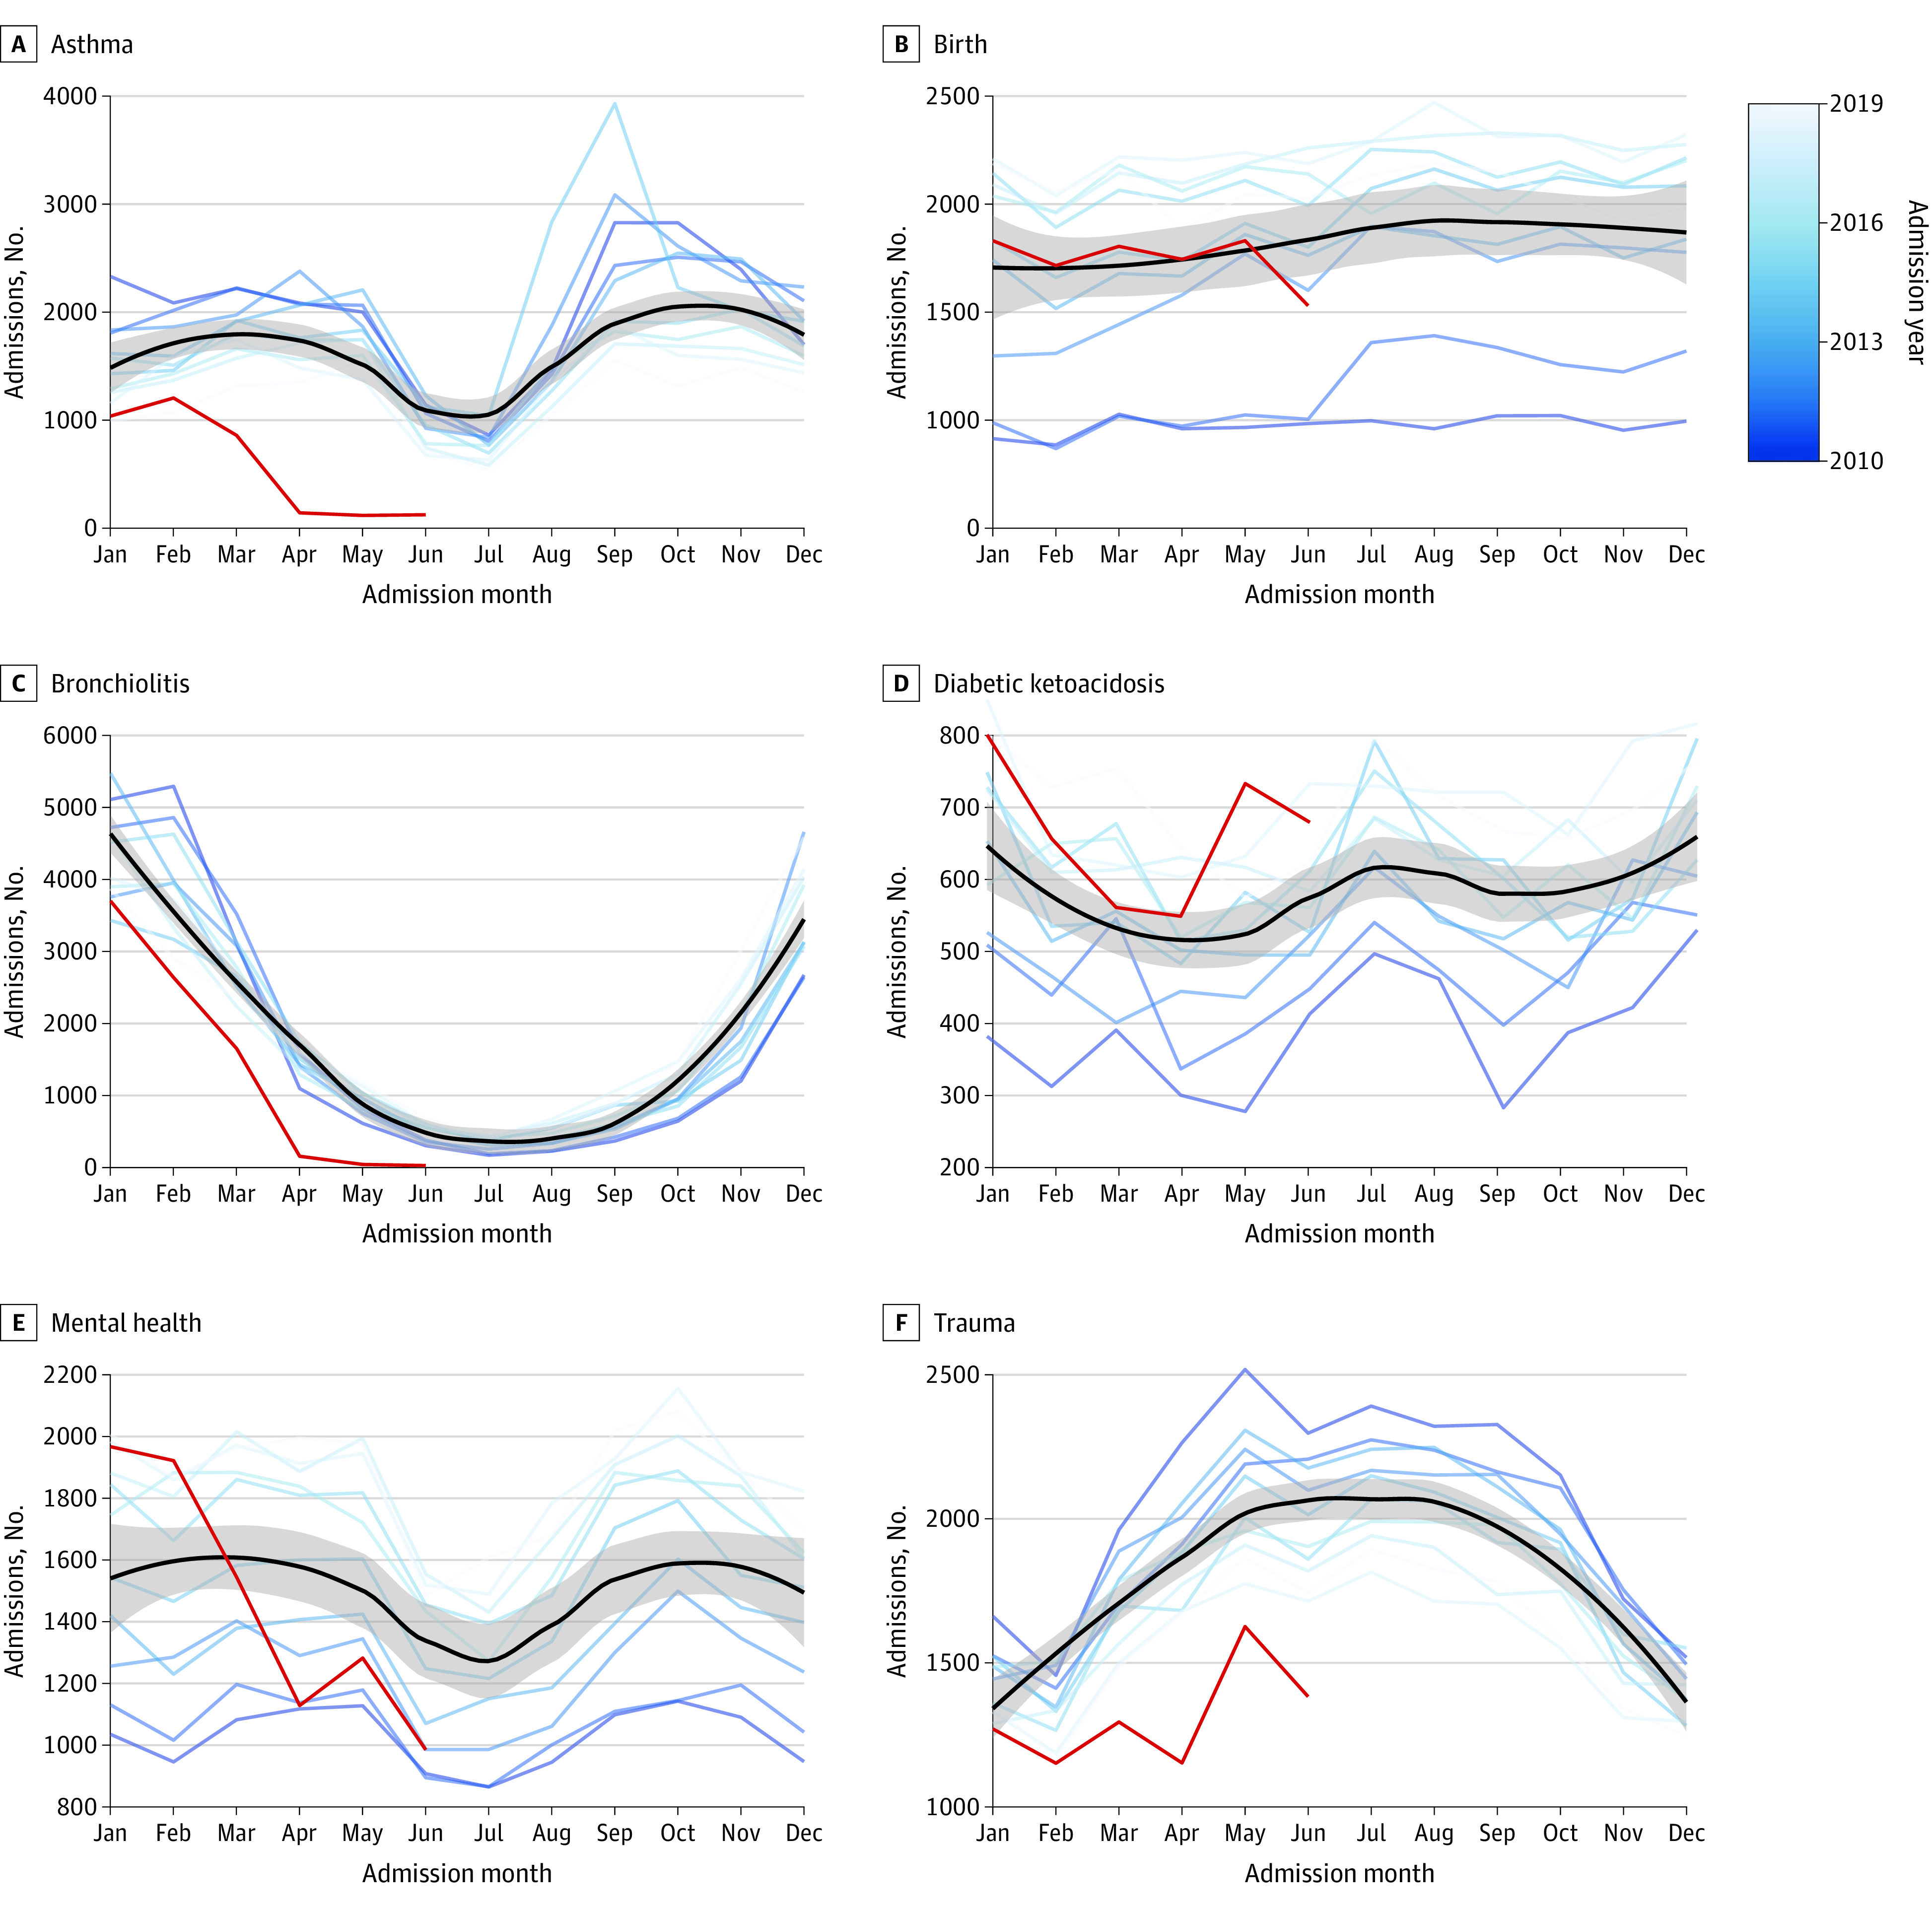
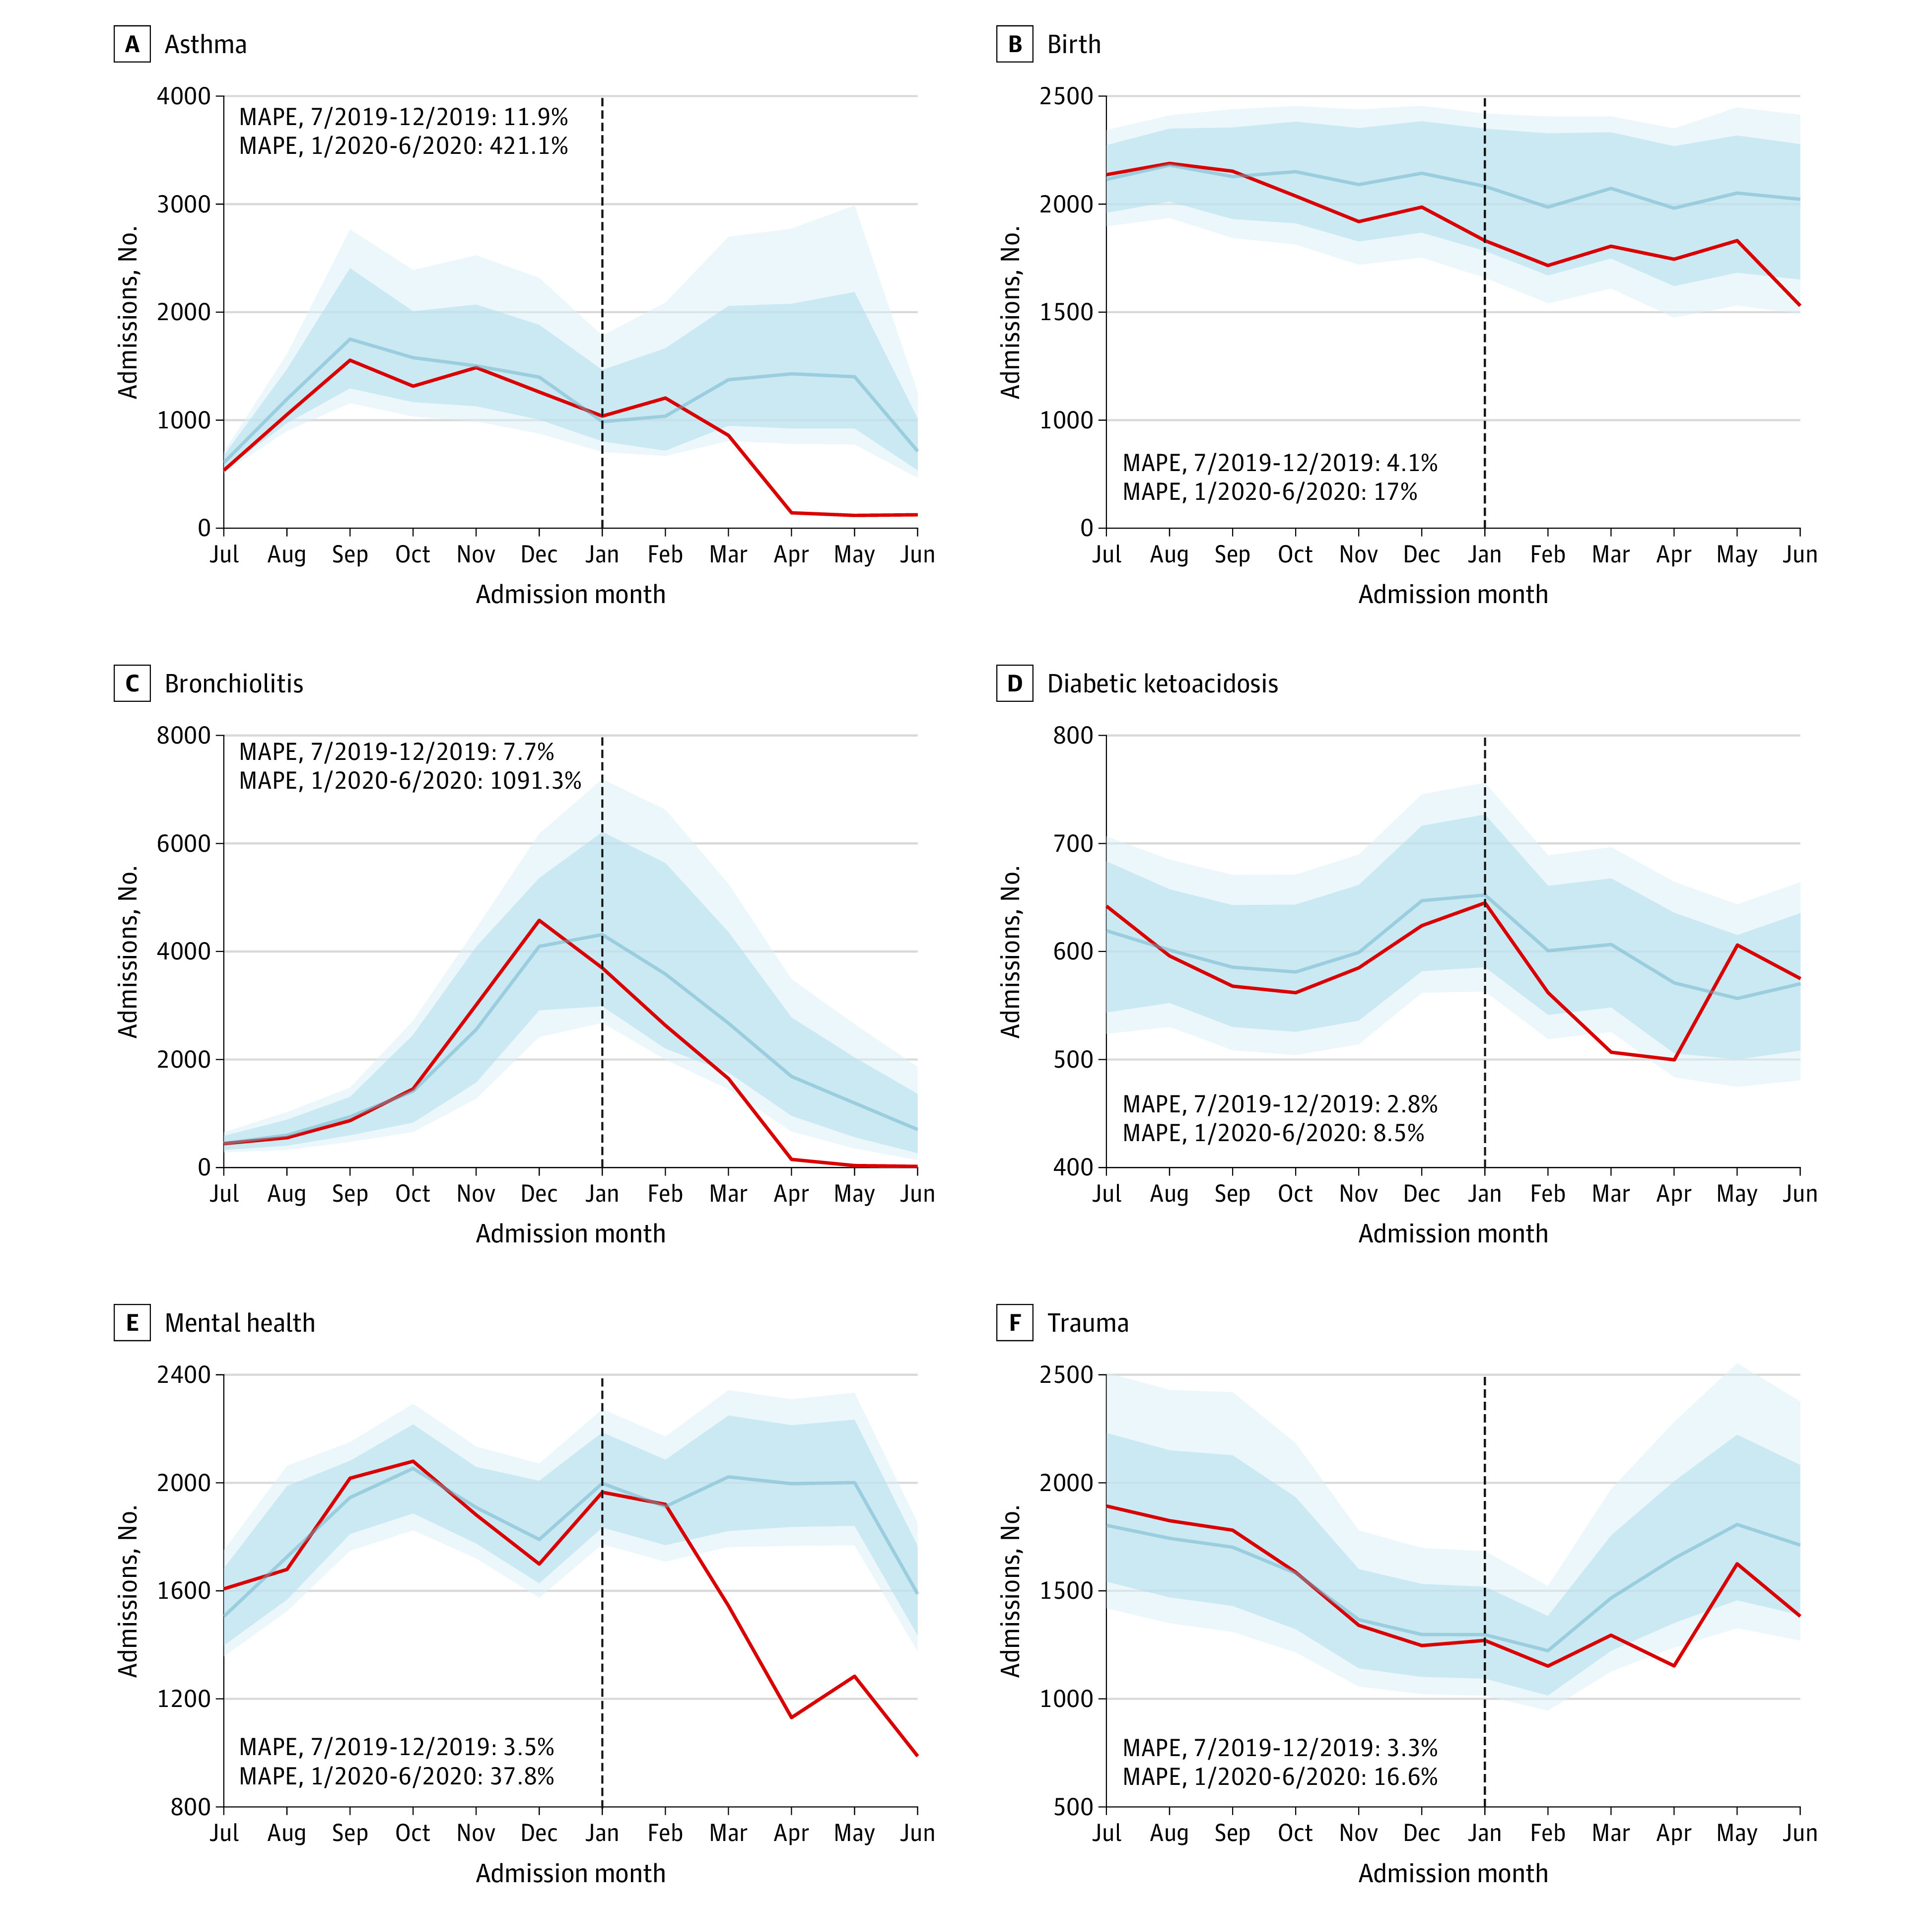
Results: Of 5 424 688 inpatient encounters among 3 372 839 patients (median [interquartile range] age, 5.1 [0.7-13.3] years; 2 823 748 [52.1%] boys; 3 171 224 [58.5%] White individuals) at 49 hospitals, 213 571 (3.9%) were between January 1, 2020, and June 30, 2020. There was a decrease in the number of admissions beginning in March 2020 compared with the period from 2010 to 2019. At the nadir, admissions in April 2020 were reduced 45.4% compared with prior years (23 798 in April 2020 compared with a median [interquartile range] of 43 550 [42 110-43 946] in April 2010-2019). Inflation-adjusted hospital charges decreased 27.7% in the second quarter of 2020 compared with prior years ($4 327 580 511 in 2020 compared with a median [interquartile range] of $5 983 142 102 [$5 762 690 022-$6 324 978 456] in 2010-2019). Seasonal patterns were evident between 2010 and 2019 for a variety of common pediatric conditions, including asthma, atrial septal defects, bronchiolitis, diabetic ketoacidosis, Kawasaki syndrome, mental health admissions, and trauma. Ensemble models were able to discern seasonal patterns in admission diagnoses and accurately predicted admission rates from July 2019 until December 2019 but not from January 2020 to June 2020. All diagnoses except for birth decreased below the model 95% CIs between January 2020 and June 2020.
Conclusions and relevance: In this cross-sectional study, pediatric admissions to US hospitals decreased in 2020 across an array of pediatric conditions. Although some conditions may have decreased in incidence, others may represent unmet needs in pediatric care during the COVID-19 pandemic.
Conflict of interest statement
Figures
References
-
- US Department of Defense Coronavirus: DOD response timeline. Updated January 6, 2021. Accessed October 27, 2020. https://www.defense.gov/Explore/Spotlight/Coronavirus/DOD-Response-Timel...
-
- US Centers for Disease Control and Prevention COVID-19 data from the National Center for Health Statistics. Published October 9, 2020. Accessed October 27, 2020. https://www.cdc.gov/nchs/covid19/index.htm
-
- Moreland A, Herlihy C, Tynan MA, et al. ; CDC Public Health Law Program; CDC COVID-19 Response Team, Mitigation Policy Analysis Unit . Timing of state and territorial COVID-19 stay-at-home orders and changes in population movement—United States, March 1–May 31, 2020. MMWR Morb Mortal Wkly Rep. 2020;69(35):1198-1203. doi: 10.15585/mmwr.mm6935a2 - DOI - PMC - PubMed
Publication types
MeSH terms
Grants and funding
LinkOut - more resources
Full Text Sources
Other Literature Sources
Medical
Miscellaneous
