. 2021 Sep;70(9):2601-2616.
doi: 10.1007/s00262-021-02872-0. Epub 2021 Feb 12.

Regulatory T cells promote glioma cell stemness through TGF-β-NF-κB-IL6-STAT3 signaling

Affiliations

Regulatory T cells promote glioma cell stemness through TGF-β-NF-κB-IL6-STAT3 signaling

Shasha Liu et al. Cancer Immunol Immunother. 2021 Sep.

Abstract

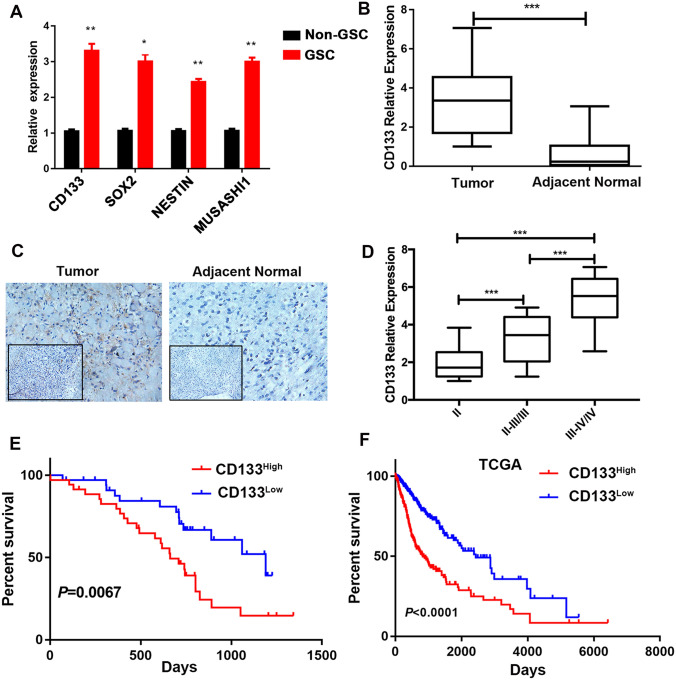
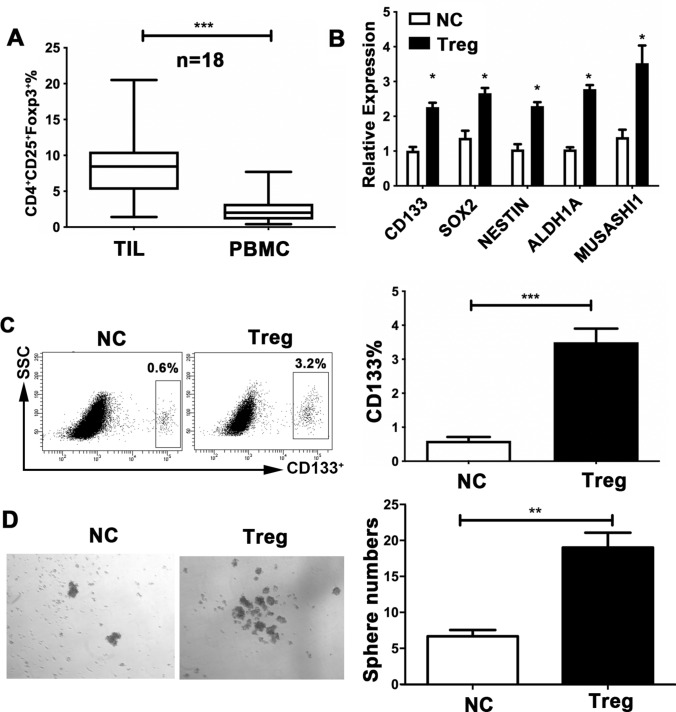
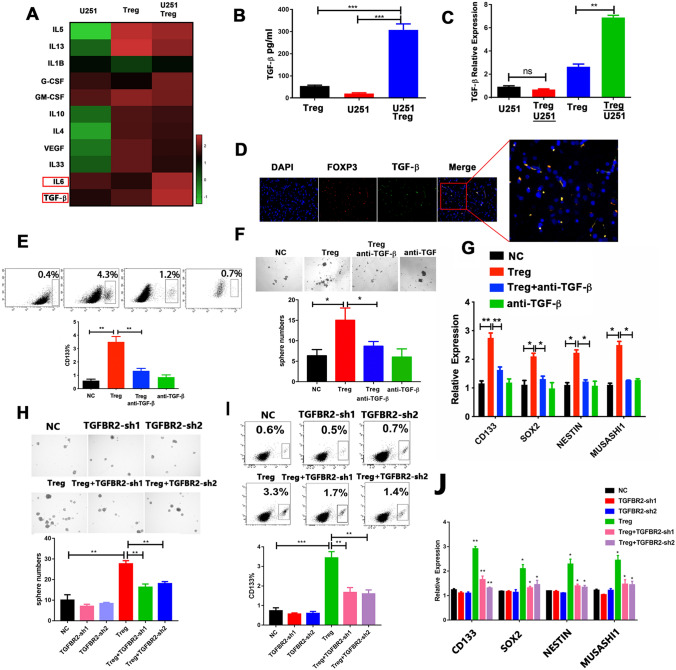
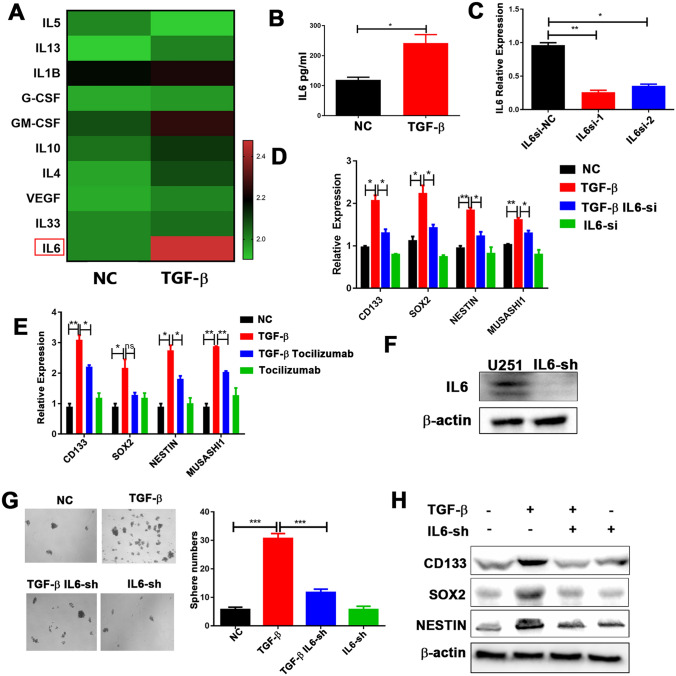
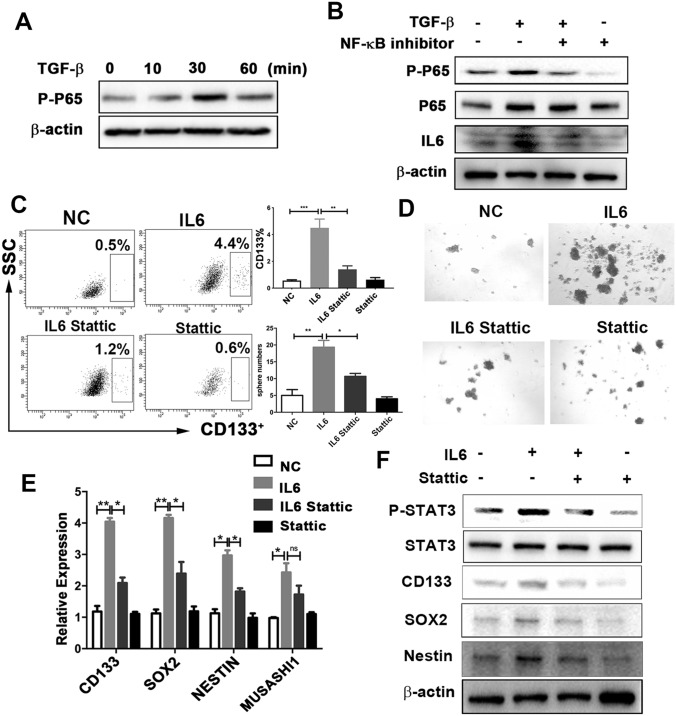
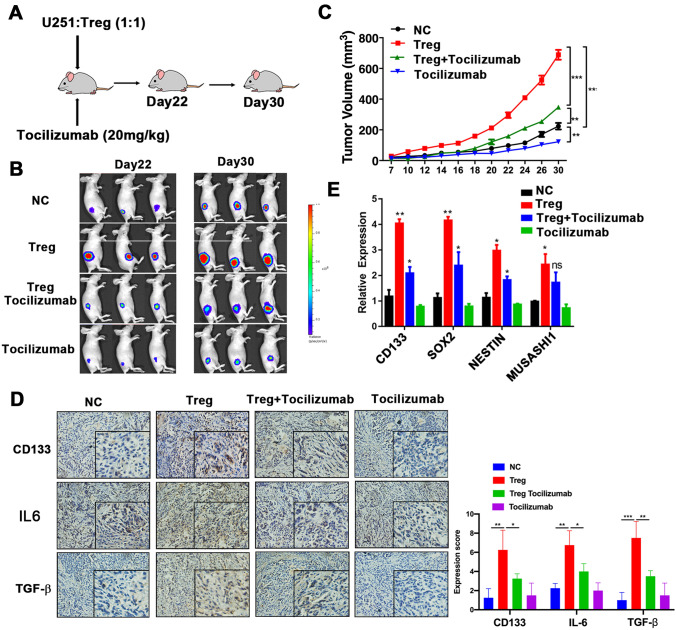
Glioma stem cells (GSCs) contribute to the malignant growth of glioma, but little is known about the interaction between GSCs and tumor microenvironment. Here, we found that intense infiltration of regulatory T cells (Tregs) facilitated the qualities of GSCs through TGF-β secretion that helped coordinately tumor growth. Mechanistic investigations indicated that TGF-β acted on cancer cells to induce the core cancer stem cell-related genes CD133, SOX2, NESTIN, MUSASHI1 and ALDH1A expression and spheres formation via NF-κB-IL6-STAT3 signaling pathway, resulting in the increased cancer stemness and tumorigenic potential. Furthermore, Tregs promoted glioma tumor growth, and this effect could be abrogated with blockade of IL6 receptor by tocilizumab which also demonstrated certain level of therapeutic efficacy in xenograft model. Additionally, expression levels of CD133, IL6 and TGF-β were found to serve as prognosis markers of glioma patients. Collectively, our findings reveal a new immune-associated mechanism underlying Tregs-induced GSCs. Moreover, efforts to target this network may be an effective strategy for treating glioma.

Keywords: Glioma; Glioma stem cell; TGF-β; Tocilizumab; Tregs.


Conflict of interest statement

The authors declare that they have no conflict of interests.

Figures

Fig. 1
Fig. 1
Expression of CD133 is enriched in glioma stem cells (GSCs) and indicates poorer survival in glioma patients. a Expression of CD133, SOX2, NESTIN, and MUSASHI1, analyzed using reverse-transcription PCR (RT-PCR) of the GSCs generated by the spheres of the glioma cells and non-GSCs (U251 cells). b Expression of CD133 was elevated in the tumor tissues (n = 72) compared to the adjacent normal tissues (n = 72). cCD133 expression in tumor and adjacent tissues, detected using immunohistochemistry. d CD133 expression showing a positive correlation with WHO grade in glioma patients. We divided patients into ‘‘low’’ and ‘‘high’’ groups based on the median value of CD133. Kaplan–Meier of overall survival for patients with e low (n = 35) and high (n = 35) CD133 expression, and f low (n = 393) and high (n = 304) CD133 expression in the TCGA database. Results are based on three independent experiments. P < 0.05; **P < 0.01; ***P < 0.001
Fig. 2
Fig. 2
Regulatory T cells (Tregs) promote glioma stem cell (GSC) capacity in glioma cells. a Distribution of CD4+CD25+Foxp3+ Tregs in peripheral blood and tumor samples from glioma patients (n = 50), analyzed the percentage of total lymphocytes using flow cytometry. bCD133, SOX2, NESTIN, ALDH1A, and MUSASHI1 expression in the U251 cells, detected using reverse-transcription PCR, following co-culture with Tregs (1:1; Transwell) sorted from the peripheral blood of the glioma patients. c CD133+ proportions of U251 cells, assessed by flow cytometry, following co-culture with Tregs for 24 h in transwell chambers. d U251 cells and Tregs co-cultured under sphere-forming conditions. The number of spheres per field was averaged from five randomly selected fields. Results are based on three independent experiments. *P < 0.05; **P < 0.01; ***P < 0.001. NC normal control
Fig. 3
Fig. 3
Regulatory T cells (Tregs) secrete TGF-β which promotes GSC expansion. a A multiple-cytokine kit was used to detect cytokines in the supernatants from the U251/Tregs co-culture and from the U251 and Tregs cultures alone. b The TGF-β protein level, validated using ELISA. c TGF-β expression in cells from the co-cultured system and from the U251 and Tregs cultures alone, based on reverse-transcription PCR (RT-PCR). d Immunofluorescence localization analysis of Foxp3 (red) and TGF-β (green) in glioma tissues; colocalization of Foxp3 and TGF-β is indicated in yellow. Scale bars: 200 μm. e CD133+ proportions in U251 cells co-cultured with Tregs in the presence of TGF-β-neutralizing antibody (1 μg/ml) and of control cells. f The number of spheres generated from U251 cells co-cultured with Tregs, with or without the TGF-β-neutralizing antibody (1 μg/ml). The number of spheres per field was averaged from five randomly selected fields. g Expression of cancer stemness genes CD133, SOX2, NESTIN, and MUSASHI1 in U251 cells co-cultured with Tregs in the presence of TGF-β-neutralizing antibody (1 μg/ml) and of control cells, determined using RT-PCR. h Sphere numbers in U251 cells transfected with shTGFBR2 and control cells with or without Tregs. The number of spheres per field was averaged from five random fields. i CD133+ proportions in shTGFBR2-U251 cells and control cells with or without Tregs, analyzed using flow cytometry. j Expression of CD133, SOX2, NESTIN, and MUSASHI1 in shTGFBR2-U251 cells and control cells with or without Tregs, evaluated using RT-PCR analysis. Results are based on three independent experiments. *P < 0.05; **P < 0.01; ***P < 0.001
Fig. 4
Fig. 4
IL6-IL6R signaling mediates GSC properties induced by TGF-β. a Cytokine levels with or without TGF-β treatment (10 ng/ml), evaluated using a multiple-cytokine kit. b IL6 protein expression levels, validated using ELISA. c U251 cells were infected with siRNA to inhibit the expression of IL6. IL6 expression was examined by reverse-transcription PCR (RT-PCR). Expression of CD133, SOX2, NESTIN, and MUSASHI1 in d U251 cells transfected with either si-scramble or siIL6, following TGF-β (10 ng/ml) treatment, and in e U251 cells treated with tocilizumab (5 μg/ml) following TGF-β treatment (10 ng/ml), evaluated using RT-PCR. f IL6 expression, examined by western blotting analysis, in U251 cells transfected with lentiviral sh-IL6. g Sphere-formation capacity of U251 cells transfected with either sh-scramble or sh-IL6 following TGF-β treatment (10 ng/ml), assessed by sphere-formation assay. h CD133, SOX2, and NESTIN expression in U251 cells transfected with either sh-scramble or shIL6 following TGF-β treatment (10 ng/ml), assessed using western blotting analysis. Results are based on three independent experiments. *P < 0.05; **P < 0.01; ***P < 0.001
Fig. 5
Fig. 5
The STAT3 signaling pathway mediates IL6-induced GSC properties. a Expression of phospho-p65 under TGF-β treatment (10 ng/ml) at different times, assessed using western blotting analysis. b U251 cells were pretreated with NF-κB inhibitor (EVP4593) for 30 min, followed by TGF-β treatment (10 ng/ml) for 30 min and 24 h. The expression of phospho-p65 and IL6 was examined using western blotting analysis. c–f: U251 cells were pretreated with Stattic (10 umol/L, 30 min), followed by IL6 treatment (10 ng/ml, 24 h). c Cells were harvested to determine the proportion of CD133 cells. d Sphere numbers, determined using sphere-formation assay. The number of spheres per field was averaged from five random fields. e Expression of CD133, SOX2, NESTIN, and MUSASHI, analyzed using reverse-transcription PCR. f Expression of phospho-STAT3, STAT3, CD133, SOX2, and NESTIN, assessed using western blotting analysis. Results are based on three independent experiments. *P < 0.05; **P < 0.01; ***P < 0.001. NC normal control
Fig. 6
Fig. 6
Tocilizumab blocks Tregs promotion of glioma tumor growth and stemness expansion in a mouse model in vivo. a In vivo experimental design. b Representative bioluminescent images of mouse growth, using an in vivo imaging system. c Tumor growth under each treatment. d Expression of CD133, SOX2, NESTIN, and MUSASHI, assessed using reverse-transcription PCR, in the tumor tissues of the indicated mice. *P < 0.05; **P < 0.01; ***P < 0.001

References

    1. Louis DN, Perry A, Reifenberger G, et al. The 2016 world health organization classification of tumors of the central nervous system: a summary. Acta Neuropathol. 2016;131:803–820. doi: 10.1007/s00401-016-1545-1. - DOI - PubMed
    1. Brada M, Yung WK. Clinical trial end points in malignant glioma: need for effective trial design strategy. Semin Oncol. 2000;27:11–19. - PubMed
    1. Furnari FB, Fenton T, Bachoo RM, et al. Malignant astrocytic glioma: genetics, biology, and paths to treatment. Genes Dev. 2007;21:2683–2710. doi: 10.1101/gad.1596707. - DOI - PubMed
    1. Zheng J, Liu X, Xue Y, Gong W, Ma J, Xi Z, Que Z, Liu Y. TTBK2 circular RNA promotes glioma malignancy by regulating miR-217/HNF1beta/Derlin-1 pathway. J Hematol oncol. 2017;10:52. doi: 10.1186/s13045-017-0422-2. - DOI - PMC - PubMed
    1. Xue S, Hu M, Iyer V, Yu J. Blocking the PD-1/PD-L1 pathway in glioma: a potential new treatment strategy. J Hematol oncol. 2017;10:81. doi: 10.1186/s13045-017-0455-6. - DOI - PMC - PubMed

MeSH terms

LinkOut - more resources