. 2021 May;27(9):1859-1878.
doi: 10.1111/gcb.15556. Epub 2021 Mar 6.

Heatwave-induced synchrony within forage fish portfolio disrupts energy flow to top pelagic predators

Affiliations

Heatwave-induced synchrony within forage fish portfolio disrupts energy flow to top pelagic predators

Mayumi L Arimitsu et al. Glob Chang Biol. 2021 May.

Abstract

During the Pacific marine heatwave of 2014-2016, abundance and quality of several key forage fish species in the Gulf of Alaska were simultaneously reduced throughout the system. Capelin (Mallotus catervarius), sand lance (Ammodytes personatus), and herring (Clupea pallasii) populations were at historically low levels, and within this community abrupt declines in portfolio effects identify trophic instability at the onset of the heatwave. Although compensatory changes in age structure, size, growth or energy content of forage fish were observed to varying degrees among all these forage fish, none were able to fully mitigate adverse impacts of the heatwave, which likely included both top-down and bottom-up forcing. Notably, changes to the demographic structure of forage fish suggested size-selective removals typical of top-down regulation. At the same time, changes in zooplankton communities may have driven bottom-up regulation as copepod community structure shifted toward smaller, warm water species, and euphausiid biomass was reduced owing to the loss of cold-water species. Mediated by these impacts on the forage fish community, an unprecedented disruption of the normal pelagic food web was signaled by higher trophic level disruptions during 2015-2016, when seabirds, marine mammals, and groundfish experienced shifts in distribution, mass mortalities, and reproductive failures. Unlike decadal-scale variability underlying ecosystem regime shifts, the heatwave appeared to temporarily overwhelm the ability of the forage fish community to buffer against changes imposed by warm water anomalies, thereby eliminating any ecological advantages that may have accrued from having a suite of coexisting forage species with differing life-history compensations.

Keywords: Gulf of Alaska; ecosystem response; forage fish; marine heatwave; portfolio effects.


Figures

FIGURE 1
FIGURE 1
Generalized life‐history strategies, including monthly timing of spawning, larvae, and early juvenile stages, for three key forage fish species in the North Pacific
FIGURE 2
FIGURE 2
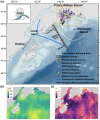
(a) Map of the study area, including sampling locations in Prince William Sound (PWS) and the northern Gulf of Alaska (GOA). Capelin survey extent includes the larger Gulf of Alaska region (blue shaded area, inset). Seafloor depth reaches over 4500 m in the study area (>700 m in PWS) with lighter shading representing shallower depths, the 500 m isobath is denoted by a dashed‐blue line. Distribution of marine heatwave event indices during 2014–2016 including (b) cumulative number of heatwave days, and (c) mean of long‐term (1982–2018) sea surface temperature anomalies for heatwave events in each pixel
FIGURE 3
FIGURE 3
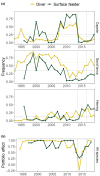
(a) Forage fish availability indices (frequency of occurrence) in seabird diets by feeding guild (color) at Middleton Island. Mean values across all years are shown as horizontal lines, and dotted vertical lines demarcate the timing of the Pacific Marine Heatwave. (b) Portfolio effects as a measure of the degree of synchrony among capelin, herring, and sand lance indices by seabird feeding guild. Portfolio effects were computed from variance ratios across 3‐year centered rolling windows, with lower values indicating greater synchrony and lower buffering capacity by the forage fish community
FIGURE 4
FIGURE 4
Survey indices for (a) Gulf of Alaska (GOA) capelin (mean ± SE catch per unit effort, CPUE, kg km−2) by survey type. Years in which capelin densities were too low to assess during acoustic‐trawl surveys are denoted by ‘x’. (b) Prince William Sound (PWS) herring spring spawning index (mile‐days milt). Dotted vertical lines demarcate the timing of the Pacific marine heatwave
FIGURE 5
FIGURE 5
Forage fish age, length, and energy content in the Northern Gulf of Alaska. (a) Length at age histogram from spawning male capelin within Prince William Sound (PWS) during July 2013 and 2016. Dashed line indicates the mean length in each year. (b) Interannual variability of whole fish energy for age‐1 sand lance within PWS. Points represent the values of outliers. (c) Sand lance catch per unit effort (CPUE) by year and size group in seabird diets at Middleton Island during June–August
FIGURE 6
FIGURE 6
Prince William Sound (PWS) herring indices, (a) age‐3 growth anomalies from scale increment width measurements, (b) spring pre‐spawning weight anomalies, and (c) estimated least square mean (±95% CI) juvenile total energy and mean energy density (ED, kJ g−1 wet weight, color) in March and November. Anomalies were standardized to mean 0, SD 1.
FIGURE 7
FIGURE 7
Mean (SD) biomass of euphausiids by year, region, season, and species (color) sampled along the Gulf of Alaska shelf and Prince William Sound (PWS)
FIGURE 8
FIGURE 8
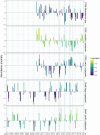
Monthly log‐transformed copepod abundance indices (color) standardized anomalies (bars) for species groups sampled in Prince William Sound (PWS, bongo net, m−3) and along the Gulf of Alaska shelf (continuous plankton recorder, sample−1). Dotted horizontal lines demarcate the timing of the Pacific marine heatwave, and spring months (March–May) are shaded in light blue
FIGURE 9
FIGURE 9
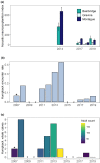
Prince William Sound humpback whale indices. (a) Acoustic macrozooplankton index (nautical area scattering coefficient, m2 nmi−2) sampled within humpback whale foraging locations during fall. (b) Humpback whale encounter rates (individuals km−1). *Note the survey in 2007 was incomplete. (c) Number of calves and adult counts (color) observed on surveys
FIGURE 10
FIGURE 10
Murre (Uria spp.) standardized density anomalies (mean of 0 and SD of 1 for each season and region). September surveys in the oceanic region, in which no murres were observed, are indicated by ‘x’. Dotted horizontal lines demarcate the timing of the Pacific marine heatwave. PWS, Prince William Sound

References

    1. Abookire, A. A. , & Piatt, J. F. (2005). Oceanographic conditions structure forage fishes into lipid‐rich and lipid‐poor communities in lower Cook Inlet, Alaska, USA. Marine Ecology Progress Series, 287, 229–240. 10.3354/meps287229 - DOI
    1. Alaska Department of Fish and Game . (2019). Scales as growth history records for Pacific herring in Prince William Sound. Alaska Ocean Observing System Gulf of Alaska data portal. Retrieved from https://gulf‐of‐alaska.portal.aoos.org/#metadata/35fd35d8‐f6f1‐4762‐9cf0...
    1. Anderson, P. J. , & Piatt, J. F. (1999). Community reorganization in the Gulf of Alaska following ocean climate regime shift. Marine Ecology Progress Series, 189, 117–123. 10.3354/meps189117 - DOI
    1. Arimitsu, M. L. , Piatt, J. F. , Heflin, B. M. , & Marsteller, C. E. (2017). Pelagic ecosystems forage fish component – Data from Prince William Sound: Distribution, abundance, and morphology of fish, zooplankton, and predators and oceanographic conditions (ver 2.0, November 2020): U.S. Geological Survey data release. 10.5066/F74J0C9Z - DOI
    1. Arimitsu, M. L. , Piatt, J. F. , Litzow, M. A. , Abookire, A. A. , Romano, M. D. , & Robards, M. D. (2008). Distribution and spawning dynamics of capelin (Mallotus villosus) in Glacier Bay, Alaska: A cold water refugium. Fisheries Oceanography, 17(2), 137–146. 10.1111/j.1365-2419.2008.00470.x - DOI

LinkOut - more resources