. 2021 Feb 12;11(2):1449-1483.
doi: 10.1002/cphy.c200001.

Air Hunger: A Primal Sensation and a Primary Element of Dyspnea

Affiliations

Air Hunger: A Primal Sensation and a Primary Element of Dyspnea

Robert B Banzett et al. Compr Physiol. .

Abstract

The sensation that develops as a long breath hold continues is what this article is about. We term this sensation of an urge to breathe "air hunger." Air hunger, a primal sensation, alerts us to a failure to meet an urgent homeostatic need maintaining gas exchange. Anxiety, frustration, and fear evoked by air hunger motivate behavioral actions to address the failure. The unpleasantness and emotional consequences of air hunger make it the most debilitating component of clinical dyspnea, a symptom associated with respiratory, cardiovascular, and metabolic diseases. In most clinical populations studied, air hunger is the predominant form of dyspnea (colloquially, shortness of breath). Most experimental subjects can reliably quantify air hunger using rating scales, that is, there is a consistent relationship between stimulus and rating. Stimuli that increase air hunger include hypercapnia, hypoxia, exercise, and acidosis; tidal expansion of the lungs reduces air hunger. Thus, the defining experimental paradigm to evoke air hunger is to elevate the drive to breathe while mechanically restricting ventilation. Functional brain imaging studies have shown that air hunger activates the insular cortex (an integration center for perceptions related to homeostasis, including pain, food hunger, and thirst), as well as limbic structures involved with anxiety and fear. Although much has been learned about air hunger in the past few decades, much remains to be discovered, such as an accepted method to quantify air hunger in nonhuman animals, fundamental questions about neural mechanisms, and adequate and safe methods to mitigate air hunger in clinical situations. © 2021 American Physiological Society. Compr Physiol 11:1449-1483, 2021.


Figures

Figure 1.
Figure 1.
Air hunger provokes strong emotional response compared to maximal breathing work. Data from Reference (20) Figs 5&6. Healthy naïve subjects were exposed to the maximum tolerable air hunger stimulus (blue bars) and were required to do the maximal amount of inspiratory work of breathing (red bars). Data plotted are group mean ±SE. The air hunger stimulus comprised mild hypercapnia (PETCO2 6 Torr above resting) combined with progressively decreased ventilation until the tolerable limit was reached. The work stimulus comprised constant eucapnia while the subject breathed against moderate resistance and progressively higher ventilation target until task failure. Mild hyperoxia prevailed throughout; FIO2 was 30%. Adapted with permission of the American Thoracic Society (ATS). Copyright © 2020 ATS. All rights reserved. Am J Respir Crit Care Med 177:1384–1390. The Am J Respir Crit Care Med is an official journal of the ATS. Readers are encouraged to read the entire article for the correct context at [doi: 10.1164/rccm.200711-1675OC]. The authors, editors, and The ATS are not responsible for errors or omissions in adaptations.
Figure 2.
Figure 2.
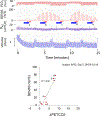
Methodology. Upper panel: Time tracing of physiological variables during one run of a typical air hunger study in a healthy volunteer, together with resultant stimulus response plot (Subject AF92 in reference 21). Traces from top: Tidal PCO2, Visual Analog Scale rating of Breathing Discomfort (BDVAS) at 15 sec intervals, pressure at the mouthpiece (PAO), volume derived from integrated flow signal (the initial transient is due to the start-up effect of a high-pass filter). Inspired fraction of CO2 was varied manually to achieve desired PETCO2. Five large breaths were delivered at the time of each PCO2 step in order to speed gas change and to give the subject momentary relief when at high discomfort. Red bars indicate times of collection of BDVAS ratings; blue horizontal bars below BDVAS tracing indicate periods for collection of physiological data. As explained more fully in the text, the air hunger response lags changes in end-tidal PCO2 and changes in tidal volume (14); therefore air hunger measurements are offset in time to account for the slow air hunger dynamic response. Lower panel: The 90 sec average PETCO2 plotted against the average of 3 BDVAS ratings comprise one data point. This run resulted in 5 of the data points on this plot of breathing discomfort rating vs ΔPETCO2 expressed as torr above mean resting PETCO2 (42.5 Torr in this subject). Each data point is labelled in both panels. Mild hyperoxia prevailed throughout; FIO2 was 30%. Adapted with permission License #4834191357251.
Figure 3.
Figure 3.
Normative data of the air hunger response vs CO2 stimulus showing variance in air hunger stimulus-response among 16 normal subjects. Data re-plotted from reference (12), Table 2. This figure depicts a regression line for each subject, as well as the mean of all subjects (heavy black line). In this study subjects rated air hunger on a 7-point ordinal scale implemented with an electronic box with 7 evenly spaced buttons ranging from no air hunger intolerable air hunger. It was later determined that subjects treated this scale in the same way as they treated a VAS with the same scale definitions(136). Ventilation was determined by a volume-control ventilator that delivered constant frequency and tidal volume resulting in minute ventilation of at 0.16 liters•min−1•kg−1; inspired gas contained 50% O2 and a variable fraction of CO2 manually controlled to achieve desired PETCO2. Because air hunger is a very distressing sensation, subjects were told that if they rated 100% of scale (i.e., intolerable) we would immediately reduce the stimulus, reducing discomfort in 2 to 5 breaths, or they could remove the mouthpiece and experience immediate relief. The variance of this perceptual response among subjects is similar to that reported for the reflex-driven hypercapnic ventilatory response (HCVR).
Figure 4.
Figure 4.
Normative data of the air hunger response vs CO2 stimulus, summarizing data from several studies in which ventilation was near resting level with background hyperoxia. The Y axis is the subject rating expressed as percent full scale (%FS), top of the scale defined as intolerable, PETCO2 = end-tidal PCO2. The solid line represents the mean regression line from 5 studies using rating scales that defined the upper end of the scale as ‘intolerable’ as shown in Table 1. The solid red circle represents data from Remmers et al (203), showing the PETCO2 at which subjects could not tolerate breathing to the ventilation target of 10 L•min−1 (we infer that this is the same as a rating of intolerable). The open blue circle represents data from Mithoefer et al, including the data supplement, (154) showing the PCO2 in the rebreathing bag at the point where subjects could no longer tolerate rebreathing, utilizing the average of hyperoxic runs with ending ventilation closest to 10 L•min−1. The vertical dotted green line shows data from Castele et al, (44) and represents the PETCO2 at which subjects first reported that ventilatory needs were not satisfied (they did not give a rating). One of the studies in Table A, reference (12), used a discrete scale, the lowest point of which is comparable to the threshold – this is indicated by X. The small PETCO2 difference between the BD0 intersection and the threshold points is probably due to the subject’s ‘decision criterion’: i.e., there must be some finite sensation before a subject will decide to report the presence of sensation.
Figure 5.
Figure 5.
Time course of air hunger during breath hold to break point, followed by rebreathing of alveolar gas, and second breath hold. This shows the relief of air hunger from mechanoreceptors sensitive to lung inflation is sufficient to permit a second breath hold with no improvement of blood gasses. Recordings in one subject of respiratory airflow, airway PCO2, O2 saturation (SaO2), breathing ‘discomfort’ was reported using a visual analog scale (VAS) where the top of the scale was defined as the sensation at breakpoint of a maximal breath hold; subjects described this sensation in terms equivalent to air hunger (see text). The subject performed a maximal duration breath hold at total lung capacity (BH 1), then rebreathed five breaths of 8.2% O2 and 7.5% CO2, and then performed a second breath hold (BH2). There were progressive increases in air hunger during breath hold and a rapid, but not instantaneous relief when breathing resumed. Dashed lines represent the estimated rising PaCO2 during breath hold. Note substantial relief of air hunger during rebreathing despite increased PCO2 and decreased SaO2. (with permission from reference 91); license #4823800766466.
Figure 6.
Figure 6.
Effect of increased ventilation on air hunger in healthy subjects, quantifying mechanoreceptor relief. In all cases PETCO2 was kept the same in both ventilation conditions by raising inspired PCO2 as ventilation was increased. Solid triangles show data from reference (105) Experiment 3 during mechanical ventilation; solid diamonds show data from reference (85) during mechanical ventilation; open squares show data from reference (162) during bag-limited ventilation. All studies were done under mild hyperoxia. Given the somewhat different methods, starting points, and individual subjects, the responses are quite similar, and show a profound inhibition (relief) of air hunger at the higher ventilation.
Figure 7.
Figure 7.
Effect of minute ventilation on air hunger. Composite graph of two studies using widely different methodologies in which PETCO2 and tidal volume were varied against a background of constant hyperoxia. Panel A: The solid line indicates the mean air hunger response of 12 subjects to alterations of PETCO2 when ventilation was restricted to mean of 10 L•min−1 by a bag-limit device combined with a metronome set at 14 breaths•min−1; the hollow square points connected by the dashed line are from the same subjects when the ventilation limit was increased from 10 to 20 L•min−1 by increasing flow to the bag (162). The filled red circles are from a different study in which 4 subjects breathed to targets of 5, 10, and 20 L•min−1 and a metronome set at 14 breaths•min−1 as PETCO2 was slowly raised until the subject reported that the sensation was intolerable (203). Tolerance limit is assumed to be 100%FS air hunger. The dotted lines are hypothetical; the right dotted line is constructed from data points from the two studies, and the left dotted line is assumed to have the same slope extending from one data point, but the region below the question mark on the 5 L•min−1 line cannot be explored in steady state without extraordinary methods such as extracorporeal exchange to reduce PETCO2 at low ventilation. Panel B: An approximate 3-D representation of the same data.
Figure 8.
Figure 8.
Time course of air hunger response to onset of hypoxia shows the same biphasic response as the hypoxic ventilatory response. Solid circles represent the average air hunger response to a step reduction in PETO2 during constant mechanical ventilation at eucapnia. For comparison, the open circles depict the average response of ventilation during free breathing to a step reduction in PETO2 during constant PETCO2 at eucapnia during a separate session in the same subjects. From reference (157), with permission RightsLink.
Figure 9.
Figure 9.
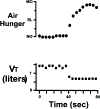
Time course of air hunger response to a step change in tidal volume at constant PETCO2 and PETO2. Although mechanoreceptors respond fully on the first breath, central neural processes act as a low-pass filter, slowing the perceptual response. Step changes in tidal volume were effected during mechanical volume-control ventilation, while PETCO2 and PETO2 were held constant by altering inspired gasses. Breath by breath mean tidal volumes (VT) and air hunger ratings were averaged from 30 steps in 6 healthy subjects. Breaths were aligned with respect to the step change in tidal volume. This experiment was conducted under mild hyperoxia (PETO2 approximately 160 Torr) (reprinted reference 85) with permission RightsLink.
Figure 10.
Figure 10.
Likely neural pathways for air hunger based on current information. Inputs and outputs are in italics, structures are normal font. The heavy blue arrows indicate the currently favored pathway for air hunger sensation; green arrows indicate the generally accepted pathway for reflex ventilatory response; black indicates structures and stimuli in common for air hunger and ventilatory responses; red dashed arrow indicates the pathway for relief (inhibition) of air hunger sensation by mechanoreceptor input coming from slowly adapting pulmonary stretch receptors (SAPSRs). SAPSR input projects both to brainstem neurons and to cortical neurons – the level at which air hunger relief is effected is currently unknown.
Figure 11.
Figure 11.
Differential effect on respiratory sensations of partial neuromuscular block with short-acting agent (mivacurium). These data show that air hunger and work/effort sensations are distinct, driven by different neural mechanisms. Air hunger ratings = blue filled circles; work ratings = red filled circles; breathing effort ratings = open squares. Upper panel: Subjects breathed to a 30 liter•min−1 target while eucapnic PETCO2 was maintained by altering inspired PCO2. In the upper panel it can be seen that during volitional hyperpnea partial paralysis had a large effect on perceived work and effort of breathing, which increased as more voluntary (cortical) motor command was needed to maintain the ventilation target. In contrast air hunger remained at zero throughout because the prevailing level of reflex (medullary) drive was low throughout. Lower panel: Ventilation was stimulated by hypercapnia to achieve approximately 30 liter•min−1. In the lower panel it can be seen that during CO2-driven hyperpnea air hunger increased in concert with work and effort because medullary motor command was elevated (implying greater medullary corollary discharge). The degree of partial paralysis was sufficient to reduce vital capacity by 40% compared to control (and reduced handgrip strength by 60%); full vital capacity had returned at the time of recovery measurements. (Data re-plotted with permission from Figure 2 in Reference 160); license # 4826560010506.
Figure 12.
Figure 12.
Lack of effect of opiate on work/effort breathing discomfort (left panel) contrasts with pronounced effect of opiate on air hunger breathing discomfort (right panel). This is another demonstration that air hunger is distinct from work/effort sensations because they can be separately manipulated. The left panel shows data re-plotted from Figure 1 of Supinski et al (232). Subjects breathed against large inspiratory threshold loads, but respiratory rate and tidal volume were well maintained, from which we infer that blood gasses were not compromised (there were no measures of arterial or end-tidal gasses). Ratings of “discomfort” are expressed as percent of full scale (%FS). The minimum and maximum ends of the scale were not defined, but seven descriptors were placed along the scale. The maximum discomfort elicited by the largest threshold load (74% of maximum static inspiratory pressure) was equivalent to the verbal scale label “unpleasant”; the low ratings of discomfort in this experiment probably reflect the fact that respiratory work tasks are not very unpleasant in the absence of air hunger (20). Breathing discomfort following opiate was not different in this work/effort model. The right panel shows data replotted from reference (15). In this experiment subjects rated “breathing discomfort” on a visual analog scale, where the scale maximum was defined as “unbearable”; these ratings are expressed as %FS. Inspired PCO2 was varied while ventilation was restricted to approximately 0.13 l•min−1 with a background of constant hyperoxia (FIO2 = 30%). Ratings were obtained over a range of PETCO2. Regression lines were obtained for each subject in each condition, then averaged to obtain the mean regressions shown here. The large decrease in breathing discomfort with opiate was statistically significant in this air hunger model. The drug, dosage, and route of administration differed between studies, but we assess them as roughly equivalent opiate doses. Supinski et al confirmed effective analgesia following oral codeine using a cold pressor test. (Data replotted from references 15, 232). Adapted with permission of the American Thoracic Society (ATS). Copyright © 2020 ATS. All rights reserved. Am Rev Respir Dis 141: 1516–1521 and Am J Respir Crit Care Med 184: 920–927. The Am J Respir Crit Care Med and Am Rev Respir Dis are official journals of the ATS. Readers are encouraged to read the entire articles for the correct context at [https://doi.org/10.1164/ajrccm/141.6.1516%20 & https://doi.org/10.1164/rccm.201101-0005OC]. The authors, editors, and The ATS are not responsible for errors or omissions in adaptations.
Figure 13.
Figure 13.
Air hunger during complete paralysis, showing that respiratory muscle contraction is not necessary for air hunger. Because this experiment disproved a long-held tenet, it was repeated by a completely independent laboratory. Left panel shows data extracted from Figure 3 in reference (95); right panel shows data extracted from Figure 3 in reference (16). In both cases the subject (both authors of their respective studies) was totally paralyzed with curariform neuromuscular block and mechanically ventilated at constant tidal volume and frequency (Left VT = 1.0 L, f = 8.8, SpO2 >98%; right VT = .92 L, f = 12.5, FIO2 >90%). Time ticks in both panels are at 100 sec intervals. As explained more fully in the text, the air hunger response lags changes in end-tidal PCO2 and changes in tidal volume (14, 85); therefore, air hunger measurements are offset in time to account for the slow air hunger dynamic response. Subjects were told to rate “respiratory discomfort” (left panel) or “air hunger” (right panel); both subjects chose the descriptor “urge to breathe” in debriefing. Rating scale on left was marked “severe” at 50% Full Scale and “maximal” at 100%FS; Rating scale on right was marked “slight plus” at 50% Full Scale and “extreme, intolerable” at 100%FS. From references (16) and (95) with permission; license #4823790296315 & #4826560802572.
Figure 14.
Figure 14.
Putative ‘respiratory corollary discharge’ recorded in the thalamus of a decorticate, paralyzed cat. This is one example of thalamic neurons that responded to increased respiratory motor activity. Just before the beginning of the record mechanical ventilation was paused. As PCO2 rose during the ‘breath hold’, brainstem ventilatory motor output (reflected in phrenic nerve activity) increased. About midway through the record a threshold appears to be reached, and there was a profound progressive increase in thalamic activity. This mirrors the rise of air hunger sensation seen during a breath hold starting at low PETCO2 in human subjects (91, 173). Similar responses have been observed in midbrain neurons (46). These observations suggest a neural substrate in accord with the theory that air hunger arises from corollary discharge carrying information about medullary motor activity to cortical sensory regions (Hypothesis 3). (adapted with permission from Fig 1 in reference 47) license #4826561235292.
Figure 15.
Figure 15.
Effect of neural lesions on mechanoreceptor relief of air hunger (effect of ventilation on air hunger). This graph demonstrates the predominant effect of pulmonary mechanoreceptors compared to rib cage and diaphragm mechanoreceptors. In all cases moderate air hunger was evoked by elevating PETCO2 above resting level while holding ventilation constant at about 10 L•min−1 with a background of mild hyperoxia (FIO2 30–50%); this is the left-hand point on each line. Tidal volume was increased while PETCO2 was held constant by elevating inspired PCO2. The black line with filled circles shows the mean reduction of air hunger in healthy normal subjects (averaged from the 3 studies depicted in Figure 4) (85, 105, 162). The blue line with filled triangles shows the response of quadriplegics having complete spinal cord lesions at the cervical 1 to 2 level (29); Quadriplegic subjects are presumed to have no chest wall sensation, but pulmonary stretch receptor innervation via the vagus nerve is presumed intact. The green line with filled squares shows the response of heart lung transplant patients is less than normals and quadriplegics, suggesting that chest-wall afferents provide less relief (Experiment 3, in reference 105); transplant patients have intact rib cage and diaphragm innervation but were presumed to have no pulmonary innervation (although later work showed that some pulmonary innervation returns in such patients (38)).
Figure 16.
Figure 16.
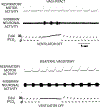
Mechanoreceptor inhibition of putative respiratory corollary discharge by vagal pulmonary mechanoreceptor afferents in decerebrated paralyzed cats (78). In the upper panel the vagus nerves are intact, and the midbrain neuron is silent during mechanical ventilation; when the ventilator is paused (‘breath hold’) activity appears in the midbrain neuron. Midbrain activity is once again inhibited when ventilation is resumed. In the lower panel, following bilateral vagotomy, the midbrain neuron is active regardless of whether the mechanical ventilator is cycling. Vagal cooling data suggested the inhibition was mediated by slowly adapting pulmonary stretch receptors (SAPSRs). This is consistent with experiments in humans with neural lesions described in the text (92, 105, 145). Adapted with permission from reference (78) license #4826561496041.
Figure 17.
Figure 17.
Adaptation of air hunger response to prevailing level of PETCO2 (from reference 28). Four ventilator dependent patients were adapted from a baseline “resting” 27 Torr PETCO2 to 41 Torr PETCO2 by slowly increasing inspired PCO2 over the course of 1–3 days. Ventilator-delivered tidal volume and respiratory rate were held constant throughout. The acute air hunger response to a CO2 stimulus was assessed before during and after adaptation. Filled diamonds with dashed line represent the average air hunger response to acutely elevated PETCO2 before and after the adaptation period; solid circles with solid line represent the air hunger response to acutely elevated PETCO2 during chronically elevated PETCO2. Adaptation and acute testing were performed during normoxia (FIO2 21%). Figure modified with permission from reference (28) with permission RightsLink.
Figure 18.
Figure 18.
Word Cloud summary of brain activations during respiratory discomfort. Numerous functional imaging studies have observed regional brain activations associated with dyspnea. These studies employed either a) mild to moderate resistive loads or b) mild hypercapnia combined with tidal volume restriction and so likely produced different qualitative forms dyspnea. The former stimulus evokes mainly work/effort sensation, while the latter evokes air hunger sensation. The composite results of 16 studies are represented with the regional activations associated with the distinct stimuli being differentiated by font color; activations exclusive to air hunger (3 studies) are shown in blue, those exclusive to work/effort (13 studies) are shown in red and activations common to both air hunger and work effort are shown in purple. The font size represents the number of studies in which each particular regional activation was observed. All studies observed activation of the insular cortex. BNST = Bed Nuclei of the Stria Terminalis.
Figure 19.
Figure 19.
Activation of the anterior insular cortex is observed in PET and fMRI studies that induce air hunger by tidal volume limitation. Panel A (adapted from reference (18)) shows a transverse PET image (8mm rostral to AC-PC baseline) from the first published brain imaging study of air hunger. Panel B (adapted from reference (26)) shows a coronal fMRI image of the same region (centered on the AC line) with red arrows indicating activations associated with the onset of air hunger and yellow arrows indicating areas associated with steady state air hunger. The insular cortex is involved in the perception of other homeostatic warning signals (e.g. pain, thirst, and food hunger) and is the most commonly observed regional activation in brain imaging studies of respiratory discomfort. The fMRI study (Panel B) also shows activation of the dorsal anterior cingulate cortex (dACC), an area involved with integration of emotional responses to adverse stimuli. From references (18) and (26) with permission; license #4825931387868 and #4830231140126
Figure 20.
Figure 20.
Functional MRI images of activation in the amygdala during respiratory discomfort. The amygdala is a component of the limbic system associated with emotional responses, particularly fear. It is activated by air hunger induced by tidal volume limitation, as observed in the fMRI study by Evans et al (Panel A, Am, transverse view at z-plane =14, adapted from reference 85). Von Leupoldt et al also observed amygdala activation associated with the ‘unpleasantness’ of uncomfortable breathing induced by resistive respiratory loads (Panel B, AM, coronal view at y=9, adapted from reference 238). From reference (85) with permission (RightsLink) and reference (238) Adapted with permission of the American Thoracic Society (ATS). Copyright © 2020 ATS. All rights reserved. Am J Respir Crit Care Med 177: 1026–1032. The Am J Respir Crit Care Med is an official journal of the ATS. Readers are encouraged to read the entire article for the correct context at [https://doi.org/10.1164/rccm.200712-1821OC]. The authors, editors, and The ATS are not responsible for errors or omissions in adaptations.
Figure 21.
Figure 21.
Proposed central network for air hunger and the emotional and behavioral responses to it. The brown lines depict the interoceptive pathway and black arrows represent known connections. BNST = bed nuclei of the stria terminals. NTS = nucleus tractus solitarius.
Figure 22.
Figure 22.
Rats avoid CO2 - induced discomfort rather than eat. The study by Neil and Weary shows that rats given 5 min of access to a chamber that contains a food reward, avoid that chamber when CO2 in the chamber rises above 10% (171). The measurable change in behavior provides proof of concept that complex integrated processes can be included in an animal model of air hunger. Developing an animal model of air hunger presents novel issues. Because air hunger is an amalgam of integrated afferent inputs that lead to emotional and behavioral responses, a robust model cannot simply measure reflex responses, but should encompass higher cortical processes. Inspired CO2 concentrations above 10% are rarely used in human studies, but the rats in this study were free breathing and afforded the mechanoreceptor relief that it brings (see Section on the quantitative relationship between stimulus and air hunger Part B – changing ventilation while holding ventilatory drive constant.). The rats were being encouraged to tolerate hypercapnia through the enticement of a food reward, whereas positive rewards have not been used in human studies of air hunger. There may also be important species differences in chemoreception, which is a fundamental physiological aspect that should be considered in animal model development. From reference (171) with permission. License #4825940537868.
Figure 23.
Figure 23.
Air hunger is the dominant sensory quality of breathing discomfort in hospitalized patients. Graph depicts the frequency with which sensory qualities are chosen by hospital inpatients as the most apt description of their dyspnea. The prominence of air hunger sensation increases as clinical dyspnea worsens. Responses are grouped by the overall level of breathing discomfort on a scale of 0 to 10 where 10 is ‘unbearable’. Graph summarizes 460 responses from 156 patients interviewed repeatedly during the hospital stay utilizing the Multidimensional Dyspnea Profile. Reprinted from reference (225) with permission. License #4830241184265.
Figure 24.
Figure 24.
Air hunger (also termed ‘unsatisfied inspiration’) becomes the dominant sensory quality of breathing discomfort in pulmonary patients undergoing progressive exercise. Graph depicts the frequency with which sensory qualities are chosen by patients with pulmonary hypertension (n=26) as the most apt description of their dyspnea during symptom-limited incremental cycle exercise. The sudden rise in selection of air hunger coincides with the point at which tidal volume becomes limited by declining inspiratory capacity. From reference (32); reproduced with permission of the © ERS 2020: European Respiratory Journal 55 (2) 1802108; DOI: 10.1183/13993003.02108-2018 Published 12 February 2020.

References

    1. Adams L, Lane R, Shea SA, Cockcroft A, and Guz A. Breathlessness during different forms of ventilatory stimulation: a study of mechanisms in normal subjects and respiratory patients. Clin Sci 69: 663–672, 1985. - PubMed
    1. Amendola L, and Weary DM. Evidence for consistent individual differences in rat sensitivity to carbon dioxide. PLoS One 14: e0215808, 2019. - PMC - PubMed
    1. Amour FE, and Smith DL. A method for determining loss of pain sensation. J Pharmacol Exp Ther 72: 74, 1941.
    1. Anton F, Euchner I, and Handwerker HO. Psychophysical examination of pain induced by defined CO2 pulses applied to the nasal mucosa. Pain 49: 53–60, 1992. - PubMed
    1. Anton F, Peppel P, Euchner I, and Handwerker HO. Controlled noxious chemical stimulation: responses of rat trigeminal brainstem neurones to CO2 pulses applied to the nasal mucosa. Neurosci Lett 123: 208–211, 1991. - PubMed

Publication types

LinkOut - more resources