

The Influence of Multiple Chronic Conditions on Symptom Clusters in People With Solid Tumor Cancers
- PMID: 33577204
- PMCID: PMC8357857
- DOI: 10.1097/NCC.0000000000000915
The Influence of Multiple Chronic Conditions on Symptom Clusters in People With Solid Tumor Cancers
Abstract
Background: People with cancer who also have multiple chronic conditions (MCCs) experience co-occurring symptoms known as symptom clusters.
Objective: To describe MCC and symptom clusters in people with cancer and to evaluate the relationships between MCCs and symptom severity, symptom interference with daily life, and quality of life (QoL).
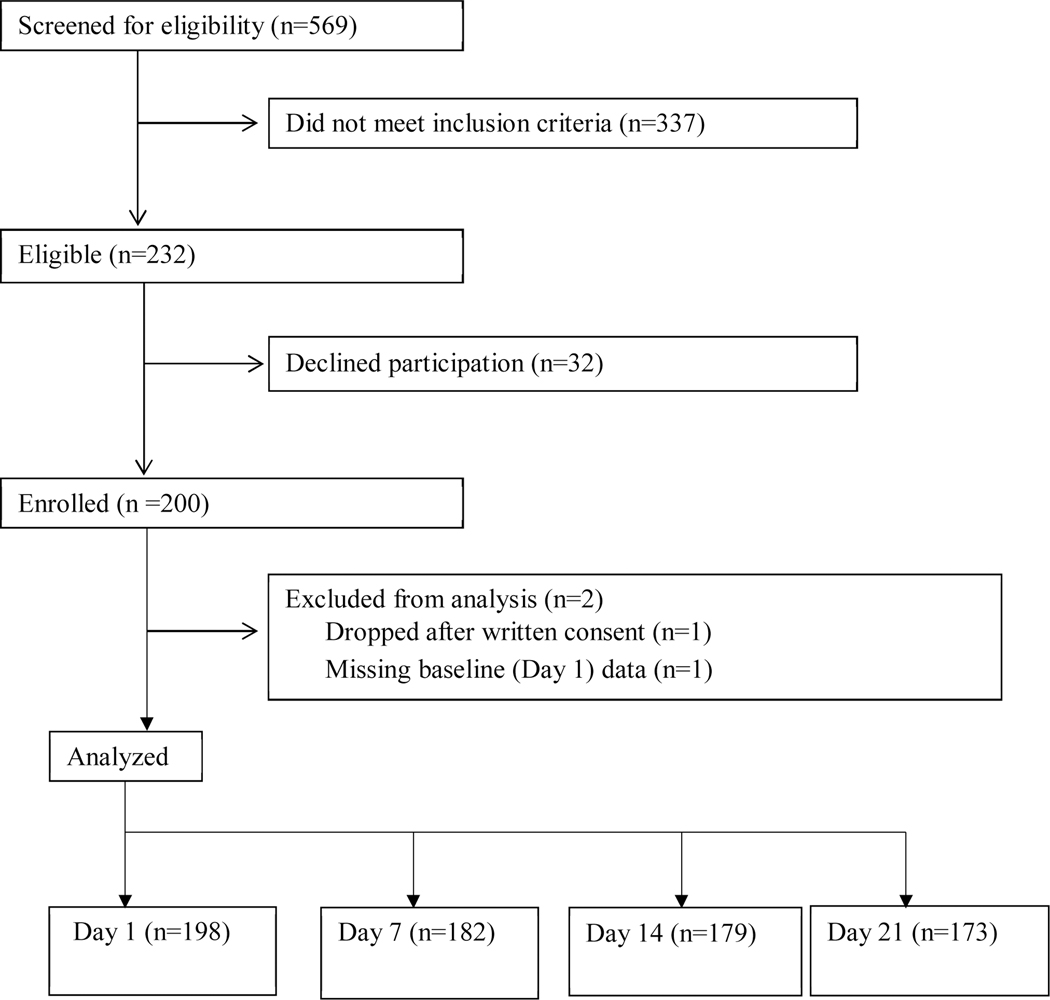
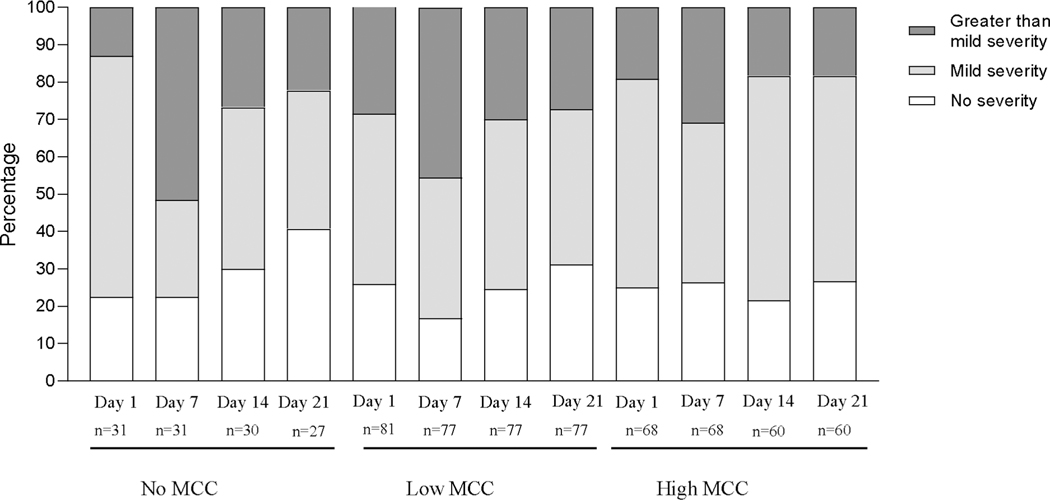
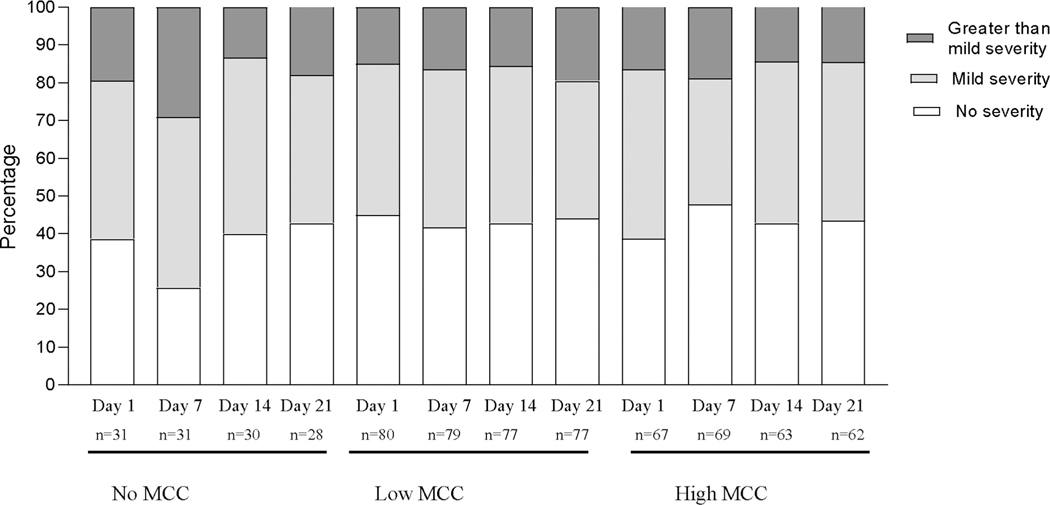
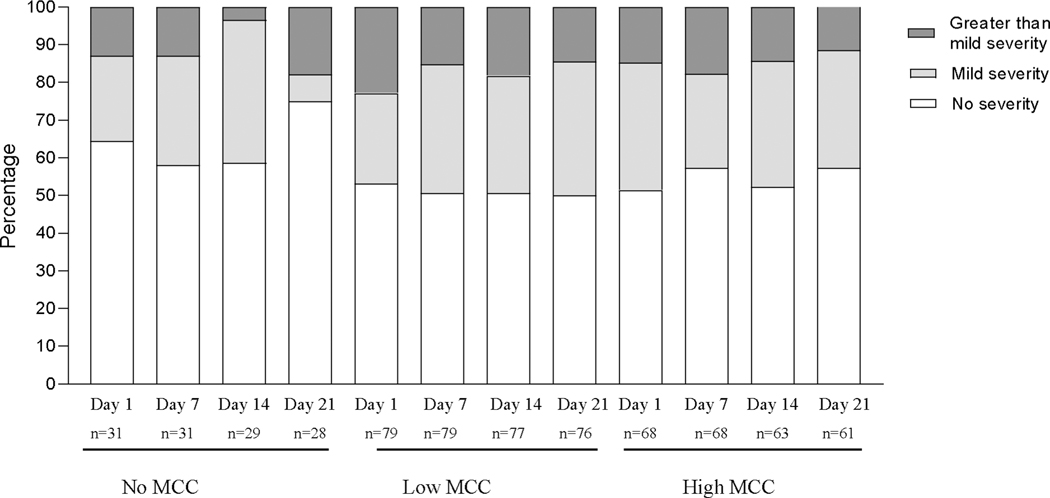
Methods: Weekly over a 3-week chemotherapy cycle, 182 adults with solid tumor cancer receiving chemotherapy completed measures of symptom severity, symptom interference with daily life, and QoL. Medical records reviewed to count number of MCCs in addition to cancer. Exploratory factor analysis was performed to identify symptom clusters. The relationships between the number of MCCs and the outcomes (symptom severity and symptom interference with daily life and QoL) at each time point were examined using the χ2 test. Longitudinal changes in outcomes were examined graphically.
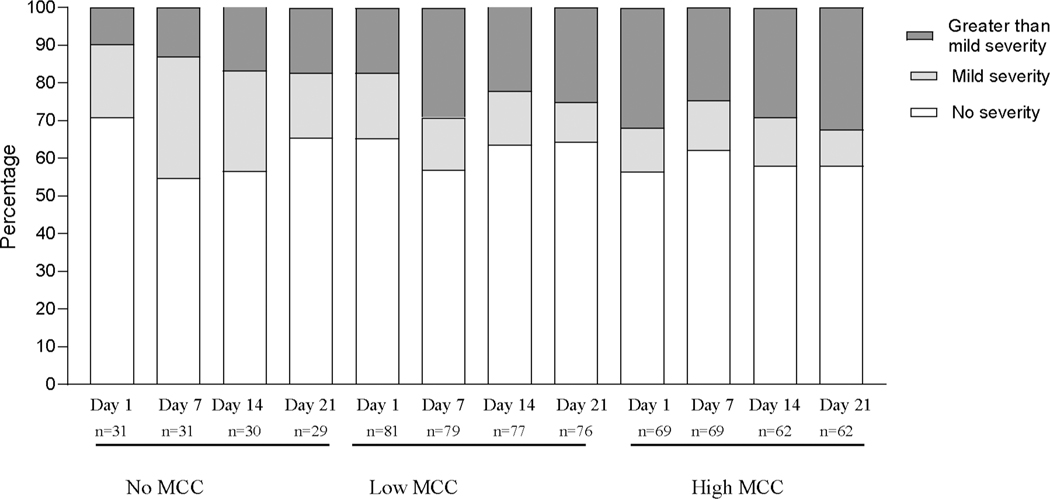
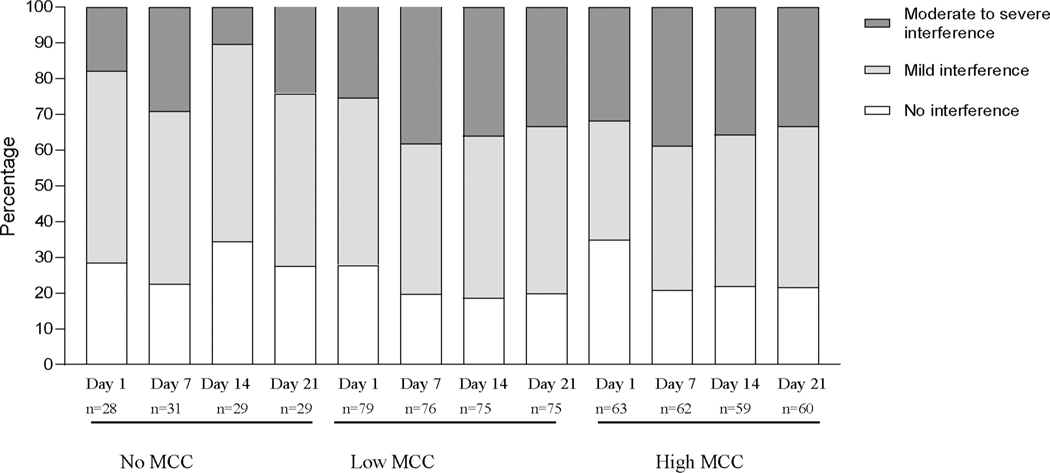
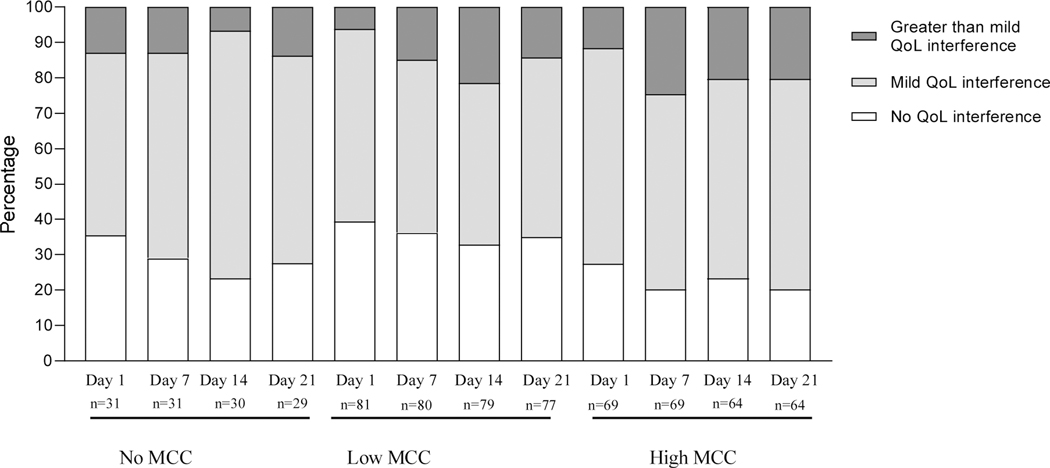
Results: The number of MCCs ranged from 0 to 9, but most participants (62.1%) had 2 or fewer MCCs. Obesity was the most prevalent chronic condition. Four symptom clusters were identified: nutrition, neurocognitive, abdominal discomfort, and respiratory clusters. At each time point, no significant differences were found for MCCs and any outcome. However, symptom severity in all the symptom clusters, symptom interference with daily life, and QoL demonstrated a worsening in the week following chemotherapy.
Conclusion: A majority of our sample had 2 or fewer MCCs, and MCCs did contribute to patient outcomes. Rather, timing of chemotherapy cycle had the greatest influence of patient outcomes.
Implications for practice: Additional support on day 7 of chemotherapy treatment is needed for people with MCCs.
Copyright © 2021 Wolters Kluwer Health, Inc. All rights reserved.
Conflict of interest statement
The authors have no conflicts of interest to disclose.
Figures
Similar articles
-
Distress-Based Gastrointestinal Symptom Clusters and Impact on Symptom Interference and Quality of Life in Patients with a Hematologic Malignancy Receiving Chemotherapy.J Pain Symptom Manage. 2017 Apr;53(4):751-758. doi: 10.1016/j.jpainsymman.2016.11.005. Epub 2016 Dec 29. J Pain Symptom Manage. 2017. PMID: 28042061
-
Illness Perceptions, Coping Strategies, and Quality of Life in People With Multiple Chronic Conditions.J Nurs Scholarsh. 2020 Mar;52(2):145-154. doi: 10.1111/jnu.12540. Epub 2020 Feb 3. J Nurs Scholarsh. 2020. PMID: 32017388
-
Symptom clusters during palliative chemotherapy and their influence on functioning and quality of life.Support Care Cancer. 2017 May;25(5):1519-1527. doi: 10.1007/s00520-016-3545-z. Epub 2016 Dec 28. Support Care Cancer. 2017. PMID: 28032218
-
Symptom clusters in patients receiving chemotherapy: A systematic review.BMJ Support Palliat Care. 2022 Mar;12(1):10-21. doi: 10.1136/bmjspcare-2021-003325. Epub 2021 Dec 17. BMJ Support Palliat Care. 2022. PMID: 34921000 Free PMC article.
-
A review of the literature on symptom clusters in studies that included oncology patients receiving primary or adjuvant chemotherapy.J Clin Nurs. 2018 Feb;27(3-4):516-545. doi: 10.1111/jocn.14057. Epub 2017 Oct 10. J Clin Nurs. 2018. PMID: 28859255 Free PMC article. Review.
Cited by
-
Exploring Symptom Cluster Patterns in Adult Cancer Patients Undergoing Chemotherapy: A Systematic Review.J Korean Acad Nurs. 2024 Nov;54(4):478-494. doi: 10.4040/jkan.24041. J Korean Acad Nurs. 2024. PMID: 39663614
-
Symptom clusters in outpatients with cancer using different dimensions of the symptom experience.Support Care Cancer. 2022 Aug;30(8):6889-6899. doi: 10.1007/s00520-022-07125-z. Epub 2022 May 11. Support Care Cancer. 2022. PMID: 35543816 Free PMC article.
-
Impact of Multimorbidity on Symptom Burden and Symptom Clusters in Patients Receiving Chemotherapy.Cancer Med. 2025 Feb;14(3):e70418. doi: 10.1002/cam4.70418. Cancer Med. 2025. PMID: 39910913 Free PMC article.
-
Predictors of Unrelieved Symptoms in All of Us Research Program Participants With Chronic Conditions.J Pain Symptom Manage. 2022 Dec;64(6):555-566. doi: 10.1016/j.jpainsymman.2022.08.018. Epub 2022 Sep 9. J Pain Symptom Manage. 2022. PMID: 36096320 Free PMC article.
-
Predictors of Concordance between Patient-Reported and Provider-Documented Symptoms in the Context of Cancer and Multimorbidity.Appl Clin Inform. 2024 Oct;15(5):1130-1139. doi: 10.1055/s-0044-1791820. Epub 2024 Dec 25. Appl Clin Inform. 2024. PMID: 39721578
References
-
- Multiple Chronic Conditions Centers for Medicaid and Medicaid Services website. https://www.cms.gov/Research-Statistics-Data-and-Systems/Statistics-Tren.... Published 2020. Accessed June 12, 2020.
-
- Friedman B, Jiang HJ, Elixhauser A. Costly hospital readmissions and complex chronic illness. Inquiry. 2008;45(4):408–421. - PubMed
-
- prevention Cfdca. About Chronic Diseases. https://www.cdc.gov/chronicdisease/about/index.htm. Published 2019. Accessed june 12, 2020, 2020.
MeSH terms
Grants and funding
LinkOut - more resources
Full Text Sources
Other Literature Sources
Medical
