

Features Constituting Actionable COVID-19 Dashboards: Descriptive Assessment and Expert Appraisal of 158 Public Web-Based COVID-19 Dashboards
- PMID: 33577467
- PMCID: PMC7906125
- DOI: 10.2196/25682
Features Constituting Actionable COVID-19 Dashboards: Descriptive Assessment and Expert Appraisal of 158 Public Web-Based COVID-19 Dashboards
Abstract
Background: Since the outbreak of COVID-19, the development of dashboards as dynamic, visual tools for communicating COVID-19 data has surged worldwide. Dashboards can inform decision-making and support behavior change. To do so, they must be actionable. The features that constitute an actionable dashboard in the context of the COVID-19 pandemic have not been rigorously assessed.
Objective: The aim of this study is to explore the characteristics of public web-based COVID-19 dashboards by assessing their purpose and users ("why"), content and data ("what"), and analyses and displays ("how" they communicate COVID-19 data), and ultimately to appraise the common features of highly actionable dashboards.
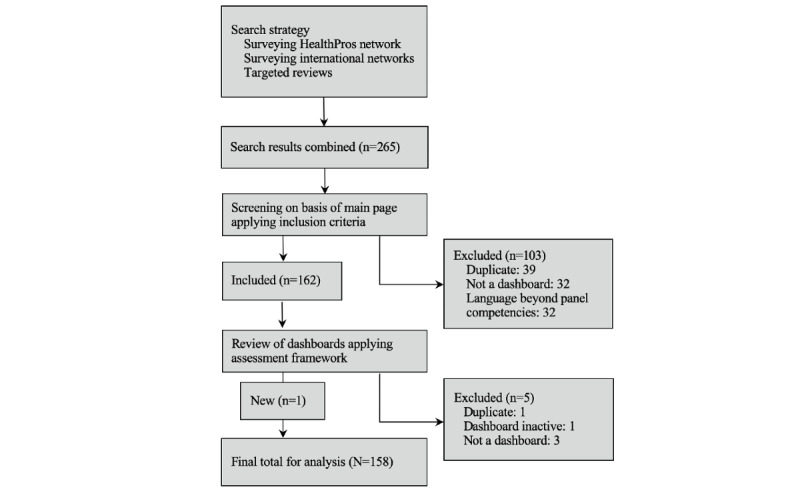
Methods: We conducted a descriptive assessment and scoring using nominal group technique with an international panel of experts (n=17) on a global sample of COVID-19 dashboards in July 2020. The sequence of steps included multimethod sampling of dashboards; development and piloting of an assessment tool; data extraction and an initial round of actionability scoring; a workshop based on a preliminary analysis of the results; and reconsideration of actionability scores followed by joint determination of common features of highly actionable dashboards. We used descriptive statistics and thematic analysis to explore the findings by research question.
Results: A total of 158 dashboards from 53 countries were assessed. Dashboards were predominately developed by government authorities (100/158, 63.0%) and were national (93/158, 58.9%) in scope. We found that only 20 of the 158 dashboards (12.7%) stated both their primary purpose and intended audience. Nearly all dashboards reported epidemiological indicators (155/158, 98.1%), followed by health system management indicators (85/158, 53.8%), whereas indicators on social and economic impact and behavioral insights were the least reported (7/158, 4.4% and 2/158, 1.3%, respectively). Approximately a quarter of the dashboards (39/158, 24.7%) did not report their data sources. The dashboards predominately reported time trends and disaggregated data by two geographic levels and by age and sex. The dashboards used an average of 2.2 types of displays (SD 0.86); these were mostly graphs and maps, followed by tables. To support data interpretation, color-coding was common (93/158, 89.4%), although only one-fifth of the dashboards (31/158, 19.6%) included text explaining the quality and meaning of the data. In total, 20/158 dashboards (12.7%) were appraised as highly actionable, and seven common features were identified between them. Actionable COVID-19 dashboards (1) know their audience and information needs; (2) manage the type, volume, and flow of displayed information; (3) report data sources and methods clearly; (4) link time trends to policy decisions; (5) provide data that are "close to home"; (6) break down the population into relevant subgroups; and (7) use storytelling and visual cues.
Conclusions: COVID-19 dashboards are diverse in the why, what, and how by which they communicate insights on the pandemic and support data-driven decision-making. To leverage their full potential, dashboard developers should consider adopting the seven actionability features identified.
Keywords: COVID-19; accessibility; communication; dashboard; expert; feature; health information management; internet; online tool; pandemic; performance measures; public health; public reporting of health care data; surveillance.
©Damir Ivanković, Erica Barbazza, Véronique Bos, Óscar Brito Fernandes, Kendall Jamieson Gilmore, Tessa Jansen, Pinar Kara, Nicolas Larrain, Shan Lu, Bernardo Meza-Torres, Joko Mulyanto, Mircha Poldrugovac, Alexandru Rotar, Sophie Wang, Claire Willmington, Yuanhang Yang, Zhamin Yelgezekova, Sara Allin, Niek Klazinga, Dionne Kringos. Originally published in the Journal of Medical Internet Research (http://www.jmir.org), 24.02.2021.
Conflict of interest statement
Conflicts of Interest: None declared.
Figures
References
-
- Sbaffi L, Rowley J. Trust and credibility in web-based health information: a review and agenda for future research. J Med Internet Res. 2017 Jun 19;19(6):e218. doi: 10.2196/jmir.7579. https://www.jmir.org/2017/6/e218/ - DOI - PMC - PubMed
-
- World Health Organization. Copenhagen: WHO Regional Office for Europe; 2020. Apr 24, [2021-02-17]. Strengthening and adjusting public health measures throughout the COVID-19 transition phases. https://apps.who.int/iris/bitstream/handle/10665/332467/WHO-EURO-2020-69....
-
- Smith P, Mossialos E, Papanicolas I, Leatherman S. Part 1: Principles of performance measurement. In: Smith P, Mossialos E, Papanicolas I, Leatherman S, editors. Performance Measurement for Health System Improvement Experiences, Challenges and Prospects. Cambridge, UK: Cambridge University Press; 2010. pp. 1–2.
MeSH terms
LinkOut - more resources
Full Text Sources
Other Literature Sources
Medical
