

Estimation of time of HIV seroconversion using a modified CD4 depletion model
- PMID: 33577551
- PMCID: PMC7880448
- DOI: 10.1371/journal.pone.0246135
Estimation of time of HIV seroconversion using a modified CD4 depletion model
Abstract
Introduction: Several methods have been proposed to estimate the time of HIV seroconversion, including those based on CD4 cell depletion models. However, previous models have failed to consider the heterogeneity that exists in CD4 trajectories among different sub-populations. Our objective was to estimate the time from HIV seroconversion relative to the HIV diagnosis date in a population-based cohort of people living with HIV (PLWH) in the province of British Columbia, Canada.
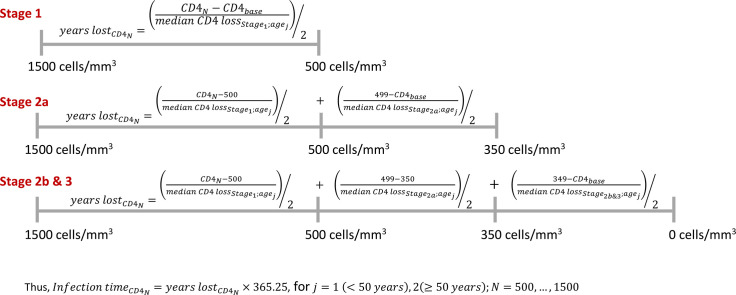
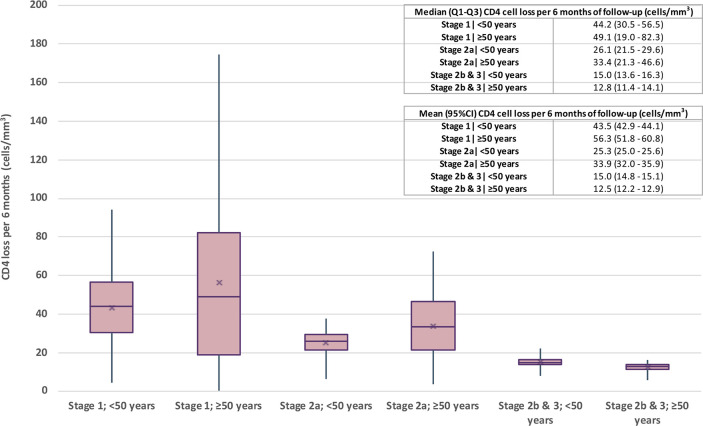
Methods: We used linked administrative and clinical data from the British Columbia Seek and Treat for Optimal Prevention of HIV/AIDS (STOP HIV/AIDS) cohort, which contains longitudinal individual-level data on all PLWH ever diagnosed in the province. Eligible participants were aged ≥18 years and diagnosed with HIV between 1989 and 2013. The outcome was pre-antiretroviral treatment CD4 cell count measurements assessed every six months. Models were stratified by age and stage of HIV infection at diagnosis. Several explanatory variables were considered including longitudinal viral load measurements. Longitudinal CD4, square root transformed, was modeled via a non-linear mixed effects model; time was modeled using an exponential decay function. We assumed a Gaussian distribution (identity link), an AR(1) correlation structure, and a random intercept and slope for the longitudinal viral load measurements. Due to the population variation in CD4 count among uninfected individuals, we assumed 500 to 1500 cells/mm3 as the normal range when estimating the time of HIV seroconversion.
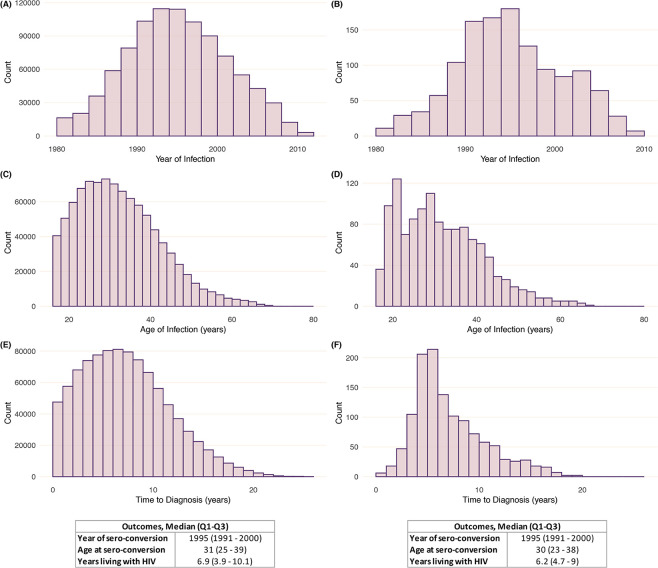
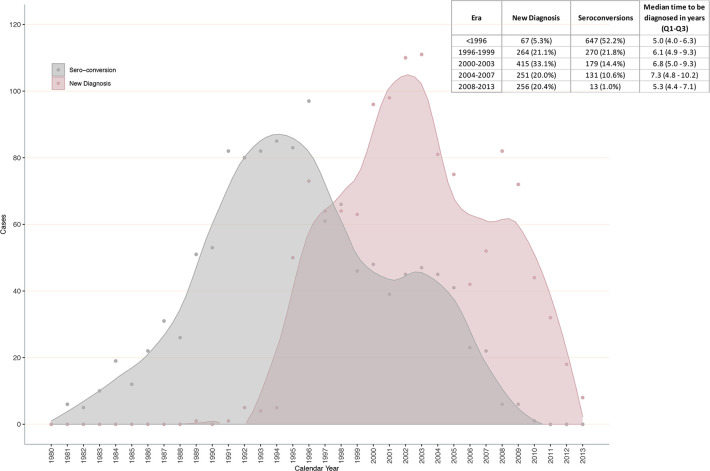
Results: Longitudinal data on 1,253 individuals were analysed: 80% male, 33% White, and the median age at diagnosis was 38 years (25th-75th percentile [Q1-Q3], 31 to 45). CD4 decay differed by stage of infection at diagnosis and age, with those ≥50 years in Stages 1 and 2 experiencing a faster decline in CD4 over time. The median duration of infection from seroconversion until HIV diagnosis was 6.9 (Q1-Q3, 3.9 to 10.1) years.
Conclusions: Considering the heterogeneity that exists in individual CD4 cell trajectories in a population, we presented a methodology that only relies on routinely collected HIV-related data, which can be further extended to estimate other epidemic measures.
Conflict of interest statement
Institutional grants have been provided to JSGM by Gilead, J&J, Merck, ViiV Healthcare. The remaining authors do not have conflicts to declare. This does not alter our adherence to PLOS ONE policies on sharing data and materials.
Figures
References
-
- Hogg RS, Eyawo O, Collins AB, Zhang W, Jabbari S, Hull MW, et al. Health-adjusted life expectancy in HIV-positive and HIV-negative men and women in British Columbia, Canada: a population-based observational cohort study. Lancet HIV. 2017;4(6):e270–e6. 10.1016/S2352-3018(17)30029-2 - DOI - PMC - PubMed
Publication types
MeSH terms
Grants and funding
LinkOut - more resources
Full Text Sources
Other Literature Sources
Research Materials
