

OpenAWSEM with Open3SPN2: A fast, flexible, and accessible framework for large-scale coarse-grained biomolecular simulations
- PMID: 33577557
- PMCID: PMC7906472
- DOI: 10.1371/journal.pcbi.1008308
OpenAWSEM with Open3SPN2: A fast, flexible, and accessible framework for large-scale coarse-grained biomolecular simulations
Abstract
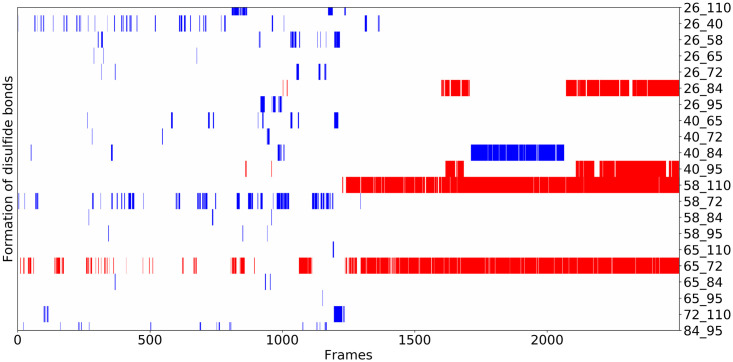
We present OpenAWSEM and Open3SPN2, new cross-compatible implementations of coarse-grained models for protein (AWSEM) and DNA (3SPN2) molecular dynamics simulations within the OpenMM framework. These new implementations retain the chemical accuracy and intrinsic efficiency of the original models while adding GPU acceleration and the ease of forcefield modification provided by OpenMM's Custom Forces software framework. By utilizing GPUs, we achieve around a 30-fold speedup in protein and protein-DNA simulations over the existing LAMMPS-based implementations running on a single CPU core. We showcase the benefits of OpenMM's Custom Forces framework by devising and implementing two new potentials that allow us to address important aspects of protein folding and structure prediction and by testing the ability of the combined OpenAWSEM and Open3SPN2 to model protein-DNA binding. The first potential is used to describe the changes in effective interactions that occur as a protein becomes partially buried in a membrane. We also introduced an interaction to describe proteins with multiple disulfide bonds. Using simple pairwise disulfide bonding terms results in unphysical clustering of cysteine residues, posing a problem when simulating the folding of proteins with many cysteines. We now can computationally reproduce Anfinsen's early Nobel prize winning experiments by using OpenMM's Custom Forces framework to introduce a multi-body disulfide bonding term that prevents unphysical clustering. Our protein-DNA simulations show that the binding landscape is funneled towards structures that are quite similar to those found using experiments. In summary, this paper provides a simulation tool for the molecular biophysics community that is both easy to use and sufficiently efficient to simulate large proteins and large protein-DNA systems that are central to many cellular processes. These codes should facilitate the interplay between molecular simulations and cellular studies, which have been hampered by the large mismatch between the time and length scales accessible to molecular simulations and those relevant to cell biology.
Conflict of interest statement
The authors have declared that no competing interests exist.
Figures


Similar articles
-
Implementation of residue-level coarse-grained models in GENESIS for large-scale molecular dynamics simulations.PLoS Comput Biol. 2022 Apr 5;18(4):e1009578. doi: 10.1371/journal.pcbi.1009578. eCollection 2022 Apr. PLoS Comput Biol. 2022. PMID: 35381009 Free PMC article.
-
Using SMOG 2 to Simulate Complex Biomolecular Assemblies.Methods Mol Biol. 2019;2022:129-151. doi: 10.1007/978-1-4939-9608-7_6. Methods Mol Biol. 2019. PMID: 31396902
-
Template-Guided Protein Structure Prediction and Refinement Using Optimized Folding Landscape Force Fields.J Chem Theory Comput. 2018 Nov 13;14(11):6102-6116. doi: 10.1021/acs.jctc.8b00683. Epub 2018 Oct 8. J Chem Theory Comput. 2018. PMID: 30240202 Free PMC article.
-
Recent Advances in Coarse-Grained Models for Biomolecules and Their Applications.Int J Mol Sci. 2019 Aug 1;20(15):3774. doi: 10.3390/ijms20153774. Int J Mol Sci. 2019. PMID: 31375023 Free PMC article. Review.
-
Modeling Structural Dynamics of Biomolecular Complexes by Coarse-Grained Molecular Simulations.Acc Chem Res. 2015 Dec 15;48(12):3026-35. doi: 10.1021/acs.accounts.5b00338. Epub 2015 Nov 17. Acc Chem Res. 2015. PMID: 26575522 Review.
Cited by
-
OpenABC enables flexible, simplified, and efficient GPU accelerated simulations of biomolecular condensates.PLoS Comput Biol. 2023 Sep 11;19(9):e1011442. doi: 10.1371/journal.pcbi.1011442. eCollection 2023 Sep. PLoS Comput Biol. 2023. PMID: 37695778 Free PMC article.
-
UNRES-GPU for physics-based coarse-grained simulations of protein systems at biological time- and size-scales.Bioinformatics. 2023 Jun 1;39(6):btad391. doi: 10.1093/bioinformatics/btad391. Bioinformatics. 2023. PMID: 37338530 Free PMC article.
-
Machines on Genes through the Computational Microscope.J Chem Theory Comput. 2023 Apr 11;19(7):1945-1964. doi: 10.1021/acs.jctc.2c01313. Epub 2023 Mar 22. J Chem Theory Comput. 2023. PMID: 36947696 Free PMC article. Review.
-
A structural dynamics model for how CPEB3 binding to SUMO2 can regulate translational control in dendritic spines.PLoS Comput Biol. 2022 Nov 8;18(11):e1010657. doi: 10.1371/journal.pcbi.1010657. eCollection 2022 Nov. PLoS Comput Biol. 2022. PMID: 36346822 Free PMC article.
-
Exploring the folding energy landscapes of heme proteins using a hybrid AWSEM-heme model.J Biol Phys. 2022 Mar;48(1):37-53. doi: 10.1007/s10867-021-09596-3. Epub 2022 Jan 9. J Biol Phys. 2022. PMID: 35000062 Free PMC article.
References
-
- Kauzmann W. Some factors in the interpretation of protein denaturation. In: Advances in protein chemistry. vol. 14. Elsevier; 1959. p. 1–63. - PubMed
Publication types
MeSH terms
Substances
LinkOut - more resources
Full Text Sources
Other Literature Sources
